1. 前言
1.1. 读者对象及用途
《EXPRESSCLUSTER® X SingleServerSafe操作指南》的读者对象为导入系统后进行维护和操作的系统管理员,就EXPRESSCLUSTER X SingleServerSafe的操作方法进行说明。
1.2. 本手册的构成
1.3. 本手册记述的术语
为提高与集群软件EXPRESSCLUSTER X SingleServerSafe X 的操作性等方面的兼容性,本手册中介绍的EXPRESSCLUSTER X SingleServerSafe,与之使用了相同的画面及命令。因此,采用了部分集群相关的术语。
请参照下列术语的说明来阅读本手册。
- 集群,集群系统
导入了EXPRESSCLUSTER X SingleServerSafe的单一服务器的系统
- 集群关闭/重启
导入了EXPRESSCLUSTER X SingleServerSafe的系统的关闭/重启
- 集群资源
EXPRESSCLUSTER X SingleServerSafe所使用的资源
- 集群对象
EXPRESSCLUSTER X SingleServerSafe所使用的各种资源的对象
- 失效切换组
汇集了EXPRESSCLUSTER X SingleServerSafe所使用的组资源(应用程序,服务等)的组
1.4. EXPRESSCLUSTER X SingleServerSafe 手册体系
EXPRESSCLUSTER X SingleServerSafe的手册分为以下4类。各指南的标题及用途如下所示。
《EXPRESSCLUSTER X安装指南》(Install Guide)
本手册的读者对象为使用了EXPRESSCLUSTER X SingleServerSafe导入系统的系统工程师,对EXPRESSCLUSTER X SingleServerSafe安装工作的步骤进行说明。
《EXPRESSCLUSTER X SingleServerSafe 设置指南》(Configration Guide)
本手册的读者对象为导入使用EXPRESSCLUSTER X SingleServerSafe的系统的系统工程师以及导入系统后进行维护和操作的系统管理员。对EXPRESSCLUSTER X SingleServerSafe构建工作的步骤进行说明。
《EXPRESSCLUSTER X SingleServerSafe 操作指南》(Operation Guide)
本手册的读者对象为导入使用了EXPRESSCLUSTER X SingleServerSafe的系统后,进行维护和操作的系统管理员。手册说明了EXPRESSCLUSTER X SingleServerSafe的操作方法。
《EXPRESSCLUSTER X SingleServerSafe 兼容功能指南》(Legacy Feature Guide)
本手册的读者对象为导入使用EXPRESSCLUSTER X SingleServerSafe的系统的系统工程师,对EXPRESSCLUSTER X SingleServerSafe 4.0 WebManager以及Builder进行了说明。
1.5. 本手册的标记规则
在本手册中,需要注意的事项,重要的事项以及相关信息等用如下方法标记
注解
表示虽然比较重要,但是并不会引起数据损失或系统以及机器损伤的信息。
重要
表示为避免数据损失和系统,机器损坏所必需的信息。
参见
表示参考信息的位置。
另外,在手册中使用以下标记法。
标记 |
使用方法 |
例 |
|---|---|---|
[ ]方括号
|
在命令名的前后,
显示在画面中的字句 (对话框,菜单等) 的前后。
|
点击[启动]。
[详细信息]对话框
|
命令行中的[ ]方括号 |
表示括号内的值可以不予指定(可省)。 |
|
等宽字体 |
路径名,命令行,系统输出(消息,提示等),目录,文件名,函数,参数 |
|
粗体
|
表示用户在命令提示符后实际输入的值。
|
输入以下内容。
clpcl -s -a
|
斜体 |
用户将其替换为有效值后输入的项目。
|
|
 在本手册的图中,为了表示EXPRESSCLUSTER X SingleServerSafe,使用该图标。
2. EXPRESSCLUSTER X SingleServerSafe 命令参考
本章中说明了在EXPRESSCLUSTER X SingleServerSafe 中可以使用的命令。
为提高与集群软件EXPRESSCLUSTER X的操作性等方面的兼容性,EXPRESSCLUSTER X SingleServerSafe与之使用了相同的命令。
本章中介绍了以下内容。
2.1. 通过命令行操作
EXPRESSCLUSTER X SingleServerSafe中准备了通过命令提示符执行的多种命令。构筑集群或无法使用Cluster WebUI时很方便。命令行可以进行在Cluster WebUI中可执行的上述种类的操作。
注解
通过查出监视资源异常的设置,在复原对象中指定组资源(应用程序资源,...),监视资源查出异常时进行复原运行的迁移时(重新启动 -> 最终动作) 请不要执行以下命令或对Cluster WebUI中的服务及组进行控制。
服务的停止/挂起
组的启动/停止
2.2. 命令列表
构筑相关
命令
说明
参考
clpcfctrl.exe将Cluster WebUI创建的配置信息发送到服务器中。为了在Cluster WebUI中使用,备份集群配置信息。clplcnsc.exe
管理本制品的正式版・试用版License。
clpcfchk.exe
检查集群配置信息。
状态显示相关
命令
说明
参考
clpstat.exe
显示EXPRESSCLUSTER X SingleServerSafe状态和设置信息。
clphealthchk.exe
确认进程的健全性。
操作相关
命令
说明
参考
clpcl.exe
服务的启动,停止,挂起,复原等。
clpstdn.exe
停止服务,关闭服务器。
clpgrp.exe
执行组的启动,停止。
clptoratio.exe
延长,显示各种超时值。
clpmonctrl.exe
暂时停止/重新启动监视资源。
clprsc.exe
暂时停止/重新启动组资源。
clpcpufreq.exe
控制CPU频率。
clprexec.exe
要求服务器处理执行。
clpregctrl
控制重启次数。
日志相关
命令
说明
参考
clplogcc.exe
收集日志,OS信息等。
clplogcf.exe
更改,显示日志级别,日志输出文件大小的设置。
clpperfc.exe
显示组,监视资源相关的集群统计信息。
脚本相关
命令
说明
参考
clplogcmd.exe
在脚本资源的脚本中描述,将任意消息输出到输出目标中。
重要
虽然安装目录下面有本手册中未记载的执行方式文件及脚本文件,但是请勿从ExpressCluste X SingleServerSafe以外执行。否则,由此导致的影响将不属于技术支持的范围。
系统监视相关(仅限使用System Resorce Agent时)
命令
说明
参考
clpprer.exe
通过给出的资源使用量数据趋势来预测未来值。
2.3. 显示状态 (clpstat命令)
显示EXPRESSCLUSTER X SingleServerSafe 的状态及设置信息。
-
命令行 - clpstat -s [--long]clpstat -gclpstat -mclpstat -i [--detail]clpstat --cl [--detail]clpstat --sv [--detail]clpstat --grp [<grpname>] [--detail]clpstat --rsc [<rscname>] [--detail]clpstat --mon [<monname>] [--detail]
-
说明 显示EXPRESSCLUSTER X SingleServerSafe的状态及设置信息。
-
选项 -
-s
-
无选项¶ 显示状态。
-
--long¶ 在最后显示集群名,资源名等名称
-
-g¶ 显示组。
-
-m¶ 显示各监视资源的状态。
-
-i¶ 显示全体的设置信息。
-
--cl¶ 显示设置信息。
-
--sv¶ 显示服务器的设置信息。
-
--grp[<grpname>]¶ 显示组的设置信息。通过指定组名,只能显示指定的组信息。
-
--rsc[<rscname>]¶ 显示组资源的设置信息。通过指定组资源名,只能显示指定的组资源信息。
-
--mon[<monname>]¶ 显示监视资源的设置信息。通过指定监视资源名,只能显示指定的监视资源信息。
-
--detail¶ 通过使用该选项,可以显示更加详细的设置信息。
-
-
返回值 0
成功
251
二重起动
上述以外
异常
-
备注 根据配置信息显示选项的不同组合,可以多种形式显示信息。
-
注意事项 - 请由具有Administrator权限的用户执行本命令。执行本命令的服务器上需要启动EXPRESSCLUSTER服务。没有指定参数或指定了-s参数的情况下,集群名,资源名等名,在中途不会被输出。
-
错误消息 消息
原因/处理方法
Log in as administrator.
将由具有Administrator权限的用户执行。
Invalid configuration file. Create valid cluster configuration data.
请使用Cluster WebUI创建正确的集群配置信息。
Invalid option.
请指定正确的选项。
Could not connect to the server. Check if the cluster service is active.
请确认EXPRESSCLUSTER服务是否已启动。
Invalid server status.
请确认EXPRESSCLUSTER服务是否已启动。
Server is not active. Check if the cluster service is active.
请确认EXPRESSCLUSTER服务是否已启动。
Invalid server name. Specify a valid server name in the cluster.
请指定集群内正确的服务器名。
Invalid heartbeat resource name. Specify a valid heartbeat resource name in the cluster.
请指定集群内正确的心跳资源名。
Invalid network partition resource name. Specify a valid network partition resource name in the cluster.
请指定集群内正确的网络分区解决资源名。
Invalid group name. Specify a valid group name in the cluster.
请指定集群内正确的组名。
Invalid group resource name. Specify a valid group resource name in the cluster.
请指定集群内正确的组资源名。
Invalid monitor resource name. Specify a valid monitor resource name in the cluster.
请指定集群内正确的监视资源名。
Connection was lost. Check if there is a server where the cluster service is stopped in the cluster.
请确认集群内是否存在EXPRESSCLUSTER服务已停止的服务器。
Invalid parameter.
可执行是命令的参数中设置了非法的值。
Internal communication timeout has occurred in the cluster server. If it occurs frequently, set the longer timeout.
EXPRESSCLUSTER的内部通信中发生了超时。如果频繁发生超时,请延长内部通信超时。Internal error. Check if memory or OS resources are sufficient.
请确认是否是内存不足或OS资源不足。
This command is already run.
本命令已被执行。不能双重启动命令。The cluster is not created.
请做成集群的配置文件并上传。
Could not connect to the server. Internal error. Check if memory or OS resources are sufficient.
请确认是否是内存不足或OS资源不足。
Cluster is stopped. Check if the cluster daemon is active.
请确认是否启动了EXPRESSCLUSTER Daemon。
Cluster is suspended. To display the cluster status, use --local option.
集群处于挂起状态。请指定--local选项显示集群状态。
2.4. 操作服务 (clpcl命令)
操作EXPRESSCLUSTER X SingleServerSafe服务。
-
命令行 - clpcl -sclpcl -t [-w <timeout>] [--apito timeout]clpcl -r [-w <timeout>] [--apito timeout]clpcl --returnclpcl --suspend [--force] [-w <timeout>] [--apito timeout]clpcl --resume
-
说明 执行EXPRESSCLUSTER X SingleServerSafe服务的启动,停止,复归,暂停,复原等命令。
-
选项 -
-s¶ 启动EXPRESSCLUSTER X SingleServerSafe服务。
-
-t¶ 停止EXPRESSCLUSTER X SingleServerSafe服务。
-
-r¶ 重启EXPRESSCLUSTER X SingleServerSafe服务。
-
--return¶ 复归EXPRESSCLUSTER X SingleServerSafe服务。
-
--suspend¶ 暂停EXPRESSCLUSTER X SingleServerSafe服务。
-
--resume¶ 复原EXPRESSCLUSTER X SingleServerSafe服务。
-
-w<timeout>¶ - 只有使用-t, -r, --suspend选项时,指定clpcl命令等待EXPRESSCLUSTER X SingleServerSafe服务停止或等待完成挂起的等待时间。单位为秒。未指定timeout时将一直等待。timeout中指定了"0"时,不作等待。未指定-w选项(默认值)时,等待时间为(心跳超时×2)秒。
-
--force¶ 由于和--suspend选项一起使用,不管服务器状态,强行执行挂起。
-
--apitotimeout¶ - 可以秒为单位指定EXPRESSCLUSTER Daemon的停止,重新启动,挂起的等待时间(内部通信超时)。可指定为1-9999的值。不指定[--apito]选项时,请按照集群属性的内部通信超时所设置的值,进行等待。
-
-
返回值 0
成功
0 以外
异常
-
备考 - 指定-s或—resume选项来执行本命令时,在对象服务器中处理开始时返回控制。指定-t或--suspend选项来执行本命令时,等待处理结束后返回控制。指定-r选项来执行本命令时,对象服务器的EXPRESSCLUSTER X SingleServerSafeDaemon服务从暂停到启动时返回控制。请使用clpstat命令确认EXPRESSCLUSTER X SingleServerSafeDaemon服务是否未启动或挂起。
-
注意事项 - 请以拥有Administrator权限的用户身份执行该命令。组在启动处理中,停止处理中不能执行该命令。请在EXPRESSCLUSTER X SingleServerSafe服务处于已启动的状态下执行挂起。执行复原时,请使用clpstat命令确认EXPRESSCLUSTER X SingleServerSafe服务是否未启动。
-
关于挂起/复原 - 要更新集群配置信息,升级EXPRESSCLUSTER X SingleServerSafe等时,可以在继续操作业务时停止EXPRESSCLUSTER X SingleServerSafe服务。此种状态称为挂起。从挂起状态返回到普通的业务状态叫做复原。对服务器请求挂起/复原处理。请在服务器的EXPRESSCLUSTER X SingleServerSafeDaemon已启动的状态下执行挂起。在挂起状态下,启动的资源保持启动状态,停止EXPRESSCLUSTER X SingleServerSafe服务,会导致以下功能停止。
停止所有监视资源。
无法操作组及组资源。(启动,停止)
不能使用以下命令。
clpcl的-resume以外的其他选项
clpstdn
clpgrp
clprsc
clptoratio
clpmonctrl
-
错误消息 消息
原因/处理方法
Log in as administrator.
请以拥有Administrator权限的用户身份执行该命令。
Invalid configuration file. Create valid cluster configuration data .
请用Cluster WebUI创建正确的集群配置信息。
Invalid option.
请指定正确的选项。
Performed stop processing to the stopped cluster service.
对已停止的EXPRESSCLUSTER服务执行了停止处理。
Performed startup processing to the active cluster service.
对已启动的EXPRESSCLUSTER服务执行了启动处理。
Command timeout.
命令超时。
Failed to return the server. Check the status of failed server.
复原服务器失败。请确认处理失败的服务器的状态。
Could not connect to the server. Check if the cluster service is active.
请确认是否启动了EXPRESSCLUSTER服务。
Could not connect to the data transfer server. Check if the server has started up.
请确认是否启动了服务器。
Failed to obtain the list of nodes. Specify a valid server name in the cluster.
请指定集群中正确的服务器名。
Failed to obtain the service name.
获取服务名失败。
Failed to operate the service.
服务控制失败。
Resumed the cluster service that is not suspended.
对不是挂起状态的EXPRESSCLUSTER服务执行了恢复处理。
Invalid server status.
请确认是否启动了EXPRESSCLUSTER服务。
Server is busy. Check if this command is already run.
可执行已经执行本命令。请确认。
Server is not active. Check if the cluster service is active.
请确认是否启动了EXPRESSCLUSTER服务。
There is one or more servers of which cluster service is active. If you want to perform resume, check if there is any server whose cluster service is active in the cluster.
执行恢复时,请确认集群中是否有已启动EXPRESSCLUSTER服务的服务器。
All servers must be activated. When suspending the server, the cluster service need to be active on all servers in the cluster.
执行挂起时,需要集群中的所有服务器都启动EXPRESSCLUSTER服务。
Resume the server because there is one or more suspended servers in the cluster.
集群中有挂起的服务器,请执行恢复。
Invalid server name. Specify a valid server name in the cluster.
请指定集群中正确的服务器名。
Connection was lost. Check if there is a server where the cluster service is stopped in the cluster.
请确认集群中是否有停止了EXPRESSCLUSTER服务的服务器。
invalid parameter.
命令参数中可执行设置了错误的值。
Internal communication timeout has occurred in the cluster server. If it occurs frequently, set the longer timeout.
EXPRESSCLUSTER的内部通信超时。如果频繁出现该现象,请将内部通信超时设为更长的时间。Processing failed on some servers. Check the status of failed servers.
对所有的服务器执行了停止处理时,有处理失败的服务器。请确认处理失败的服务器的状态。Internal error. Check if memory or OS resources are sufficient.
内存不足或OS资源不足。请确认。
2.5. 服务器关机 (clpstdn命令)
关闭服务器。
-
命令行
clpstdn [-r]
-
说明 停止,关闭服务器的EXPRESSCLUSTER X SingleServerSafe服务。
-
返回值 0
成功
0 以外
异常
-
备考 本命令在组停止处理结束后返回控制。
-
注意事项 - 请以拥有Administrator权限的用户身份执行该命令。组在启动处理中,停止处理中不能执行该命令。
-
错误消息 请参考"操作服务 (clpcl命令)"。
2.6. 操作组 (clpgrp 命令)
操作组。
-
命令行 - clpgrp -s [<grpname>] [--apito timeout]clpgrp -t [<grpname>] [--apito timeout]
-
説明 执行组的启动,停止。
-
选项 -
-s[<grpname>]¶ 启动组。指定组名,则仅启动指定的组。如果未指定组名,则启动所有组。
-
-t[<grpname>]¶ 停止组。指定组名,则仅停止指定的组。如果未指定组名,则停止所有组。
-
--apitotimeout¶ - 可以秒为单位指定组的启动,停止,移动,迁移的等待时间(内部通信超时)。可指定为1-9999的值。不指定[--apito]选项时,请按照集群属性的内部通信超时所设置的值,进行等待。
-
-
返回值 0
成功
0 以外
异常
-
注意事项 - 请以拥有Administrator权限的用户身份执行该命令。必须启动EXPRESSCLUSTER X SingleServerSafe服务。
-
错误消息 消息
原因/处理
Log in as administrator.
请以拥有Administrator权限的用户身份执行。
Invalid configuration data. Create valid cluster configuration data.
请使用Cluster WebUI创建正确的集群配置信息。
Invalid option.
请指定正确的选项。
Could not connect to the server. Check if the cluster service is active.
请确认是否启动了EXPRESSCLUSTER服务。
Invalid server status. Check if the cluster service is active.
请确认是否启动了EXPRESSCLUSTER服务。
Server is not active. Check if the cluster service is active.
请确认是否启动了EXPRESSCLUSTER服务。
Invalid server name. Specify a valid server name in the cluster.
请指定集群中正确的服务器名。
Connection was lost. Check if there is a server where the cluster service is stopped in the cluster.
请确认集群中是否有停止了EXPRESSCLUSTER服务的服务器。
Invalid parameter.
命令参数中可执行设置了错误的值。
Internal communication timeout has occurred in the cluster server. If it occurs frequently, set the longer timeout.
EXPRESSCLUSTER的内部通信超时。如果频繁出现该现象,则请将内部通信超时设为更长的时间。Invalid server. Specify a server that can run and stop the group, or a server that can be a target when you move the group.
启动,停止,移动组的目标服务器有误。请指定正确的服务器。Could not start the group. Try it again after the other server is started, or after the Wait Synchronization time is timed out.
请等待其它服务器启动或等待启动等待时间超时,启动组。
No operable group exists in the server.
请确认请求处理的服务器中是否存在可处理的组。
The group has already been started on the local server.
请通过Cluster WebUI或[clpstat]命令确认组的状态。
The group has already been started on the other server. To start /stop the group on the local server, use -f option.
请通过Cluster WebUI或[clpstat]命令确认组的状态。如果要在本地服务器上启动/停止其它服务器上启动的组,请执行组的移动,或加上[-f]选项执行。The group has already been stopped.
请通过Cluster WebUI或[clpstat]命令确认组的状态。
Failed to start one or more resources. Check the status of group.
请通过Cluster WebUI或[clpstat]命令确认组的状态。
Failed to stop one or more resources. Check the status of group.
请通过Cluster WebUI或[clpstat]命令确认组的状态。
The group is busy. Try again later.
组正处于启动处理或停止处理中,请稍后再执行。
An error occurred on one or more groups. Check the status of group.
请通过Cluster WebUI或[clpstat]命令确认组的状态。
Invalid group name. Specify a valid group name in the cluster.
请指定集群中的正确的组名。
Server is isolated.
服务器处于保留(宕机后重启)状态。
Some invalid status. Check the status of cluster.
出现某种错误的状态。请确认集群的状态。
Log in as administrator.
内存不足或OS的资源不足。请确认。
Failed to migrate the group.
[-l]选项时,请确认指定的组类型是否为可迁移,虚拟机型。
The specified group cannot be migrated.
请确认组资源状态。
The specified group is not vm group.
请确认组资源的类型是否为虚拟机组资源。
Migration resource does not exist.
请确认组资源里是否有虚拟机资源。
Migration resource is not online.
请确认虚拟机资源是否启动。
Server is not in a condition to start group. Critical monitor error is detected.
请确认各服务器状态。
There is no appropriate destination for the group. Critical monitor error is detected.
请确认各服务器状态。
2.7. 收集日志 (clplogcc命令)
收集日志。
-
命令行 clplogcc [-t collect_type] [-o path] [--local] [--evt event_type ...]
-
说明 收集日志,OS信息等。
-
选项 -
无¶ 收集日志。
-
-tcollect_type¶ 指定日志收集模式。如果省略则日志收集模式为type1。
-
-opath¶ 指定收集文件的输出目标。如果省略则将日志输出到安装路径的tmp下。
-
--local¶ 不经过数据传送服务器收集本地服务器的日志。
-
--evtevent_type¶ - 指定收集的事件日志的种类。省略时收集应用程序日志,系统日志,安全日志。如果指定none,则不收集事件日志。仅在[--local]选项被指定时有效。详细请参考"指定收集的事件日志种类(--evt 选项)"。
-
-
返回值 0
成功
0 以外
异常
-
备注 由于日志文件使用zip压缩,因此请使用zip解压缩程序对其进行解压缩。
-
注意事项 请以拥有Administrator权限的用户身份执行该命令。
-
执行结果 该命令的结果所显示的处理过程如下所示。
处理过程
说明
Preparing
初始化中
Connecting
服务器连接中
Compressing
日志文件压缩中
Transmitting
日志文件发送中
Disconnecting
服务器切断中
Completion
收集日志结束
执行结果(服务器状态)如下所示。
执行结果(服务器状态
说明
Normal
正常结束了。
Canceled
由用户取消了。
Invalid Parameters
参数无效。
Compresion Error
发生了压缩错误。
Cmunication Error
发生了发送错误。
Timeout
超时。
Busy
服务器正忙。
No Free Space
磁盘没有剩余空间。
File I/O Error
发生了文件I/O错误。
Unknown Error
因其它的错误导致失败。
-
错误消息 消息
原因/处理
Log in as administrator.
请以拥有Administrator权限的用户执行。
Invalid option.
请指定正确的选项。
Collect type must be specified 'type1' or 'type2' or 'type3' or 'type4' or 'type' or'type6'. Incorrect collection type is specified.
收集类型指定有误。
Specifiable number of servers is the max number of servers that can constitute a cluster.
可指定的服务器数为可进行集群配置的最大服务器数。
Failed to obtain properties.
获取属性失败。
Failed to obtain the list of nodes. Specify a valid server name in the cluster.
请指定集群中正确的服务器名。
Invalid server name. Specify a valid server name in the cluster.
请指定集群中正确的服务器名。
Failed to collect log.
收集日志失败。
Server is busy. Check if this command is already run.
可执行已执行该命令。请确认。
Internal error. Check if memory or OS resources are sufficient.
内存不足或OS的资源不足。请确认。
2.7.1. 收集指定类型的日志 (-t 选项)
type1 |
type2 |
type3 |
type4 |
type5 |
type6 |
|
|---|---|---|---|---|---|---|
|
✓ |
✓ |
✓ |
n/a |
n/a |
n/a |
|
✓ |
✓ |
✓ |
✓ |
n/a |
n/a |
|
✓ |
✓ |
✓ |
✓ |
n/a |
n/a |
|
✓ |
✓ |
n/a |
n/a |
n/a |
n/a |
|
✓ |
✓ |
n/a |
n/a |
n/a |
n/a |
|
✓ |
✓ |
✓ |
n/a |
n/a |
n/a |
|
✓ |
✓ |
✓ |
n/a |
n/a |
n/a |
|
✓ |
✓ |
✓ |
n/a |
n/a |
n/a |
|
n/a |
✓ |
n/a |
n/a |
n/a |
n/a |
|
n/a |
n/a |
n/a |
n/a |
n/a |
n/a |
|
n/a |
n/a |
n/a |
n/a |
n/a |
✓ |
|
✓ |
✓ |
✓ |
n/a |
n/a |
✓ |
# clplogcc -t type2
未指定选项时的日志收集类型为type1。
默认收集信息
EXPRESSCLUSTER X SingleServerSafe服务器的各模块日志
EXPRESSCLUSTER X SingleServerSafe服务器的各模块的属性信息(dir)
bin下
alert\bin,webmgr\bin下
%SystemRoot%\system32\drivers下EXPRESSCLUSTER X SingleServerSafe的版本信息
OS信息
更新日志
License信息
设置文件
策略文件
共享内存的dump
EXPRESSCLUSTER的状态(clpstat --local的执行结果)
主机名,域名信息(hostname的执行结果)
网络信息(netstat的执行结果)
IP路径表信息(route print的执行结果)
进程存在状况(tasklist的执行结果)
ipconfig (ipconfig的执行结果)
文件的共享设置(net share的执行结果)
会话信息(net session的执行结果)
Windows防火墙的设定(netsh的执行结果)
SNP (Scalable Networking Pack)的设定(netsh的执行结果)
task scheduler的设定(schtasks的执行结果)
事件日志
应用程序日志(AppEvent.Evt,Application.evtx, Application.txt)
系统日志(SysEvent.Evt,System.evtx, System.txt)
安全日志 (SecEvent.Evt, Security.evtx, Security.tx)
Windows错误报告
***.wer
用户dump
***.mdmp
诊断程序报告
msinfo32.exe命令的执行结果
注册表
EXPRESSCLUSTER X SingleServerSafe服务器的注册表信息
HKLM\SOFTWARE\NEC\EXPRESSCLUSTER X SINGLESERVERSAFE\AlertHKLM\SOFTWARE\NEC\EXPRESSCLUSTER X SINGLESERVERSAFE\MirrorListHKLM\SOFTWARE\NEC\EXPRESSCLUSTER X SINGLESERVERSAFE\RCHKLM\SOFTWARE\NEC\EXPRESSCLUSTER X SINGLESERVERSAFE\VCOMdiskfltr的注册表信息
OS的注册表信息
HKLM\SYSTEM\CurrentControlSet\Services\DiskHKLM\SYSTEM\CurrentControlSet\Control\Session Manager\DOS DevicesHKLM\SYSTEM\MountedDevicesHKLM\SYSTEM\CurrentControlSet\Enum\SCSIHKLM\SYSTEM\CurrentControlSet\Enum\STORAGEHKLM\SYSTEM\CurrentControlSet\Services\symc8xxHKLM\SYSTEM\CurrentControlSet\Control\FileSystem
脚本
Cluster WebUI创建的组启动/停止脚本如果指定了上述以外的用户定义脚本则由于不包含在日志收集的采集信息中,需要另外采集。
ESMPRO/AC,ESMPRO/UPSC的日志
通过执行acupslog.exe命令收集的文件
HA 日志
系统资源情报
JVM监视日志
系统监视日志
镜像统计信息
此版本中不能收集。
集群统计信息
集群统计信息
Perf\cluster下
系统统计信息
系统统计信息
perf\system下
2.7.2. 日志文件的输出目标 (-o 选项)
文件名保存为"服务器名-log.zip"。
由于日志文件使用zip压缩,因此请使用zip解压缩程序对其进行解压缩。
未指定-o选项时
在安装路径的tmp下输出日志。
指定-o选项时
若执行以下命令,则将日志输出到指定的目录
C:\tmp下。# clplogcc -o C:\tmp
2.7.3. 指定收集的事件日志种类(--evt 选项)
事件日志的种类 |
指定文字 |
|---|---|
应用程序日志 |
app |
系统日志 |
sys |
安全日志 |
sec |
不收集 |
none |
例)收集系统日志和安全日志时
# clplogcc --local --evt sys sec
仅在[--local]选项被指定时有效。
2.7.4. 采集OS紧急关机时的信息
信息
EXPRESSCLUSTER服务器的部分模块的日志
执行命令产生的信息
主机名,域名信息(hostname的执行结果)
网络信息(netstat的执行结果)
进程存在状况(tasklist的执行结果)
ipconfig (ipconfig 的执行结果)
文件的共享设置(net share的执行结果)
会话信息(net session的执行结果)
这些信息是日志收集的默认收集信息,无需另行采集。
2.8. 反映配置信息,备份配置信息 (clpcfctrl命令)
2.8.1. 反映配置信息 (clpcfctrl --push)
在服务器上反映配置信息。
-
命令行 clpcfctrl --push -[w] [-x <path>] [-p <portnumber>] [--nocheck]
-
说明 向服务器上反映Cluster WebUI创建的配置信息。
-
选项 -
--push¶ - 反映时指定。不能省略。
-
-x¶ 反映指定目录下的配置信息时,进行指定。
-
-w¶ - 表示配置信息文件的字符编码为SJIS。一般本选项可以省略。
-
-p¶ - 指定数据发送端口的端口号。省略时使用初始值。一般无需指定
-
--nocheck¶ 不执行必要的检查操作,直接发送配置信息。为反映已发送的配置信息,请手动执行必要的操作。
-
-
返回值 0
成功
0以外
异常
-
注意事项 - 请以拥有Administrator权限的用户身份执行该命令。反映配置信息时,比较现在的配置信息与将要反映的配置信息。配置内容有变更时,输出以下的消息。按照消息指示,执行集群服务操作/组操作以后,请再次执行本命令。
消息
处理方法
Please stop EXPRESSCLUSTER X SingleServerSafe Server.
请停止服务器。
Please suspend EXPRESSCLUSTER X SingleServerSafe Server.
请暂停服务器。
Please stop the following groups.
请停止变更设置的组。
Reboot of a cluster is necessary to reflect setting.
反映设置时,请停止并重启集群。
To apply the changes you made, restart the EXPRESSCLUSTER X SingleServerSafe Web Alert service.
反映设置时,请重启EXPRESSCLUSTER X SingleServerSafe Web警报服务。
To apply the changes you made, restart the EXPRESSCLUSTER X SingleServerSafe Manager service.
反映设置时, 请重启EXPRESSCLUSTER X SingleServerSafe Manager服务。
Start of a cluster is necessary to reflect setting.
首次构建时的消息。请启动集群。
--nocheck选项只用于维护步骤等特别的用途。平时请不要使用。
-
错误消息 消息
原因/处理
Log in as administrator.
请以拥有Administrator权限的用户身份执行该命令。
This command is already run.
已启动该命令。
Invalid option.
选项有误。请确认选项。
Invalid mode. Check if --push or --pull option is specified.
请确认是否指定了[--push]。
Invalid host name. Server specified by -h option is not included in the configuration data
配置信息中不包含[-h]指定的服务器。请确认指定的服务器名或IP地址是否正确。
Failed to initialize the xml library. Check if memory or OS resources are sufficient.
内存不足或OS资源不足。请确认。
Failed to load the configuration file. Check if memory or OS resources are sufficient.
内存不足或OS资源不足。请确认。
Failed to change the configuration file. Check if memory or OS resources are sufficient.
内存不足或OS资源不足。请确认。
Failed to load the all.pol file. Reinstall the cluster.
请重装EXPRESSCLUSTER服务器。
Failed to load the cfctrl.pol file. Reinstall the cluster.
请重装EXPRESSCLUSTER服务器。
Failed to get the install path. Reinstall the cluster.
请重装EXPRESSCLUSTER服务器。
Failed to initialize the trncl library. Check if memory or OS resources are sufficient.
内存不足或OS的资源不足。请确认。
Failed to connect to trnsv. Check if the other server is active.
与服务器连接失败。请确认是否启动了其它服务器。
Failed to get the list of node. Check if the server specified by -c is a member of the cluster.
请确认[-c]指定的服务器是否为集群成员。
File delivery failed. Failed to deliver the configuration data. Check if the other server is active and run the command again.
发送配置信息失败。请确认是否启动了其它服务器。启动服务器后请再次执行命令。Multi file delivery failed. Failed to deliver the configuration data. Check if the other server is active and run the command again.
发送配置信息失败。请确认是否启动了其它服务器。启动服务器后请再次执行命令。Failed to deliver the configuration data. Check if the other server is active and run the command again.
发送配置信息失败。请确认是否启动了其它服务器。启动服务器后请再次执行命令。Failed to upload the configuration file. Check if the other server is active and run the command again.
发送配置信息失败。请确认是否启动了其它服务器。
Canceled to deliver the configuration file since it failed to connect to one or more server. If you want to deliver the configuration file to servers that can be connected, run the command again with "--force" option.
中止了配置信息的发送。有服务器连接失败。如果仅想对可连接的服务器发送配置信息,则请使用[--force]选项再次执行命令。
The directory "work" is not found. Reinstall the cluster.
请重新安装EXPRESSCLUSTER服务器。
Failed to make a working directory.
内存不足或OS资源不足。请确认。
The directory does not exist.
内存不足或OS资源不足。请确认。
This is not a directory.
内存不足或OS资源不足。请确认。
The source file does not exist.
内存不足或OS资源不足。请确认。
The source file is a directory.
内存不足或OS资源不足。请确认。
The source directory does not exist.
内存不足或OS资源不足。请确认。
The source file is not a directory.
内存不足或OS资源不足。请确认。
Failed to change the character code set (EUC to SJIS).
内存不足或OS资源不足。请确认。
Failed to change the character code set (SJIS to EUC).
内存不足或OS资源不足。请确认。
Failed to allocate memory.
内存不足或OS资源不足。请确认。
Failed to change the directory.
内存不足或OS资源不足。请确认。
Failed to make a directory.
内存不足或OS资源不足。请确认。
Failed to remove the directory.
内存不足或OS资源不足。请确认。
Failed to remove the file.
内存不足或OS资源不足。请确认。
Failed to open the file.
内存不足或OS资源不足。请确认。
Failed to read the file.
内存不足或OS资源不足。请确认。
Failed to copy the file.
内存不足或OS资源不足。请确认。
Failed to create the mutex.
内存不足或OS资源不足。请确认。
Internal error. Check if memory or OS resources are sufficient.
内存不足或OS资源不足。请确认。
Failed to check server property. Check if the server name or ip addresses are correct.
请确认服务器和IP地址是否正确。
Please stop the following resources.
请停止要进行变更的资源。
2.8.2. 备份配置信息(clpcfctrl --pull)
备份配置信息。
-
命令行 clpcfctrl --pull [-w] [-x <path>] [-p <portnumber>]
-
说明 为了在Cluster WebUI上使用,备份配置信息。
-
返回值 0
成功
0以外
异常
-
注意事项 请以拥有Administrator权限的用户身份执行该命令。
-
错误消息 消息
原因/处理
Log in as administrator.
请以拥有Administrator权限的用户身份执行该命令。
This command is already run.
已启动。
Invalid option.
选项有误。请确认选项。
Invalid mode. Check if --push or --pull option is specified.
请确认是否指定了[--pull]。
Failed to initialize the xml library. Check if memory or OS resources are sufficient.
内存不足或OS的资源不足。请确认。
Failed to load the configuration file. Check if memory or OS resources are sufficient.
内存不足或OS的资源不足。请确认。
Failed to change the configuration file. Check if memory or OS resources are sufficient.
内存不足或OS的资源不足。请确认。
Failed to load the all.pol file. Reinstall the cluster.
请重装EXPRESSCLUSTER服务器。
Failed to load the cfctrl.pol file. Reinstall the cluster.
请重装EXPRESSCLUSTER服务器。
Failed to get the install path. Reinstall the cluster.
请重装EXPRESSCLUSTER服务器。
Failed to initialize the trncl library. Check if memory or OS resources are sufficient.
内存不足或OS资源不足。请确认。
Failed to connect to trnsv. Check if the other server is active.
连接服务器失败。请确认是否启动了其它服务器。
The directory "work" is not found. Reinstall the cluster.
请重装EXPRESSCLUSTER服务器。
Failed to make a working directory.
内存不足或OS资源不足。请确认。
The directory does not exist.
内存不足或OS资源不足。请确认。
This is not a directory.
内存不足或OS资源不足。请确认。
The source file does not exist.
内存不足或OS资源不足。请确认。
The source file is a directory.
内存不足或OS资源不足。请确认。
The source directory does not exist.
内存不足或OS资源不足。请确认。
The source file is not a directory.
内存不足或OS资源不足。请确认。
Failed to change the character code set (EUC to SJIS).
内存不足或OS资源不足。请确认。
Failed to change the character code set (SJIS to EUC).
内存不足或OS资源不足。请确认。
Failed to allocate memory.
内存不足或OS资源不足。请确认。
Failed to change the directory.
内存不足或OS资源不足。请确认。
Failed to make a directory.
内存不足或OS资源不足。请确认。
Failed to remove the directory.
内存不足或OS资源不足。请确认。
Failed to remove the file.
内存不足或OS资源不足。请确认。
Failed to open the file.
内存不足或OS资源不足。请确认。
Failed to read he file.
内存不足或OS资源不足。请确认。
Failed to write the file.
内存不足或OS资源不足。请确认。
Failed to copy the file.
内存不足或OS资源不足。请确认。
Failed to create the mutex.
内存不足或OS资源不足。请确认。
Internal error. Check if memory or OS resources are sufficient.
内存不足或OS资源不足。请确认。
2.9. 超时临时调整 (clptoratio命令)
延长,显示当前的超时倍率。
-
命令行 - clptoratio -r <ratio> -t <time>clptoratio -iclptoratio -s
-
说明 暂时延长下列各种超时值。
资源监视
警报同步服务
WebManager服务
显示当前超时倍率。
-
选项 -
-rratio¶ - 指定超时倍率。请设置为大于等于1的整数值。最大超时倍率为10000倍。如果指定"1",则与-i选项一样,可将已更改的超时倍率还原。
-
-ttime¶ - 指定延长期间。可指定分m,小时h,日d。最大延长期间为30日。例)2m,3h,4d
-
-i¶ 还原更改的超时倍率。
-
-s¶ 参考当前的超时倍率。
-
-
返回值 0
成功
0 以外
异常
-
备注 - 如果执行服务器关机,则设置的超时倍率无效。-s选项可查看的只有当前的超时倍率。不能查看延长期间的剩余时间等。使用状态显示命令可参考原来的超时值。
监视资源超时
# clpstat --mon 监视资源名 --detail
-
注意事项 - 请以拥有Administrator权限的用户身份执行该命令。请在启动了EXPRESSCLUSTER X SingleServerSafe服务的状态下执行。设置超时倍率时,请务必指定延长期间。但如果超时倍率指定为"1",则无法指定延长期间。指定延长期间时不能指定为"2m3h"等组合。
-
执行示例 例1: 将超时倍率设为3天2倍时
# clptoratio -r 2 -t 3d
例2: 还原超时倍率时
# clptoratio -i
例3: 参考当前超时倍率时
# clptoratio -s
present toratio : 2
即可知当前的超时倍率为2。
-
错误消息 消息
原因/处理
Log in as administrator.
请以拥有Administrator权限的用户身份执行。
Invalid configuration file. Create valid cluster configuration data.
请使用Cluster WebUI创建正确的集群配置信息。
Invalid option.
请指定正确的选项。
Specify a number in a valid range.
请指定正确范围内的数字。
Specify a correct number.
请指定正确的数字。
Scale factor must be specified by integer value of 1 or more.
请将倍率指定为大于等于1的整数值。
Specify scale factor in a range less than the maximum scale factor.
请指定不超过最大倍率的倍率。
Set the correct extension period. Ex) 2m, 3h, 4d
请设置正确的延长期间。
Set the extension period in a range less than the maximum extension period.
请指定不超过最大延长期间的延长期间。
Could not connect to the server. Check if the cluster service is active.
请确认是否启动了EXPRESSCLUSTER服务。
Server is not active. Check if the cluster service is active.
请确认是否启动了EXPRESSCLUSTER服务。
Connection was lost. Check if there is a server where the cluster service is stopped in the cluster.
请确认集群中是否有停止了EXPRESSCLUSTER服务的服务器。
Invalid parameter.
命令参数中可执行设置了错误的值。
Internal communication timeout has occurred in the cluster server. If it occurs frequently, set the longer timeout.
EXPRESSCLUSTER的内部通信超时。如果频繁出现该现象,则请将内部通信超时设为更长的时间。Processing failed on some servers. Check the status of failed servers.
有处理失败的服务器。请确认集群中的服务器状态。请在启动了集群中的所有服务器的状态下执行。Internal error. Check if memory or OS resources are sufficient.
内存不足或OS资源不足。请确认。
2.10. 日志级别/大小更改 (clplogcf命令)
更改和显示日志级别,日志输出文件大小的设置。
-
命令行 clplogcf -t <type> -l <level> -s <size>
-
说明 - 更改日志级别,日志输出文件大小的设置。显示当前的设置值。
-
选项 -
-t¶ - 指定要更改设置的模块类型。省略-l或-s时,显示指定的模块类型中设置的信息。可指定的类型请参考"-t选项中可以指定的类型"表。
-
-l¶ - 指定日志级别。可指定的日志级别如下。1,2,4,8,16,32数值越大输出的日志越详细。
-
-s¶ - 指定要输出日志的文件的大小。单位是byte。
-
无¶ 显示当前设置的所有信息。
-
-
返回值 0
成功
0以外
异常
-
备注 EXPRESSCLUSTER X SingleServerSafe输出的日志在各类型上使用2个日志文件。因此需要2倍于-s所指定的磁盘容量。
-
注意事项 - 请以拥有Administrator权限的用户身份执行该命令。执行本命令需要EXPRESSCLUSTER X SingleServerSafe事件服务处于运行状态。将服务器重启后变更的设定内容会被还原为原来的设定。
-
执行示例 例1: 更改pm的日志级别时
# clplogcf -t pm -l 8
例2: 参考pm的日志级别,日志文件大小时
# clplogcf -t pm
TYPE, LEVEL, SIZE
pm, 8, 1000000
例3: 显示当前的设置值
# clplogcf
TYPE, LEVEL, SIZE
trnsv, 4, 1000000
xml, 4, 1000000
logcf, 4, 1000000
-
错误消息 消息
原因/处理
Log in as administrator.
请以拥有Administrator权限的用户身份执行该命令。
Invalid option.
选项有误。请确认选项。
Failed to change configuration. Check if the event service is running.
可执行未启动EXPRESSCLUSTER Event服务。
Invalid level.
指定的级别有误。
Invalid size.
指定的大小有误。
Failed to initialize the xml library. Check if memory or OS resources are sufficient.
内存不足或OS资源不足。请确认。
Failed to print current configuration. Check if the event service is running.
可执行未启动EXPRESSCLUSTER Event 服务。
-
[-t]选项中可以指定的类型 类型
模块
说明
alert
clpaltinsert.exe
警报
apicl
clpapicl.dll
API客户端Library
apisv
clpapisv.dll
API服务器
appli
clpappli.dll
应用程序资源
appliw
clpappliw.dll
应用程序监视资源
Armdrive
armdrive.exe
盘符设置命令
bwctrl
clpbwctrl.exe
集群启动同步等待处理控制命令
cfchk
clpcfchk.exe
集群配置检查命令
cfctrl
clpcfctrl.exe
集群生成,集群信息备份命令
cl
clpcl.exe
集群操作命令
clpdnld
clpdnld.exe
Downloader
clpgetsvcstat
clptrnsv.exe
事务服务器
clpshmstat
clpshmstat.dll
节点状态管理Library
clsv
clpclsv.dll
客户端服务
commcl
clpcommcl.dll
通用通信客户端Library
cpufreq
clpcpufreq.exe
CPU频率控制命令
diskperf
clpdiskperf.dll
磁盘性能日志输出用库
diskutil
clpdiskutil.dll
镜像磁盘/磁盘共同Library
diskw
clpdiskw.dll
磁盘RW监视资源
down
clpdown.exe
服务器关闭命令
event
clpevent.dll
事件日志
exping
clpexpng.dll
Ping执行管理
genw
genw.dll
自定义监视资源
grp
clpgrp.exe
组启动,停止,移动,迁移命令
hblog
clplanhb.dll
内核模式LAN心跳资源
healthchk
clphealthchk.exe
进程健全性确认命令
ibsv
clpibsv.exe
Information Base服务
ipw
clpipw.dll
IP监视资源
lankhb
clplanhb.dll
内核模式LAN心跳资源
lcns
clplcns.dll
LicenseLibrary
logc
clplogc.dll
日志收集Library
logcc
clplogcc.exe
日志收集命令
logcf
clplogcf.exe
日志级别,大小更改命令
logcmd
clplogcmd.exe
警报输出命令
mail
clpmail.exe
Mail信息
mgtmib
clpmgtmib.dll
SNMP联动库
miiw
clpmiiw.dll
NIC Link Up/Down监视资源
monctrl
clpmonctrl.exe
监视资源控制命令
mrw
clpmrw.dll
消息接收监视资源
mtw
clpmtw.dll
Multi-Target监视资源
nm
clpnm.exe
节点地图管理
oldapi
clpoldapi.exe
兼容API
oldapi_cnf
clpoldapi.exe
兼容API
oldapi_evt
clpoldapi.exe
兼容API
oldapi_if
clpoldapi.exe
兼容API
oldapi_sts
clpoldapi.exe
兼容API
perfc
clpperfc.exe
集群统计信息显示命令
pm
clppm
进程管理
pmsvc
clppmsvc.exe
进程管理
psw
clppsw.dll
进程名监视资源
ptun
clpptun.dll
参数调试
ptunlib
clpptun.dll
参数调试
rc
clprc.exe
组,组资源管理
rc_ex
clprc.exe
组,组资源管理
regctrl
clpregctrl.exe
重启次数控制命令
resdllc
clpresdllc.dll
资源控制Library
rm
clprm.dll
监视器管理
script
clpscript.dll
脚本资源
scrpc
clpscrpc.exe
脚本
scrpl
clpscrpl.exe
脚本
sem
clpsem.dll
信号量Library
service
clpservice.dll
服务资源
servicew
clpservicew.dll
服务监视资源
shmcm
clpshmcm.dll
共享内存Library
shmevt
clpshmevt.dll
事件Library
shmnm
clpshmnm.dll
共享内存Library
shmrm
clpshmrm.dll
共享内存Library
snmpmgr
clpsnmpmgr.dll
SNMP Trap接收Library
startup
clpstartup.exe
Startup
stat
clpstat.exe
状态显示命令
stdn
clpstdn.exe
集群关机命令
toratio
clptoratio.exe
超时倍率更改命令
trap
clptrap.exe
SNMP Trap发送命令
trncl
clptrncl.dll
事务Library
trnreq
clptrnreq.exe
集群间处理要求命令
rexec
clprexec.exe
外部监视联动处理请求命令
trnsv
clptrnsv.exe
事务服务器
userw
clpuserw.dll
用户空间监视资源
webalert
clpaltd.exe
警报同步
webmgr
clpwebmc.exe
WebManager服务
xml
xlpxml.dll
XMLLibrary
vm
clpvm.dll
虚拟机资源
vmw
clpvmw.dll
虚拟机监视资源
vmctrl
clpvmctrl.dll
VMCTRL Library
-
[-t]选项可指定的监视可选产品的类型 类型
模块
说明
db2w
clp_db2w.dll
DB2监视 (Database Agent)
ftpw
clp_ftpw.dll
FTP监视 (Internet Server Agent)
httpw
clp_httpw.dll
HTTP监视 (Internet Server Agent)
imap4w
clp_imap4w.dll
IMAP4监视 (Internet Server Agent)
jra
clpjrasvc.exe
JVM监视 (Java Resource Agent)
jraw
clpjraw.dll
JVM监视 (Java Resource Agent)
odbcw
clp_odbcw.dll
ODBC监视 (Database Agent)
oraclew
clp_oraclew.dll
Oracle监视 (Database Agent)
otxw
clp_otxw.dll
WebOTX监视 (Application Server Agent)
pop3w
clp_pop3w.dll
POP3监视 (Internet Server Agent)
psqlw
clp_psqlw.dll
PostgreSQL监视 (Database Agent)
smtpw
clp_smtpw.dll
SMTP监视 (Internet Server Agent)
sqlserverw
clp_sqlserverw.dll
SQL Server监视 (Database Agent)
sra
clpsraserviceproc.exe
系统监视/进程资源监视 (System Resource Agent)
sraw
clpsraw.dll
系统监视 (System Resource Agent)
psrw
clppsrw.dll
进程资源监视 (System Resource Agent)
tuxw
clp_tuxw.dll
Tuxedo监视 (Application Server Agent)
wasw
clp_wasw.dll
Websphere监视 (Application Server Agent)
wlsw
clp_wlsw.dll
Weblogic监视 (Application Server Agent)
2.11. 管理License (clplcnsc 命令)
进行License的管理。
-
命令行 - clplcnsc -i [licensefile...]clplcnsc -l [-a]clplcnsc -d serialno [-q]clplcnsc -d -t [-q]clplcnsc -d -a [-q]clplcnsc --reregister licensefile...
-
说明 进行本产品的产品版/试用版License的注册,浏览,删除。
-
选项 -
-i[licensefile...]¶ 如果指定License文件,则通过该文件获取并注册License信息。可以指定多个License文件。如果不指定,则通过交互方式输入并注册License信息。
-
-l[-a]¶ 浏览已注册的License。显示的项目如下所示。
项目名
说明
Serial No
序列号 (仅产品版)
User name
用户名 (仅试用版)
Key
License Key
Licensed Number of CPU
License许可数(CPU个数)
Licensed Number of Computers
License许可数(节点个数)
Start date
End date
Status
License的状态
状态
说明
valid
有效
invalid
无效
unknown
不明
inactive
expired
-
-d<param>¶ param
- serialno
删除指定序列号的License。
- -t
删除已注册的全部试用版License。
- -a
删除已注册的全部License。
-
-q¶ 删除License时不显示确认信息。请同时指定-d选项。
-
--reregisterlicensefile...¶ 请重新注册期间定制License。一般不需要执行该选项命令。
-
-
返回值 0
正常结束
1
取消
3
初始化错误
5
选项无效
8
其它内部错误
-
执行示例 注册
交互方式
# clplcnsc -i
产品版,期间定制版
选择产品区分
Selection of License Version
1.  Product Version
2.  Trial Version
e. Exit
Select License Version. [1, 2, or e (default:1)] ...
输入序列号
Enter serial number [ Ex. XXX0000000 ] ...
输入License key
Enter license key
[Ex. XXXXXXXX-XXXXXXXX-XXXXXXXX-XXXXXXXX] ...
试用版
选择产品区分
Selection of License Version
1.  Product Version
2.  Trial Version
e. Exit
Select License Version. [1, 2, or e (default:1)] ...
输入用户名
Enter user name [ 1 to 63byte ] ...
输入License key
Enter license key
[Ex. XXXXXXXX-XXXXXXXX-XXXXXXXX-XXXXXXXX] ...
指定License文件
# clplcnsc -i /tmp/cpulcns.key
参考
# clplcnsc -l
产品版
< EXPRESSCLUSTER X SingleServerSafe <PRODUCT> >

Seq... 1
Serial No..... AAAAAAAA000001
Key..... A1234567-B1234567-C1234567-D1234567
Licensed Number of CPU... 2
Status... valid

Seq... 2
Serial No..... AAAAAAAA000002
Key..... E1234567-F1234567-G1234567-H1234567
Licensed Number of Computers... 1
Status... valid
期间定制版
< EXPRESSCLUSTER X SingleServerSafe <PRODUCT> >

Seq... 1
Serial No..... AAAAAAAA000001
Key..... A1234567-B1234567-C1234567-D1234567
Start date..... 2018/01/01
End date...... 2018/01/31
Status........... valid

Seq... 2
Serial No..... AAAAAAAA000002
Key..... E1234567-F1234567-G1234567-H1234567
Status........... inactive
试用版
< EXPRESSCLUSTER X SingleServerSafe <TRIAL> >

Seq... 1
Key..... A1234567-B1234567-C1234567-D1234567
User name... NEC
Start date..... 2018/01/01
End date...... 2018/02/28
Status........... valid
删除
# clplcnsc -d AAAAAAAA000001 -q
删除
# clplcnsc -d -t -q
删除
# clplcnsc -d -a
确认删除
Are you sure to remove the license? [y/n] ...
-
注意事项 请以拥有Administrator权限的用户身份执行该命令。
使用-d选项时,同时指定-a选项,试用版License和产品版License将被全部删除。仅删除试用版License时,请并用-t选项。如果删除了产品版License时,请重新注册产品版License。参照License时,如果License中包含多个License,它们将分别显示。
-
错误消息 消息
原因/处理方法
Processed license num(success : %d, error : %d).处理的License数(成功: %d, 失败: %d)失败数不为0时,说明某种原因下处理License失败。请确认License信息是否正确。Command succeeded.
命令成功。
Command failed.
命令失败。
Log in as administrator.
无执行命令的权限。请用有Administrator权限的用户执行。
Invalid cluster configuration data. Check the cluster configuration information.
集群配置信息无效。请使用Cluster WebUI确认集群配置信息。
Initialization error. Check if memory or OS resources are sufficient.
初始化失败。可执行是内存不足或OS资源不足。请确认。
The command is already run.
命令已经执行。
The license is not registered.
未注册License。
Could not opened the license file. Check if the license file exists on the specified path.
无法向License文件进行I/O。请确认License文件是否存在于指定的路径。
Could not read the license file. Check if the license file exists on the specified path.
无法向License文件进行I/O。请确认License文件是否存在于指定的路径。
The field format of the license file is invalid. The license file may be corrupted. Check the destination from where the file is sent.
License文件的域格式无效。可执行License文件有破损。请确认文件的发送源。
The cluster configuration data may be invalid or not registered.
可执行是集群配置信息无效或未被登录。请确认。
Failed to terminate the library. Check if memory or OS resources are sufficient.
可执行是内存不足或OS资源不足。请确认。
Failed to register the license. Check if the entered license information is correct.
请确认输入的License信息是否正确。
Failed to open the license. Check if the entered license information is correct.
请确认输入的License信息是否正确。
Failed to remove the license.
删除License失败。可执行是参数错误或内存不足或OS资源不足。请确认。
This license is already registered.
该License已注册。请确认已注册的License。This license is already activated.
该License已被使用。请确认已注册的License。This license is unavailable for this product.
该License不适用于该产品。请确认License。The maximum number of licenses was reached.
已达到可以注册的最大License数。请删除到期的License。Internal error. Check if memory or OS resources are sufficient.
可执行是内存不足或OS资源不足。请确认。
2.12. 消息输出 (clplogcmd命令)
将指定的消息登录到Alert日志的命令。
-
命令行 clplogcmd -m message[--alert] [--mail] [-i ID] [-l level]
注解
一般在服务器的构筑和操作中不必要执行该命令。该命令是在脚本资源的脚本中描述后使用的命令。
-
说明 - 在脚本资源的脚本中描述,将任意的消息输出到输出目标。以以下形式输出消息。
[ID] message
-
选项 -
-
--alert
-
--mail¶ - 从alert,mail中指定输出对象 (可以指定多个)。该参数可省略。省略时alert为输出对象。
-
-iID¶ - 指定消息ID。该参数可省略。省略时,ID被设为1。
-
-llevel¶ - 指输出警报的级别。指定ERR,WARN,INFO中的任意一个。通过该级别指定Cluster WebUI上的Alert日志的图标。该参数可省略。省略时,level被设为INFO。详细信息请参考在线版手册。
-
-
返回值 0
成功
0 以外
异常
-
注意事项 - 请以拥有Administrator权限的用户身份执行该命令。-i 选项的式样与Linux版不同。由于在Windows版中警报中输出的事件ID是固定的,所以不可更改。
-
执行示例 - 例1: 指定消息,消息ID,级别时脚本资源的脚本中进行了以下描述时,消息被发送到Alert日志。
clplogcmd -m test1 -i 100 -l ERR
例2: 指定消息,输出对象,事件ID,级别时 (输出对象 mail)脚本资源的脚本中进行了以下描述时,消息被发送到通过Cluster WebUI 的集群属性设置的邮件地址。关于设置邮件地址的详细信息请参考《EXPRESSCLUSTER X SingerServerSafe 设置指南》的"其他设置的详细信息" - "集群属性" - "Alert服务标签页"。clplogcmd -m test2 --mail -i 100 -l ERR
向mail 的发送对象发送以下内容的邮件。
Message:test2
Type: logcmd
ID: 100
Host: server1
Date: 2019/04/10 10:00:00
- 3
消息中含有记号时的注意事项如下。
需要用""括起来的记号
& | < >(例 在消息中指定"&"时,输出&。)需要在前面加\的记号
\(例 在消息中指定\\时,输出\。)消息中含有空格时,需要用""括起来。
2.13. 控制监视资源 (clpmonctrl命令)
控制监视资源。
-
命令行 - clpmonctrl -s [-m resource name] [-w wait time]clpmonctrl -r [-m resource name] [-w wait time]clpmonctrl -c [-m resource name]clpmonctrl -v [-m resource name]clpmonctrl -e -m resource_nameclpmonctrl -n [-m resource_name]
-
说明 暂停/重新启动监视资源。
-
选项 -
-s,--suspend¶ 暂停监视。
-
-r,--resume¶ 重新启动监视。
-
-c,--clear¶ 重置回复操作回数。
-
-v,--view¶ 表示回复操作回数。
-
-e,--error¶ 将故障验证功能设为有效。请务必使用-m选项指定监视资源名。
-
-n,--normal¶ 将故障验证功能设为无效。请务必使用-m选项指定监视资源名,此时只有该资源属于对象。省略-m选项时,所有监视资源属于对象。
-
-m,--monitor¶ - 指定要控制的监视资源。可省略。省略时对所有监视资源进行控制。
-
-w,--wait¶ - 以监视资源为单位等待监视控制。(秒)可省略。省略时的默认值是5秒。
-
-
返回值 0
正常结束
1
执行权限非法
2
选项非法
3
初始化错误
4
配置信息非法
5
监视资源未登录
6
指定监视资源非法
10
EXPRESSCLUSTER X SingleServerSafe未启动状态
11
EXPRESSCLUSTER X SingleServerSafe 服务挂起状态
90
监视控制等待超时
128
双重启动
255
其它内部错误
-
备注 对已经暂停的监视资源进行暂停或者对已经启动的监视资源进行重新启动操作时,本命令异常结束,监视资源状态不变化。
-
注意事项 - 请以拥有Administrator权限的用户身份执行该命令。监视资源的状态通过状态显示命令或Cluster WebUI确认。请通过clpstat命令或Cluster WebUI确认监视资源的状态处于"已启动"或"暂停"后执行。如果在通过监视时机为"启动时"的监视资源将处于启动状态的对象资源暂时停止后,执行了对象资源或对象资源所属组的启动,则由于处于暂时停止状态的监视资源不会开始监视,故无法查出异常。例如,下列情况即属于以上情形。
暂时停止了正在监视应用程序资源的应用程序监视。
重新启动应用程序资源或应用程序资源所属的组。
上述情况下,可以手动进行重新启动,同时也可以通过监视异常时的恢复操作进行重新启动。
如果监视资源的复归运行设置为以下,则-v选项中显示的"FinalAction Count" 会显示「最终运行前脚本」的执行次数。最终运行前执行脚本: 有效
最终运行: "不操作"
-
错误消息 消息
原因/处理
Command succeeded.
命令成功。
You are not authorized to run the command. Log in as Administrator.
没有命令的执行权。请以拥有Administrator权限的用户身份执行命令。
Initialization error. Check if memory or OS resources are sufficient.
内存不足或OS资源不足。请确认。
Invalid cluster configuration data. Check the cluster configuration information.
集群配置信息有误。请通过Cluster WebUI确认集群配置信息。
Monitor resource is not registered.
未登录监视资源。
Specified monitor resource is not registered. Check the cluster configuration information.
未登录指定的监视资源。请通过Cluster WebUI确认集群配置信息。The cluster has been stopped. Check the active status of the cluster service by using the command such as ps command.
集群处于停止状态。请使用管理工具的[service]确认EXPRESSCLUSTER Server的启动状态。The cluster has been suspended. The cluster service has been suspended. Check activation status of the cluster service by using a command such as the ps command.
集群处于挂起状态。请使用管理工具的[service]确认EXPRESSCLUSTER Server的启动状态。
Waiting for synchronization of the cluster... The cluster is waiting for synchronization. Wait for a while and try again.
集群处于同步等待状态。请在集群同步等待结束后再次执行命令。Monitor %1 was unregistered, ignored. The specified monitor resources %1is not registered, but continue processing. Check the cluster configuration data.
指定的监视资源中有未登录的监视资源,忽略,继续处理。请通过Cluster WebUI确认集群配置信息。%1:监视资源名The command is already executed. Check the execution state by using the "ps" command or some other command.
已经执行命令。请使用task manager等确认执行状态。
Internal error. Check if memory or OS resources are sufficient.
内存不足或OS资源不足。请确认。
-
可指定-m选项的监视资源类型 类型
暂时停止/重新启动监视资源
复原操作次数的计数器的表示/复位
故障验证功能的
有效化/无效化
appliw
✓
✓
✓
diskw
✓
✓
✓
ipw
✓
✓
✓
miiw
✓
✓
✓
mtw
✓
✓
✓
servicew
✓
✓
✓
genw
✓
✓
✓
vmw
✓
✓
n/a
mrw
✓
✓
n/a
db2w
✓
✓
✓
fipw
✓
✓
✓
httpw
✓
✓
✓
imap4w
✓
✓
✓
odbcw
✓
✓
✓
oraclew
✓
✓
✓
pop3w
✓
✓
✓
psqlw
✓
✓
✓
smtpw
✓
✓
✓
sqlserverw
✓
✓
✓
tuxw
✓
✓
✓
wasw
✓
✓
✓
wlsw
✓
✓
✓
otxw
✓
✓
✓
jraw
✓
✓
✓
sraw
✓
✓
✓
psrw
✓
✓
✓
userw
✓
✓
✓
psw
✓
✓
✓
2.14. 控制组资源 (clprsc命令)
执行组资源的控制。
-
命令行 - clprsc -s resource_name [-f] [--apito timeout]clprsc -t resource_name [-f] [--apito timeout]
-
说明 启动/停止组资源。
-
选择 -
-s¶ 启动组资源。
-
-t¶ 停止组资源。
-
-f¶ 启动组资源时,启动指定的组资源所依赖的所有的组资源。
-
--apito¶ 停止组资源时,停止依赖指定组资源的所有组资源。
-
timeout¶ - 可以秒为单位指定组资源的启动,停止的等待时间(内部通信超时)。可指定为1-9999的值。不指定[--apito]选项时,请按照集群属性的内部通信超时所设置的值,进行等待。
-
-
返回值 0
正常结束
0以外
异常结束
-
注意事项 - 请以拥有Administrator权限的用户执行该命令。组资源的状态,请通过状态显示命令或者Cluster WebUI确认。
-
错误消息 消息
原因/处理
Log in as Administrator.
请以拥有Administrator权限的用户身份执行命令。
Invalid cluster configuration data. Check the cluster configuration information.
集群配置信息有误。请通过Cluster WebUI确认集群配置信息。
Invalid option.
请指定正确的选项。
Could not connect server. Check if the cluster service is active.
请确认是否启动了EXPRESSCLUSTER服务。
Invalid server status. Check if the cluster service is active.
请确认是否启动了EXPRESSCLUSTER服务。
Server is not active. Check if the cluster service is active.
请确认是否启动了EXPRESSCLUSTER服务。
Invalid server name. Specify a valid server name in the cluster.
请指定集群中正确的服务器名。
Connection was lost. Check if there is a server where the cluster service is stopped in the cluster.
请确认集群中是否有停止了EXPRESSCLUSTER服务的服务器。
Internal communication timeout has occurred in the cluster server. If it occurs frequently, set the longer timeout.
EXPRESSCLUSTER的内部通信超时。如果频繁出现该现象,请将内部通信超时设为更长的时间。The group resource is busy. Try again later.
因为组资源启动处理中或停止处理中,请稍候执行。
An error occurred on group resource. Check the status of group resource.
请通过Cluster WebUI或[clpstat]命令确认组资源的状态。
Could not start the group resource. Try it again after the other server is started, or after the Wait Synchronization time is timed out.
请等待其它服务器启动或等待启动等待时间超时,启动组资源。
No operable group resource exists in the server.
请确认请求处理的服务器中是否存在可处理的组资源。
The group resource has already been started on the local server.
请通过Cluster WebUI或[clpstat]命令确认组资源的状态。
The group resource has already been started on the other server. To start the group resource on the local server, stop the group resource.
请通过Cluster WebUI或[clpstat]命令确认组资源的状态。在本地服务器启动组资源时,请停止组。The group resource has already been stopped.
请通过Cluster WebUI或[clpstat]命令确认组资源的状态。
Failed to start group resource. Check the status of group resource.
请通过Cluster WebUI或[clpstat]命令确认组资源的状态。
Failed to stop resource. Check the status of group resource.
请通过Cluster WebUI或[clpstat]命令确认组资源的状态。
Depending resource is not offline. Check the status of resource.
因为依赖的组资源的状态不是停止完毕,不可以停止组资源。请停止依赖的组资源或者指定[-f]选项。
Depending resource is not online. Check the status of resource.
因为依赖的组资源的状态不是启动完毕,不可以启动组资源。请停止依赖的组资源或者指定[-f]选项。
Invalid group resource name. Specify a valid group resource name in the cluster.
组资源未登录。
Server is isolated.
服务器处于保留(宕机后重启)状态。
Internal error. Check if memory or OS resources are sufficient.
内存不足或OS的资源不足。请确认。
Server is not in a condition to start resource. Critical monitor error is detected.
请确认服务器状态。
2.15. CPU频率控制 (clpcpufreq命令)
进行CPU频率控制。
-
命令行 - clpcpufreq --highclpcpufreq --lowclpcpufreq -iclpcpufreq -s
-
说明 通过CPU频率控制,控制节能模式的有效/无效。
-
选项 -
--high¶ 将CPU频率数设置到最大。
-
--low¶ 降低CPU频率数设置为节能模式。
-
-i¶ 对CPU频率的控制返回到由EXPRESSCLUSTER X SingleServerSafe 控制。
-
-s¶ 显示当前的设置状态。
high 将CPU频率数设置到最大。
low 降低CPU频率数设置为节能模式
-
-
返回值 0
正常结束
0以外
异常结束
-
备注 如果在[服务器属性]的扩展设置中没有选中[使用CPU频率控制功能],则执行本命令会出错。
-
注意事项 - 请以拥有Administrator权限的用户身份执行该命令。使用CPU频率控制功能时,可以在BIOS设置中变更频率,CPU通过Windows OS电源管理功能支持频率控制。
-
错误消息 消息
原因/处理方法
Log in as Administrator.
请以拥有Administrator权限的用户身份执行该命令。
This command is already run.
该命令已经被执行。
Invalid option.
请指定正确的选项。
Invalid mode.Check if --high or --low or -i or -s option is specified.请确认[--high], [--low], [-I], [-s]其中一个选项已经被指定。Failed to initialize the xml library.Check if memory or OS resources are sufficient.内存不足或OS的资源不足。请确认。Failed to change CPU frequency settings.
请确认BIOS和OS的设置。请确认是否已启动EXPRESSCLUSTER服务。请确认是否设置为使用CPU频率控制功能。Failed to acquire CPU frequency settings.
请确认BIOS和OS的设置。请确认是否已启动EXPRESSCLUSTER服务。请确认是否设置为使用CPU频率控制功能。Failed to create the mutex.
内存不足或OS的资源不足。请确认。
Internal error. Check if memory or OS resources are sufficient.
内存不足或OS的资源不足。请确认。
2.16. 集群间的联动处理请求命令 (clptrnreq 命令)
向服务器请求执行处理。
-
命令行 clptrnreq -t request_code -h IP [-r resource_name] [-s script_file] [-w timeout]
-
说明 向其他集群的服务器发送指定的处理执行请求。
-
选项 -
-trequest_code¶ - 指定执行处理的Request Code。可以指定以下的Request Code。GRP_FAILOVER 组失效切换EXEC_SCRIPT 脚本执行
-
-hIP¶ - 通过IP地址指定发出处理执行请求的服务器。可以指定多个,用逗号隔开。最多可以指定32个IP地址。在Request Code中指定组失效切换时,请指定集群内所有服务器的IP地址。
-
-rresource_name¶ - 在Request Code中指定GRP_FAILOVER时,指定作为处理请求对象的服务器所属的资源名。指定了GRP_FAILOVER时,不可省略[-r]。
-
-sscript_file¶ - 在Request Code中指定EXEC_SCRIPT时,指定执行的脚本(Batch file,可执行的文件等)文件名(30个字符以内)。必须在[-h]指定的各个服务器的EXPRESSCLUSTER安装文件夹下的worktrnreq文件夹中预先做成脚本。指定了EXEC_SCRIPT时,不可以省略[-s]。
-
-wtimeout¶ - 命令的超时值以秒为单位指定。可以指定的最小值为5秒。未指定[-w]选项时,等待30秒。
-
-
返回值 0
正常结束
0 以外
异常结束
-
注意事项 - 请以拥有Administrator权限的用户身份执行该命令。执行本命令的服务器以及通过[-h]指定IP地址的服务器中,必须安装内部版本为10.02以上的Windows版EXPRESSCLUSTER,或者内部版本为2.0.2-1以上的Linux版EXPRESSCLUSTER。
-
执行示例 例1:拥有其他集群的appli1资源的组被失效切换时
# clptrnreq -t GRP_FAILOVER -h 10.0.0.1,10.0.0.2 -r appli1
GRP_FAILOVER 10.0.0.1: Success
GRP_FAILOVER 10.0.0.2: Success
例2:在IP地址10.0.0.1的服务器中执行脚本scrpit1.bat时
# clptrnreq -t EXEC_SCRIPT -h 10.0.0.1 -s script1.bat
EXEC_SCRIPT 10.0.0.1: Success
-
错误消息 消息
原因/处理方法
Log in as Administrator.
请以拥有Administrator权限的用户身份执行该命令。
Invalid option.
命令行选项不正确。请指定正确的选项。
All servers are busy. Check if this command is already run.
该命令可执行正在执行中。请确认。
Internal error. Check if memory or OS resources are sufficient.
内存不足或OS的资源不足。请确认。
Command timeout
OS负荷过高。请确认。
Failed to obtain the list of nodes.Specify a valid server name in the cluster.节点列表取得失败。请指定有效的IP地址。Could not connect to all data transfer server. Check if the server has started up.
指定的所有IP地址无法连接。请确认IP地址和对象服务器状态。
Could not connect to the data transfer server. Check if the server has started up.
指定的IP地址无法连接。请确认IP地址和对象服务器状态。
GRP_FAILOVER IP: Group that specified resource (resource_name) belongs is offline.
由于指定的资源所属组没有在对象服务器中启动,因此没有进行失效切换处理。
EXEC_SCRIPT IP: Specified script( script_file ) is not exist.
指定的服务器中不存在脚本。请确认。
EXEC_SCRIPT IP:Specified script (script_file) is not executable.
指定的脚本没有被执行。请确认是否有执行权限。request_code IP : This server is not permitted to execute clptrnreq.
执行命令的服务器中没有执行权限。请确认是否登陆到Cluster WebUI连接限制的IP列表。
request_code IP : REQUEST_TYPE failed in execute.
被请求的type的执行处理失败。(当前的请求是Failover或者Script任意一个被指定)
2.17. 集群间处理请求 (clprexec命令)
要求安装了EXPRESSCLUSTER X SingleServerSafe的其他服务器处理执行。
-
命令行 - clprexec --script script_file -h IP [-p port_number] [-w timeout] [-o logfile_path]clprexec --notice [mrw_name] -h IP [-k category[.keyword]] [-p port_number] [-w timeout] [-o logfile_path]clprexec --clear [mrw_name] -h IP [-k category[.keyword]] [-p port_number] [-w timeout] [-o logfile_path]
-
说明 是在原有clptrnreq命令中添加了外部监视向EXPRESSCLUSTER X SingleServerSafe服务器发出处理请求等功能(出现异常通知)的命令。
-
选项 -
--scriptscript_name¶ - 请求执行脚本。在scirpt_name中指定要执行脚本(shell脚本及可执行文件等)的文件名。需事先在以-h指定的各服务器上的EXPRESSCLUSTER X SingleServerSafe安装目录下的worktrnreq子目录下创建脚本。
-
--notice¶ - 向EXPRESSCLUSTER X SingleServerSafe服务器发送异常发生通知。请在mrw_name中指定消息接收监视资源名。省略监视资源名时,请使用-k选项指定消息接收监视资源的监视类型,监视对象。
-
--clear¶ - 请求将消息接收监视资源的状态从"异常"更改为"正常"。请在mrw_name中指定消息接收监视资源名。省略监视资源名时,请使用-k选项指定消息接收监视资源的监视类型,监视对象。
-
-hIP Address¶ - 请指定发出处理请求的EXPRESSCLUSTER X SingleServerSafe服务器的IP地址。通过使用逗号隔开可指定多个IP地址,最多可指定32个IP地址。※ 如省略本选项,则处理请求发行目标变成自身服务器。
-
-kcategory[.keyword]¶ - 指定[--notice]或[--clear]选项时,请在[category]中指定消息接收监视器上设定的监视类型。指定消息接收监视资源的关键字时,请在[category]的后面通过逗号隔开进行指定。
-
-pport_number¶ - 指定端口号。请在port_number中指定处理请求发行目标服务器中设置的数据传送端口号。省略本选项时,使用缺省29002。
-
-ologfile_path¶ - 在logfile_path指定输出本命令详细日志的文件路径。文件中会保存1次命令的日志。※ 未安装EXPRESSCLUSTER X SingleServerSafe的服务器不指定本选项时,则只变成标准输出。
-
-wtimeout¶ - 指定命令的超时时间。不指定时,默认值为180秒。最大可指定为5~999。
-
-
返回值 0
正常结束
0以外
异常结束
-
注意事项 使用[clprexec]命令发行异常发生通知时,需预先登录/启动EXPRESSCLUSTER X SingleServerSafe服务器中已设置的想要执行的异常时动作的消息接受监视资源。
拥有以-h选项指定的IP地址的服务器需满足以下条件。=安装有EXPRESSCLUSTER X SingleServerSafe X3.0以上版本= EXPRESSCLUSTER X SingleServerSafe已启动( 除--script 选项以外时)= mrw已设置/启动( --notice, --clear 选项时)[根据客户端IP地址限制连接]有效时,要追加执行[clprexec]命令设备的IP地址。
有关[根据客户端IP地址的连接限制] 请参考《EXPRESSCLUSTER X SingleServerSafe 设置指南》的"其他设置的详细信息"的"集群属性"的"WebManager标签页"。
-
执行示例 例1: 向EXPRESSCLUSTER X SingleServerSafe服务器1(10.0.0.1)发行脚本(script1.sh)执行请求时
# clprexec --script script1.bat -h 10.0.0.1
例2: 向EXPRESSCLUSTER X SingleServerSafe服务器1(10.0.0.1)发行异常发生通知※ mrw1的设置 监视类型:earthquake,监视对象:scale3指定消息接收监视资源名时
# clprexec --notice mrw1 -h 10.0.0.1 -w 30 -p /tmp/clprexec/clprexec.log
指定消息接收监视资源中设置的监视类型和监视对象时
# clprexec --notice -h 10.0.0.1 -k earthquake,scale3 -w 30 -p /tmp/clprexec/clprexec.log
例3: 向EXPRESSCLUSTER X SingleServerSafe服务器1(10.0.0.1)发行mrw1的监视状态更改请求※ mrw1的设置 监视类型:earthquake,监视对象:scale3指定消息接收监视资源名时
# clprexec --clear mrw1 -h 10.0.0.1
指定消息接收监视资源中设置的监视类型和监视对象时
# clprexec --clear -h 10.0.0.1 -k earthquake,scale3
-
错误消息 消息
原因/处理方法
success
-
Invalid option.
请确认命令的参数。
Could not connect to the data transfer servers. Check if the servers have started up.
请确认指定IP地址是否正确或拥有IP地址的服务器是否已启动。
Could not connect to all data transfer server.
请确认指定的IP地址是否正确,或使用此IP地址的服务器是否已启动。
Command timeout.
请确认拥有指定IP地址的服务器是否已完成处理。
All servers are busy.Check if this command is already run.
可执行已经执行本命令。请确认。
Group (%s) is offline.
请确认在发出处理请求的服务器中组是否已启动。
Group that specified resource(%s) belongs to is offline.
请确认指定资源所在组是否启动在处理要求的服务器上。
Specified script(%s) does not exist.
指定的脚本不存在。
%s %s : Specified resource(%s) is not exist.
指定的资源或者监视资源不存在。
%s %s : Specified resource(Category:%s, Keyword:%s) is not exist.
指定的资源或者监视资源不存在。
Specified group(%s) does not exist.
指定的组不存在。
This server is not permitted to execute clprexec.
请确认执行命令的服务器的IP地址是否已注册到限制Cluster WebUI连接的客户端IP地址列表中。
%s failed in execute.
请确认发行请求的目标EXPRESSCLUSTER服务器的状态。
2.18. 重启次数控制 (clpregctrl命令)
进行重启次数限制的控制。
-
命令行 - clpregctrl --getclpregctrl -gclpregctrl --clear -t type -r registryclpregctrl -c -t type -r registry
-
说明 在服务器上显示/初始化重启次数。
-
选项 -
-g,--get¶ 显示重启次数信息。
-
-c,--clear¶ 初始化重启次数。
-
-ttype¶ 指定要初始化重启次数的类型。可指定的类型是rc或rm。
-
-rregistry¶ 指定注册表名称。可指定的注册表名称是haltcount。
-
-
返回值 0
正常结束
1
执行权限无效
2
二重启动
3
选项无效
4
配置信息非法
10~17
内部错误
20~22
获取重启次数信息失败
90
内存定位失败
-
注意事项 请以拥有Administrator权限的用户身份执行该命令。
-
执行示例 显示重启次数信息
# clpregctrl -g
******************************
-------------------------
type : rc
registry : haltcount
comment : halt count
kind : int
value : 0
default : 0
-------------------------
type : rm
registry : haltcount
comment : halt count
kind : int
value : 3
default : 0
******************************
success.(code:0)

#
例1,2初始化重启次数。
例1: 因组资源异常而初始化重启次数时
# clpregctrl -c -t rc -r haltcount
success.(code:0)
#
例2: 因监视资源异常而初始化重启次数时
# clpregctrl -c -t rm -r haltcount
success.(code:0)
#
-
错误消息 消息
原因/处理方法
Command succeeded.
命令成功。
Log in as Administrator.
没有命令的执行权限。请以拥有Administrator权限的用户身份执行。
The command is already executed.
命令已执行。
Invalid option.
选项错误。
Internal error. Check if memory or OS resources are sufficient.
可执行是内存不足或者OS资源不足。请确认。
2.19. 资源使用量预测 (clpprer命令)
依据输入文件中记载的资源使用量数据的推移,预测未来值的推移,预测结果输出到文件。此外,也能够确认预测数据的界限值判定结果。
-
命令行 clpprer -i <inputfile> [-o <outputfile>] [-p <number>] [-t <number> [-l]]
-
说明 通过给出的资源使用量数据的趋势,预测未来值。
-
选项 -
-i<inputfile>¶ 指定要计算的未来值资源数据。
-
-o<outputfile>¶ 指定输出预测结果的文件。
-
-p<number>¶ 指定预测数据数。不指定时,求得30条预测数据。
-
-t<number>¶ 指定与预测数据相比较的阈值。
-
-l¶ 仅在通过[-t]选项设置阈值时有效的选项。小于阈值时,判定为异常。
-
-
返回值 0
没有执行阈值判定,正常结束的情况。
1
发生异常的情况。
2
输入数据经过阈值判定,判定为大于阈值的情况。
3
预测数据经过阈值判定,判定为大于阈值的情况。
4
阈值判定的结果,判定为小于阈值的情况。
5
分析目标数据数少于分析推荐数据数(120)的情况下,
输入数据经过阈值判定的结果,判定为大于阈值的情况。
6
分析目标数据数少于分析推荐数据数(120)的情况下,
预测数据经过阈值判定的结果,判定为大于阈值的情况。
7
分析目标数据数少于分析推荐数据数(120)的情况下,经阈值判定的结果,判定为小于阈值的情况。
-
注意事项 - 仅在系统监视资源(System Resource Agent) 已登录权限的情况下,可以使用本命令。(登录了license的话在集群配置中不需要设定系统监视资源。)在选项-i 中指定的资源数据文件最多为500条输入数据。预测资源使用量需要一定的输入数据数。但是,输入数据数过多时,会延长分析所需的处理时间,因此,推荐的输入数据数为120条左右。另外,在选项-p可指定的输出数据最多为500条。输入数据的时刻数据没有按升序排列时会发生不能执行正确预测的情况。输入文件,请按升序排列时刻数据。
-
输入文件 有关输入文件格式的说明。关于希望获取的预测结果资源使用量,输入文件可按照下述模板准备记载文件。
输入文件为CSV格式,1条数据按照[日期时间,数值]的形式进行记载。另外,日期时间格式为YYYY/MM/DD hh:mm:ss。文件例
2012/06/14 10:00:00,10.0
2012/06/14 10:01:00,10.5
2012/06/14 10:02:00,11.0
-
执行例 通过简单的预测未来值例进行说明。
在输入数据中检测异常
输入数据的最新值大于阈值的情况下,判定为异常并返回值2。输入数据数少于推荐值(=120)的情况下,返回值5。
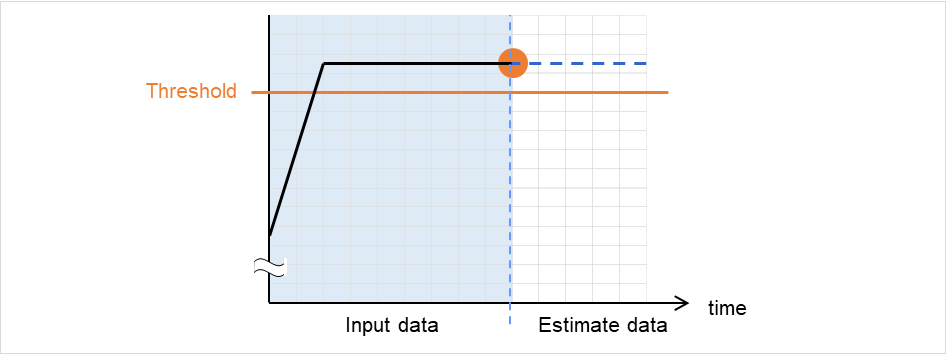
图 2.1 在输入数据中检测出异常
在预测数据中检测出异常
预测数据大于阈值的情况下,判定为异常并返回值3。输入数据数少于推荐值(=120)的情况下,返回值6。
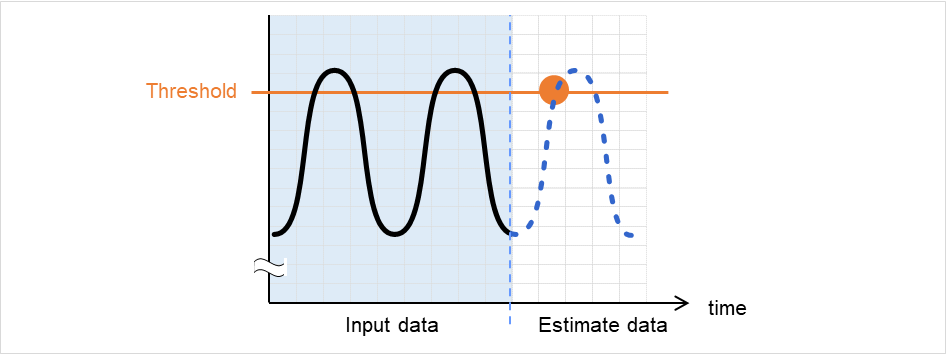
图 2.2 在预测数据中检测出异常
没有检测出阈值异常。
输入数据,预测数据均小于阈值的情况下,返回值4。输入数据数少于推荐值(=120)的情况下,返回值7。
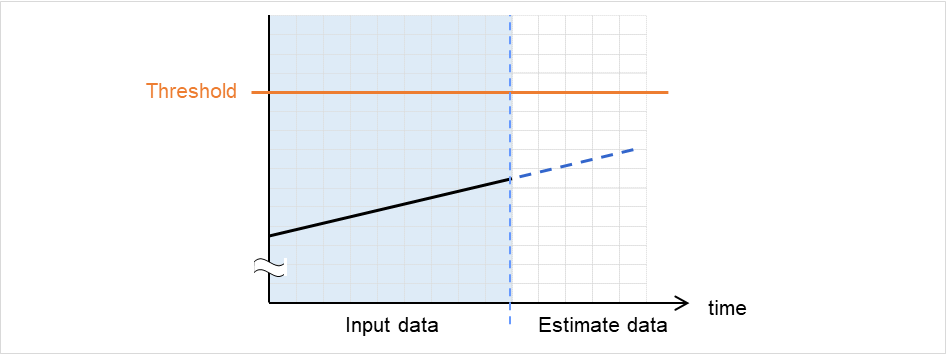
图 2.3 没有检测出阈值异常
使用-l选项的情况下
使用-l选项的情况下,低于阈值时,判定为异常。
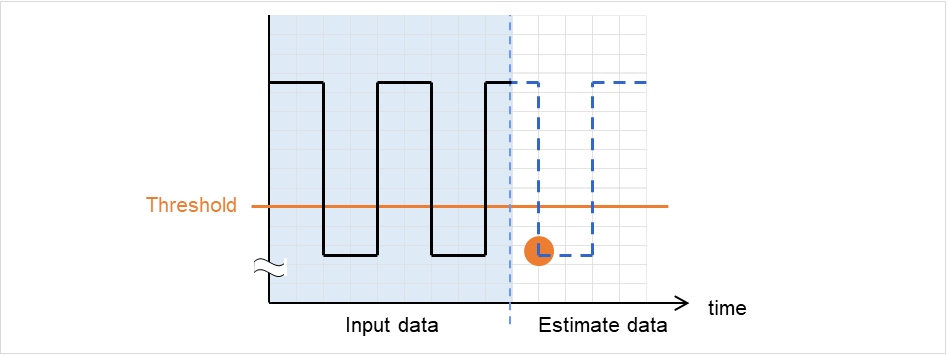
图 2.4 使用 -l 选项
-
执行例 按照模板中所指定的形式准备所记载文件,通过执行clpprer指令,将预测结果作为输出文件进行确认。
输入文件test.csv
2012/06/14 10:00:00,10.0
2012/06/14 10:01:00,10.5
2012/06/14 10:02:00,11.0
# clpprer -i test.csv -o result.csv
输出结果 result.csv
2012/06/14 10:03:00,11.5
2012/06/14 10:04:00,12.0
2012/06/14 10:05:00,12.5
2012/06/14 10:06:00,13.0
2012/06/14 10:07:00,13.5
    :
另外,通过在选项中设定阈值,可在指令提示符上确认预测值的阈值判定结果。
# clpprer -i test.csv -o result.csv -t 12.5
执行结果
Detect over threshold. datetime = 2012/06/14 10:06:00, data = 13.00, threshold = 12.5
-
错误消息 消息
原因/处理方法
Normal state.
经过阈值判定的结果,没有大于阈值的数据。
Detect over threshold. datetime = %s, data = %s, threshold = %s
经过阈值判定的结果,检测出大于阈值的数据。
Detect under threshold. datetime = %s, data = %s, threshold = %s
通过-l选项的阈值判定结果,检测出小于阈值的数据。
License is nothing.
没有登录有效的System Resrouce Agent权限。请确认权限。
Inputfile is none.
指定的输入数据文件不存在。
Inputfile length error.
指定的输入数据文件路径过长。请指定在1023字节以下。
Output directory does not exist.
在输出文件指定的目录不存在。请确认指定的目录是否存在。
Outputfile length error.
指定的输出文件路径过长。请指定在1023字节以下。
Invalid number of -p
指定-p选项的值不正确。
Invalid number of -t
指定-t选项的值不正确。
Not analyze under threshold(not set -t)
没有指定-t选项。使用-l选项时,请指定-t选项。
File open error [%s]. errno = %s
打开文件失败。认为内存不足或OS资源不足。请确认。
Inputfile is invalid. cols = %s
输入数据不正确。请将输入数据设定在2条以上。
Inputfile is invalid. rows = %s
输入数据的格式不正确。每行必须为2列。
Invalid date format. [expected YYYY/MM/DD HH:MM:SS]
输入数据的日期格式不正确。请确认数据。
Invalid date format. Not sorted in ascending order.
输入数据没有按升序排列。请确认数据。
File read error.
输入数据设定错误值。请确认数据。
Too large number of data [%s]. Max number of data is %s.
输入数据数大于最大值 (500)。请减少数据数。
Input number of data is smaller than recommendable number
输入数据数少于分析推荐数据数(120)。※即使分析推荐数据很少的情况下,也进行分析。Internal error
发生内部错误。
2.20. 确认进程的健全性 (clphealthchk 命令)
确认进程的健全性。
-
命令行 clphealthchk [ -t pm | -t rc | -t rm | -t nm | -h]
注解
本命令在单一服务器上确认进程的健全性。请在要确认健全性的服务器上执行。
-
说明 确认单一服务器上的进程健全性。
-
选项 -
无¶ 确认pm/rc/rm/nm的健全性。
-
-t<param>¶ - pm确认pm的健全性。
- rc确认rc的健全性。
- rm确认rm的健全性。
- nm确认nm的健全性。
-
-h¶ 显示Usage。
-
-
返回值 0
正常结束
1
执行权限非法
2
二重启动
3
初始化错误
4
选项无效
10
进程失控监视功能未设置
11
集群未启动状态(包含集群启动处理中,集群停止处理中)
12
集群挂起状态
100
存在一定时间内没有更新健全性信息的进程
-t选项指定时,指定进程的健全性信息一定时间内未更新
255
其他内部错误
-
执行示例 例1:健全时
# clphealthchk
pm OK
rc OK
rm OK
nm OK
例2:clprc失控时
# clphealthchk
pm OK
rc NG
rm OK
nm OK
# clphealthchk -t rc
rc NG
例3:集群停止时
# clphealthchk
The cluster has been stopped
-
备注 集群停止或挂起时进程是停止的。
-
注意事项 请以拥有Administrator权限的用户身份执行该命令。
-
错误消息 消息
原因/处理方法
Log in as Administrator.
无执行命令的权限。请用有Administrator权限的用户执行。
Initialization error. Check if memory or OS resources are sufficient.
可执行是内存不足或OS资源不足。请确认。
Invalid option.
请指定正确的选项。
The function of process stall monitor is disabled.
进程失控监视功能无效。
The cluster has been stopped.
集群处于停止状态。
The cluster has been suspended.
集群处于挂起状态。
This command is already run.
本命令已被执行。
Internal error. Check if memory or OS resources are sufficient.
可执行是内存不足或OS资源不足。请确认。
2.21. 设定从集群外实行关闭操作系统时的动作(clpstdncnf 命令)
设定从集群外执行关闭操作系统时的动作。
-
命令行 - clpstdncnf -e [time]clpstdncnf -dclpstdncnf -v
-
说明 设定从集群外执行关机时的动作。
-
选项 -
-e[time]¶ - 实行关闭操作系统时,time指定集群服务停止的等待时间。Time以分钟单位,可指定为1-1440的值。第2次以后可以不指定time。不指定时使用当前的设定值。
-
-d¶ 实行关闭操作系统时,不等待集群服务停止。
-
-v¶ 确认设定内容。
-
-
返回值 0
正常结束
0以外
异常结束
-
注意事项 - 请以拥有Administrator权限的用户身份执行该命令。云等虚拟环境下,由虚拟化基础架构侧实行关闭客户机操作系统时,如果关闭客户机操作系统需要时间,则虚拟化基础架构侧可以强制停止虚拟机电源。
-
执行示例 例1:集群服务停止的等待时间为最长30分钟时
# clpstdncnf -e 30
Command succeeded.
# clpstdncnf -v
Mode : wait
Timeout : 30 min
例2: 不等待集群服务停止时
# clpstdncnf -d
Command succeeded.
# clpstdncnf -v
Mode : no wait
Timeout : 30 min
2.22. 显示集群统计信息(clpperfc 命令)
显示集群统计信息。
-
命令行 - clpperfc --starttime -g group_nameclpperfc --stoptime -g group_nameclpperfc -g [group_name]clpperfc -m monitor_name
-
说明 显示组的启动,停止时间的中位数(毫秒)。
显示监视资源的监视处理时间(毫秒)。
-
选项 -
--starttime-g group_name¶ 显示组的启动时间的中位数。
-
--stoptime-g group_name¶ 显示组的停止时间的中位数。
-
-g[group_name]¶ 显示组的启动,停止时间的中位数。
省略groupname时,显示所有组的启动,停止时间的中位数。
-
-mmonitor_name¶ 显示最近的监视资源的监视处理时间。
-
-
返回值 0
正常结束
1
命令选项不正确
2
用户认证错误
3
配置信息加载错误
4
配置信息加载错误
5
初始化错误
6
内部错误
7
内部通信初始化错误
8
内部通信连接错误
9
内部通信处理错误
10
对象组检查错误
12
超时错误
-
执行示例 (显示组的启动时间的中位数时) # clpperfc --starttime -g failover1 200
-
执行示例 (显示特定组的启动,停止时间的中位数时) # clpperfc -g failover1 start time stop time failover1 200 150
-
执行示例 (显示监视资源的监视处理时间时) # clpperfc -m monitor1 100
-
备注 本命令输出的时间单位为毫秒。
无法取得有效的组的启动时间,停止时间时,显示 - 。
无法取得有效的监视资源的监视时间时,显示0。
-
注意事项 请有root权限的用户执行本命令。
-
错误消息 消息
原因/处理方法
Log in as Administrator.
请有Administrator权限的用户执行。
Invalid option.
命令选项不正确。请确认命令选项。
Command timeout.
执行命令超时。
Internal error.
内存不足或者OS资源不足。请确认。
2.23. 检查集群配置信息(clpcfchk 命令)
检查集群配置信息。
-
命令行 - clpcfchk -o path [-i conf_path]
-
说明 根据集群配置信息确认设定值的妥当性。
-
返回值 0
正常结束
0以外
异常结束
-
执行示例 (检查已反映的配置信息时) # clpcfchk -o /tmp server1 : PASS
-
执行示例 (检查已保存的配置信息时) # clpcfchk -o /tmp -i /tmp/config server1 : PASS
-
执行结果 在本命令结果中显示的检查结果(综合结果)如下所示。
检查结果(综合结果)
说明
PASS
没有问题。
FAIL
有问题。请确认检查结果。
-
备注 只显示各个服务器的综合结果。
-
注意事项 请有root权限的用户执行本命令。
要使用Cluster WebUI 检查导出的配置信息时,请事先对其进行解压缩。
-
错误消息 消息
原因/处理方法
Log in as Administrator.
请有Administrator 权限的用户执行。
Invalid option.
请指定正确的选项。
Could not opened the configuration file. Check if the configuration file exists on the specified path.
指定的路径不存在。请指定正确的路径。
Server is busy. Check if this command is already run.
本命令已启动。
Failed to obtain properties.
获取属性失败。
Failed to check validation.
检查集群配置失败。
Internal error. Check if memory or OS resources are sufficient.
内存不足或者OS资源不足。请确认。
3. 注意限制事项
本章将说明注意事项,现有问题及其避免方法。
本章中介绍的内容如下。
3.1. 操作 EXPRESSCLUSTER X SingleServerSafe后
请注意操作开始后的现象。
3.1.1. 恢复运行中的操作限制
使用查出监视资源异常时的设置,为恢复对象指定组资源(应用程序资源,服务资源......),请不要在查出监视资源异常时的恢复运行迁移中 (重新启动 -> 最终运行),请根据Cluster WebUI和命令不要执行以下的操作。
服务器的停止/挂起
组的启动 / 停止
3.1.2. 关于命令参考里没有记载的可执行文件和脚本文件
3.1.3. 关于Cluster WebUI
如果在与连接目标无法通信的状态下进行操作,则等待控制返回可执行会花费些许时间。
经由Proxy服务器时请对Proxy服务器进行设置,以便可以中转Cluster WebUI的端口号。
经由Reverse Proxy服务器时,Cluster WebUI不能正常运行。
对EXPRESSCLUSTER X SingleServerSafe进行升级后,请关闭所有运行中的Web浏览器。
清空浏览器的缓存后再重启浏览器。
使用比本产品更新的版本创建的集群配置信息,不能在本产品中使用。
- 结束Web浏览器后(窗口边框中的[X]等),可执行会弹出确认对话框。
 若要保存当前配置,请选择[留在此页]。
 - 刷新Web浏览器(菜单中的[刷新]及工具条上的[刷新]等)后,可执行会弹出确认对话框。
 若要保存当前配置,请选择[留在此页]。
 有关上述以外的 Cluster WebUI 注意事项和限制请参考在线版手册。
3.1.4. 关于EXPRESSCLUSTER X SingleServerSafe Disk Agent服务
EXPRESSCLUSTER X SingleServerSafe Disk Agent服务在EXPRESSCLUSTER X SingleServerSafe 中不使用。请别启动EXPRESSCLUSTER X SingleServerSafe Disk Agent服务。
3.1.5. 关于Windows Server 2012以后环境中的用户帐户控制的影响
Windows Server 2012以后中默认值的用户帐户控制 (UAC 是User Account Control的略称) 设置为有效。如果UAC有效时,对下述的功能产生影响。
监视资源
对下面所述的监视资源产生影响。
Oracle 监视资源
Oracle 监视资源中的认证方式为[OS认证],且设置了Built-in Administrator以外的用户时,监视处理会失败。
3.1.6. 关于应用程序资源/脚本资源的画面显示
从EXPRESSCLUSTER X SingleServerSafe的应用程序资源及脚本资源启动的进程由会话0执行,因此,启动有GUI的进程时,将显示「检测对话型服务对话框」的弹出窗口,如不在该弹出窗口中选择「显示提示信息」,GUI将不会显示。
3.1.7. 关于网卡(NIC)二重化的环境
- 网络初始化等待时间即便没有到达设置的时间,如果网络的初始化已经结束,集群就会开始启动。
- [ARMDELAY]命令即便没有到达设置的时间,如果网络的初始化已经结束,集群也不会开始启动。
关于网络初始化结束等待时间,[ARMDELAY]命令的详细信息,请参照《EXPRESSCLUSTER X SingleServerSafe 兼容功能指南》。
3.1.8. 关于EXPRESSCLUSTER X SingleServerSafe服务的登录账户
EXPRESSCLUSTER X SingleServerSafe服务的登录账户是设定为[本地系统账户]的。如果改变登录账户的设置可执行会导致集群无法正常运行。
3.1.9. EXPRESSCLUSTER X SingleServerSafe的常驻进程的监视
通过其他可以监视进程的软件来对EXPRESSCLUSTER X SingleServerSafe的常驻进程进行监视本身是没有问题的。但是,在进程异常结束时等情况下请不要对该进程进行再启动等的复归动作。
3.1.10. 关于JVM监视资源
重启监视对象的Java VM时,请将JVM监视资源挂起,或者停止集群后再进行。
变更设计内容时,需要进行集群的挂起和集群的复原。
不支持监视资源的延迟警报。
3.1.11. 关于系统监视资源,进程资源监视资源
变更设置内容时,需要进行集群的挂起。
不支持监视资源的延迟警报。
集群正在运行时更改了OS的日期或时间的情况,由于每隔10分钟进行一次解析处理,所以在最初的1回可执行会出现延迟。从而会导致以下的情况的发生,请根据需求对集群进行挂起集群和恢复集群操作。
已经过了异常检出所要时间而无法检测出异常。
在异常检出所要时间之前就已经检测出异常。
系统监视资源的磁盘资源监视功能可以同时监视的最大磁盘数为26台。
4. 错误消息一览表
本章介绍EXPRESSCLUSTER X SingleServerSafe运行中显示的错误消息一览表。
本章包含以下内容。
4.1. 安装时的错误消息
模块类型 |
错误消息 |
对策 |
|---|---|---|
setup |
Previous version of EXPRESSCLUSTER is installed. Upgrading from this version is not supported. Install after uninstalling the previous version of EXPRESSCLUSTER. |
请卸载旧版本EXPRESSCLUSTER后重新安装。 |
setup |
The SNMP service is running. You need to stop the SNMP service before you perform uninstallation. Do you want to stop the SNMP service now? |
选择[Yes],EXPRESSCLUSTER Setup将自动停止SNMP服务,继续安装。选择[No]则中断安装,手动停止SNMP服务后重新进行安装。 |
setup |
Setup has failed.
Error code : xxx
|
- 确认手册上记载的运行环境,安装步骤,注意事项,确认操作是否符合要求。
- 如果有其他启动的应用程序,请退出。
- 重启OS后,重新安装。
|
setup |
Setup has failed(xxx).
Error code : xxx
Please reboot the system and try again.
|
- 确认手册上记载的运行环境,安装步骤,注意事项,确认操作是否符合要求。
- 如果有其他启动的应用程序,请退出。
- 重启OS后,重新安装。
|
setup |
Unsupported environment. |
请在符合要求的运行环境中安装。 |
setup |
Cannot perform uninstallation because there is one or more EXPRESSCLUSTER services still running. Stop all EXPRESSCLUSTER services before you restart uninstallation. |
停止所有EXPRESSCLUSTER服务后再重新进行卸载。 |
setup |
Failed to start the installer. (errcode: xxx) |
- 确认手册上记载的运行环境,安装步骤,注意事项,确认操作是否符合要求。
- 如果有其他启动的应用程序,请退出。
- 请确认是否是安装程序文件损坏或不足。
|
setup |
Internal error.
(xxx)
|
- 确认手册上记载的运行环境,安装步骤,注意事项,确认操作是否符合要求。
- 如果有其他启动的应用程序,请退出。
|
4.2. 事件日志,警报消息
输出到应用程序事件日志,Cluster WebUI的警报日志等中的消息一览。Alert,Eventlog,Userlog的各列中带有●的消息分别记录到相应日志中。各日志的查看方法如下。
日志名 |
查看方法 |
文件名 |
|---|---|---|
Alert |
输出到Cluster WebUI的警报日志中。使用"日志收集工具"可以收集。 |
Alertlog.alt |
Eventlog |
输出到OS的事件查看器(application log)中。事件源是"EXPRESSCLUSTER X"。可以使用"日志采集工具"收集日志,但因为在右侧的文件名中按照二进制形式进行收集,所以要参考其内容,需要在安装EXPRESSCLUSTER的环境中使用事件查看器打开文件。 |
AppEvent.Evt
SysEvent.Evt
|
Userlog |
记录详细信息的文本格式日志。使用"日志收集工具" 收集日志。收集的日志输出到log文件夹下的"userlog.00.log"文件中。 |
userlog.00.log |
Mail Report的列中带有●的消息在设置了警报服务的邮件通报功能时将被通报。
SNMP Trap的列中带有●的消息在设置了警报服务的SNMP Trap发送时将被通报。
通告设置是结合使用ESMPRO/AlertManager时的通告设置。Alive是ESMPRO/AlertManager输出Alive通告的设置。Manager向ESMPRO/AlertManager输出警报。具体内容请参考ESMPRO/AlertManager的手册。
关于邮件通报,SNMP Trap发送请参考《EXPRESSCLUSTER X SingleServerSafe 设置指南》的"其他设置的详细信息" 的 "集群属性" 的 "Alert服务标签页"。
带有×的消息根据《EXPRESSCLUSTER X SingleServerSafe 设置指南》的"其他设置的详细信息"的"集群属性"的"Alert服务标签页"无法进行通报设置。
关于Message Topic 列中标有●标记的消息在设置了Amazon SNS联动功能时会被通报。
关于Amazon SNS联动功能,请参考《EXPRESSCLUSTER X SingleServerSafe 设置指南》的"其他设置的详细信息"的"集群属性"的"云标签页"。
下表中使用的记号如下所示。
[1]Alert, [2]Eventlog, [3]Userlog, [4]Mail Report, [5]SNMP Trap, [6]Alive, [7]Manager, [8]Message Topic
模块类型 |
事件分类 |
事件ID |
消息 |
描述 |
对策 |
1 |
2 |
3 |
4 |
5 |
6 |
7 |
8 |
|---|---|---|---|---|---|---|---|---|---|---|---|---|---|
nm |
信息 |
1 |
The server %1 has been started. |
服务器已启动。 |
- |
● |
● |
||||||
nm |
信息 |
2 |
The server %1 has been stopped. |
服务器已停止。 |
检测出服务器宕机。请排除服务器故障后,将服务器恢复到集群中。 |
● |
● |
● |
● |
● |
● |
● |
|
nm |
信息 |
3 |
The resource %2 of the server %1 has been started. |
资源已启动。 |
- |
● |
|||||||
nm |
错误 |
4 |
The resource %2 of the server %1 has an error. |
资源异常。 |
请排除资源异常的原因。 |
● |
|||||||
nm |
信息 |
5 |
The resource %2 of the server %1 has been recovered to the normal status. |
资源复归。 |
- |
● |
|||||||
nm |
错误 |
6 |
The resource %2 of the server %1 is unknown. |
资源状态不明。 |
请确认集群配置信息。 |
● |
● |
● |
|||||
nm |
错误 |
7 |
Network partition was detected. Shut down the server %1 to protect data. |
网络分区检测。 |
所有心跳资源将无法使用。请确认网络适配器中是否有错误,网络连接是否正确。 |
● |
● |
● |
● |
● |
|||
nm |
错误 |
8 |
An error occurred while confirming the network partition. Shut down the server %1. |
不能确认网络分区 |
请参考事件日志确认资源中是否发生错误。 |
● |
● |
● |
● |
● |
|||
nm |
错误 |
9 |
An error occurred in confirming the network partition. To avoid failover on multiple servers, the server %1 suspended failover. |
保留了失效切换。 |
请参考事件日志,确认资源中是否发生错误。 |
● |
● |
● |
● |
● |
|||
nm |
信息 |
10 |
The server %1 canceled the pending failover. |
取消了保留的失效切换。 |
- |
● |
● |
● |
|||||
nm |
错误 |
11 |
Shut down the server %1. (reason:%2) |
关闭服务器 |
所有心跳资源将无法使用。请确认网络适配器中是否有错误,网络连接是否正确。 |
● |
● |
● |
● |
||||
nm |
错误 |
12 |
Cluster service will be stopped. (reason:%1) |
停止集群服务 |
请排除原因所示的故障。 |
● |
● |
● |
|||||
nm |
警告 |
13 |
The combination of the network partition resources is invalid. (server name:%1) |
NP资源的组合不正确 |
请确认集群配置信息。 |
● |
● |
● |
|||||
nm |
错误 |
14 |
The status of heartbeat %1 is abnormal. |
心跳异常。 |
请确认网络适配器是否发生了错误,网络连接是否正确。 |
● |
● |
● |
● |
||||
nm |
信息 |
15 |
The heartbeat %1 has been recovered to the normal status. |
心跳复归。 |
- |
● |
● |
||||||
nm |
错误 |
16 |
The network partition %2 of the server %1 has an error. |
网络分区异常。 |
请参考事件日志确认资源中是否发生错误。 |
● |
● |
● |
● |
||||
nm |
信息 |
17 |
The network partition %2 of the server %1 has been recovered to the normal status. |
网络分区复归。 |
- |
● |
● |
||||||
nm |
错误 |
18 |
Failed to start the resource %1. Server name:%2 |
资源启动失败 |
请参考事件日志确认资源中是否发生错误。 |
● |
● |
● |
● |
||||
nm |
信息 |
19 |
Waiting for startup of all servers has been canceled. |
取消服务器启动等待 |
- |
● |
● |
||||||
nm |
错误 |
20 |
Network partition was detected. Stop the cluster service on the server %1 to protect data. |
网络分区检测 |
不能使用所有心跳的状态。请检查网络连接器是否未发生错误或网络是否正确连接。 |
● |
● |
● |
|||||
nm |
错误 |
21 |
An error occurred while confirming the network partition. Stop the cluster service on the server %1. |
不能确认网络分区 |
请参考事件日志确认资源是否未发生错误。 |
● |
● |
● |
|||||
nm |
错误 |
22 |
Network partition was detected. Execute action(%1) on the server %2 for the cluster service to protect data. |
查出网络分区 |
不能使用所有心跳的状态。请确认网络适配器中是否有错误,网络连接是否正确。 |
● |
● |
● |
|||||
nm |
错误 |
23 |
An error occurred when checking for a network partition. Execute action(%1) on the server %2 for the cluster service to protect data. |
不能确认网络分区 |
参照事件日志确认是否有资源错误发生 |
● |
● |
● |
|||||
nm |
错误 |
24 |
Refer to the event logs to check whether an error has occurred in a resource. |
不能解决网络分区 |
不能使用所有心跳的状态。请确认网络适配器中是否有错误,网络连接是否正确。 |
● |
● |
● |
|||||
nm |
警告 |
25 |
NP resolution process at the cluster startup is disabled. |
禁用网络分区解决 |
禁用集群启动时的网络分区解决处理。 |
● |
● |
● |
|||||
pm |
信息 |
501 |
Cluster service has been started properly. |
集群服务已启动。 |
- |
● |
● |
● |
|||||
pm |
信息 |
502 |
Cluster service is shutting down. |
集群服务已停止。 |
- |
● |
● |
● |
|||||
pm |
错误 |
510 |
Cluster service has already been started. |
集群服务已双重启动。 |
请确认集群服务的状态。 |
● |
● |
● |
● |
||||
pm |
错误 |
511 |
Fatal error has occurred in the cluster service. |
集群服务中发生了致命错误。 |
可执行是没有使用拥有要求权限的帐号启动服务,或者系统无法正常运行。 |
● |
● |
● |
● |
● |
● |
● |
|
pm |
错误 |
512 |
An error is detected in xml library. |
检测出xml库异常。 |
系统可执行无法正常运行。 |
● |
● |
● |
● |
||||
pm |
错误 |
513 |
An error is detected in configuration file. |
集群配置信息文件中检测出问题。 |
请确认集群配置信息。 |
● |
● |
● |
● |
● |
● |
● |
|
pm |
错误 |
514 |
Configuration file does not exist. |
集群配置信息文件不存在。 |
请上载集群配置信息。 |
● |
● |
● |
● |
||||
pm |
错误 |
515 |
My host name is not found in configuration file. |
集群配置信息文件中不存在自身服务器名。 |
请确认集群配置信息。 |
● |
● |
● |
● |
||||
pm |
错误 |
520 |
%1 process terminated abnormally. |
进程异常退出。 |
系统可执行无法正常运行。 即使nm进程异常结束,也不会影响业务,但是无法执行集群停止操作。 要复原,请使用Cluster WebUI或clpdown命令重新启动OS。 |
● |
● |
● |
● |
● |
● |
● |
|
pm |
错误 |
521 |
The cluster service process returned an error. (halting system) |
进程异常退出。(系统停止) |
原因可执行是组资源停止失败。请按照组资源的消息进行处理。 |
● |
● |
● |
● |
||||
pm |
错误 |
522 |
An error has occurred while initializing %1 process. (return code:%2) |
初始化发生错误。 |
请排除初始化错误的原因。 |
● |
● |
● |
● |
● |
● |
● |
|
pm |
信息 |
523 |
The system will be shut down. |
系统关机。 |
- |
● |
● |
● |
|||||
pm |
信息 |
524 |
Cluster service will be stopped. |
将停止集群服务。 |
- |
● |
● |
● |
|||||
pm |
信息 |
525 |
System will be rebooted. |
将重启系统。 |
- |
● |
● |
● |
|||||
pm |
信息 |
526 |
%1 process will be restarted. |
将重启进程。 |
- |
● |
● |
● |
|||||
pm |
信息 |
527 |
Emergency shutdown is in progress. |
将紧急关机。 |
- |
● |
● |
● |
|||||
pm |
信息 |
528 |
Generating STOP error. |
发生STOP错误。 |
- |
● |
● |
● |
|||||
pm |
信息 |
529 |
Generating hardware reset. |
将发生硬件复位。 |
- |
● |
● |
● |
|||||
pm |
信息 |
530 |
There was a request to shut down the system from the %1. |
请求集群关机。 |
- |
● |
● |
● |
|||||
pm |
信息 |
531 |
There was a request to stop cluster service from the %1. |
请求停止集群服务。 |
- |
● |
● |
● |
|||||
pm |
信息 |
532 |
There was a request to reboot system from the %1. |
请求重启系统。 |
- |
● |
● |
● |
|||||
pm |
信息 |
533 |
There was a request to restart cluster service from the %1. |
请求重启集群服务。 |
- |
● |
● |
● |
|||||
pm |
信息 |
534 |
There was a request to resume cluster service from the %1. |
请求恢复集群服务。 |
- |
● |
● |
● |
|||||
pm |
信息 |
535 |
There was a request to suspend cluster service from the %1. |
请求挂起集群服务。 |
- |
● |
● |
● |
|||||
pm |
信息 |
536 |
There was a request of emergency shutdown from the %1. |
请求紧急关机。 |
- |
● |
● |
● |
|||||
pm |
信息 |
537 |
There was a request to generate STOP error from the %1. |
请求STOP错误。 |
- |
● |
● |
● |
|||||
pm |
信息 |
538 |
There was a request to generate hardware reset from the %1. |
请求硬件复位。 |
- |
● |
● |
● |
|||||
pm |
信息 |
540 |
Requesting shutdown to the automatic running control software. |
向自动运行软件提出系统关机的请求。 |
- |
● |
● |
● |
|||||
pm |
信息 |
541 |
Requesting shutdown (reboot) to the automatic running control software. |
向自动运行软件提出系统关机(重启)的请求。 |
- |
● |
● |
● |
|||||
pm |
信息 |
542 |
Shutdown request to the automatic running control software is completed. |
向自动运行软件提出系统关机的请求。 |
- |
● |
● |
● |
|||||
pm |
错误 |
543 |
The automatic running control software returned an error to the shutdown request. |
通过自动运行软件进行系统关机处理失败。 |
可执行自动运行软件设置不正确。请确认。 |
● |
● |
● |
● |
||||
pm |
错误 |
544 |
Communications with the automatic running control software failed. |
与自动软件的通信失败。 |
系统可执行无法正常操作。 |
● |
● |
● |
● |
||||
pmsvc |
错误 |
801 |
The system will be shutdown because cluster resume was failed. |
恢复失败导致关机 |
- |
● |
● |
● |
|||||
pmsvc |
错误 |
802 |
An attempt to shutdown the system failed. |
关机失败 |
系统可执行无法正常运行。 |
● |
● |
● |
|||||
pmsvc |
信息 |
810 |
The system shutdown was initiated by other than cluster service. Stopping cluster service. (timeout=%1 min). |
开始集群服务停止等待处理 |
- |
● |
● |
● |
|||||
pmsvc |
信息 |
811 |
Stopping cluster service has been completed. |
结束集群服务停止等待处理 |
- |
● |
● |
● |
|||||
pmsvc |
错误 |
812 |
Stopping cluster service has timed out. |
等待集群服务超时 |
- |
● |
● |
● |
|||||
pmsvc |
警告 |
813 |
Stopping cluster service has been canceled. |
取消集群服务停止等待处理 |
- |
● |
● |
● |
|||||
rc |
信息 |
1010 |
The group %1 is starting. |
开始启动组。 |
- |
● |
● |
● |
|||||
rc |
信息 |
1011 |
The group %1 has been started. |
组启动完毕。 |
- |
● |
● |
● |
|||||
rc |
错误 |
1012 |
Failed to start the group %1. |
组启动失败。 |
请按照组资源的消息进行处理。 |
● |
● |
● |
● |
||||
rc |
信息 |
1015 |
Waiting for group %1 to start has started. |
开始组启动等待处理 |
- |
● |
● |
● |
|||||
rc |
信息 |
1016 |
Waiting for group %1 to start has been completed. |
结束组启动等待处理 |
- |
● |
● |
● |
|||||
rc |
错误 |
1017 |
Group start was canceled because waiting for group %1 to start was timed out. (%2) |
终止组启动等待处理 |
请确认启动等待目标组的状态。
如果组未启动,请启动该组后,重新执行组的操作。
|
● |
● |
● |
|||||
rc |
警告 |
1018 |
Waiting for group %1 to start has timed out. However, group start continues. (%2) |
继续组启动处理 |
- |
● |
● |
● |
|||||
rc |
错误 |
1019 |
Server %1 is not in a condition to start group %2. |
组不能启动。 |
如果目标服务器为保留(宕机后重启),请执行服务器恢复操作。如果是保留(NP未解决),则请将NP资源恢复为正常状态。 |
● |
|||||||
rc |
信息 |
1020 |
The group %1 is stopping. |
开始停止组。 |
- |
● |
● |
● |
|||||
rc |
信息 |
1021 |
The group %1 has been stopped. |
组停止完毕。 |
- |
● |
● |
● |
|||||
rc |
错误 |
1022 |
Failed to stop the group %1. |
组停止失败。 |
请按照组资源的消息进行处理。 |
● |
● |
● |
● |
||||
rc |
信息 |
1025 |
Waiting for group %1 to stop has started. |
开始组启动等待处理 |
- |
● |
● |
● |
|||||
rc |
信息 |
1026 |
Waiting for group %1 to stop has started. |
结束组启动等待处理 |
- |
● |
● |
● |
|||||
rc |
错误 |
1027 |
Group stop has been canceled because waiting for group %1 to stop has timed out. (%2) |
终止组启动等待处理 |
请确认启动等待目标组的状态。
如果组未启动,请启动该组后,重新执行组的操作。
|
● |
● |
● |
|||||
rc |
警告 |
1028 |
Waiting for group %1 to stop has timed out. However, group stop continues. (%2) |
继续组启动处理 |
- |
● |
● |
● |
|||||
rc |
信息 |
1030 |
The resource %1 is starting. |
开始启动资源。 |
- |
● |
● |
||||||
rc |
信息 |
1031 |
The resource %1 has been started. |
资源启动完毕。 |
- |
● |
● |
||||||
rc |
错误 |
1032 |
Failed to start the resource %1. (%2 : %3) |
资源启动失败。 |
请排除资源启动失败的原因。
启动处理发生失速时,输出"资源 %1 启动失败。(99 : command is timeout)"。
|
● |
● |
● |
● |
● |
● |
● |
|
rc |
错误 |
1033 |
Failed to start the recovery script of resource %1. (%2 : %3) |
启动脚本资源失败。 |
请排除恢复脚本启动失败的原因。 |
● |
● |
● |
● |
||||
rc |
信息 |
1034 |
A request to activate %1 resource on server %2 has been started. |
对待机服务器请求资源启动 |
- |
● |
● |
● |
|||||
rc |
信息 |
1035 |
A request to activate %1 resource on server %2 has been completed. |
对待机服务器请求资源启动完成 |
- |
● |
● |
● |
|||||
rc |
错误 |
1036 |
A request to activate %1 resource on server %2 has been failed. |
对待机服务器请求资源启动失败 |
请确认网络是否发生异常,或者对方服务器是否发生异常。 |
● |
● |
● |
|||||
rc |
信息 |
1040 |
The resource %1 is stopping. |
开始停止资源。 |
- |
● |
● |
||||||
rc |
信息 |
1041 |
The resource %1 has been stopped. |
资源停止完毕。 |
- |
● |
● |
||||||
rc |
错误 |
1042 |
Failed to stop the resource %1. (%2 : %3) |
资源停止失败。 |
请排除资源停止失败的原因。
停止处理发生失速时,输出"资源 %1 停止失败。(99 : command is timeout)"。
|
● |
● |
● |
● |
● |
● |
● |
|
rc |
信息 |
1044 |
A request to stop %1 resource on server %2 has been started. |
对待机服务器请求资源停止 |
- |
● |
● |
● |
|||||
rc |
信息 |
1045 |
A request to stop %1 resource on server %2 has been completed. |
对待机服务器请求资源停止完成 |
- |
● |
● |
● |
|||||
rc |
错误 |
1046 |
A request to stop %1 resource on server %2 has been failed. |
对待机服务器请求资源停止失败 |
请确认网络是否发生异常,或者对方服务器是否发生异常。 |
● |
● |
● |
|||||
rc |
信息 |
1050 |
Moving the group %1. |
开始移动组。 |
- |
● |
● |
● |
|||||
rc |
信息 |
1051 |
The group %1 has been moved. |
组移动完毕。 |
- |
● |
● |
● |
|||||
rc |
错误 |
1052 |
Failed to move the group %1. |
组移动失败。 |
请按照组资源的消息进行处理。 |
● |
● |
● |
● |
||||
rc |
错误 |
1059 |
Server %1 is not in a condition to move group %2. |
组不能移动。 |
如果目标服务器为保留(宕机后重启),请执行服务器恢复操作。如果是保留(NP未解决),则请将NP资源恢复为正常状态。 |
● |
|||||||
rc |
信息 |
1060 |
Failing over the group %1. |
开始组失效切换。 |
- |
● |
● |
● |
|||||
rc |
信息 |
1061 |
The group %1 has been failed over. |
组失效切换完毕。 |
- |
● |
● |
● |
|||||
rc |
错误 |
1062 |
Failed to fail over the group %1. |
组失效切换失败。 |
请按照组资源的消息进行处理。 |
● |
● |
● |
● |
||||
rc |
信息 |
1070 |
Restarting the group %1. |
开始重启组。 |
- |
● |
● |
● |
|||||
rc |
信息 |
1071 |
The group %1 has been restarted. |
组重启完毕。 |
- |
● |
● |
● |
|||||
rc |
错误 |
1072 |
Failed to restart the group %1. |
组重启失败。 |
请按照组资源的消息进行处理。 |
● |
● |
● |
● |
||||
rc |
错误 |
1077 |
Group failover has failed because there is a server incapable of internal communication. |
组失效切换失败(不可以进行内部通信) |
请确认内核模式LAN心跳的状态。恢复内部通信后,请重启组。 |
● |
● |
● |
|||||
rc |
信息 |
1080 |
Restarting the resource %1. |
开始重启资源。 |
- |
● |
● |
● |
|||||
rc |
信息 |
1081 |
The resource %1 has been restarted. |
资源重启完毕。 |
- |
● |
● |
● |
|||||
rc |
错误 |
1082 |
Failed to restart the resource %1. |
资源重启失败。 |
请按照组资源的消息进行处理。 |
● |
● |
● |
● |
||||
rc |
信息 |
1090 |
Shutting down the cluster. |
集群关机。 |
- |
● |
● |
● |
|||||
rc |
信息 |
1091 |
Shutting down the server. |
服务器关机。 |
- |
● |
● |
● |
|||||
rc |
错误 |
1092 |
Group %1 is started on more than one server. |
组双重启动。 |
服务器将自动关机。请排除组在多个服务器上启动的原因。 |
● |
● |
● |
● |
● |
● |
● |
|
rc |
错误 |
1093 |
The system shutdown was performed by other than the cluster service. |
从集群之外发生关机。 |
从集群服务之外执行关闭系统操作时,视为异常。请在集群环境中按指定步骤执行关机操作。 |
● |
● |
● |
● |
||||
rc |
警告 |
1100 |
Shutdown count is reached the maximum number (%1). Final action of resource %2 was ignored. |
关机次数达到最大值。 |
- |
● |
● |
● |
● |
● |
● |
● |
|
rc |
警告 |
1101 |
Since there is no other normally running server, the final action for an activation error of group resource %1 was suppressed. |
控制启动异常的最终动作 |
- |
● |
● |
● |
|||||
rc |
警告 |
1102 |
Since there is no other normally running server, the final action for a deactivation error of group resource %1 was suppressed. |
控制停止异常的最终动作 |
- |
● |
● |
● |
|||||
rc |
警告 |
1103 |
Since server %1 is specified as that which suppresses shutdown at both-system activation detection, it ignored the shutdown request. |
通过双启动控制关机 |
- |
● |
● |
● |
|||||
rc |
警告 |
1104 |
A mismatch in the group %1 status occurs between the servers. |
产生组状态不匹配 |
执行组重启或集群重启。 |
● |
● |
● |
|||||
rc |
信息 |
1105 |
Since server %1 is not specified as that which suppresses shutdown at both-system activation detection, it executed the shutdown request. |
通过双启动关机 |
- |
● |
● |
● |
|||||
rc |
信息 |
1110 |
Server %1 is returned to the cluster. |
服务器已复归。 |
- |
● |
● |
● |
|||||
rc |
信息 |
1111 |
Server %1 is isolated from the cluster. |
服务器已分离。 |
- |
● |
● |
● |
|||||
rc |
信息 |
1112 |
Server %1 started to return to the cluster. |
服务器已开始复归。 |
- |
● |
● |
● |
|||||
rc |
错误 |
1113 |
Server %1 failed to return to the cluster. |
服务器复归失败。 |
系统可执行无法正常运行。 |
● |
● |
● |
● |
||||
rc |
信息 |
1120 |
Server %1 will notify the automatic running control software of shutdown start. |
开始关机的通知。 |
- |
● |
● |
● |
|||||
rc |
错误 |
1121 |
The automatic running control software returned an error to the shutdown start notification in server %1. |
对开始关机的通知返回错误。 |
可执行自动运行软件设置不正确。请确认自动运行软件的设置。 |
● |
● |
● |
● |
||||
rc |
信息 |
1122 |
Server %1 notified the automatic running control software of shutdown start. |
已通知自动运行软件开始关机。 |
- |
● |
● |
● |
|||||
rc |
信息 |
1123 |
The automatic running control software is checking the power status of shared disks. A server will be restarted after the power status is checked. |
等待确认电源接通。 |
- |
● |
● |
● |
|||||
rc |
错误 |
1124 |
An error was returned from the automatic running control software. Failed to check the power status of shared disks. |
确认电源接通失败。 |
可执行自动运行软件的设置不正确。请确认自动运行软件的设置。或者可执行自动电源控制设备发生了异常。请确认自动电源控制设备。 |
● |
● |
● |
● |
||||
rc |
错误 |
1125 |
Server %1 failed to communicate with the automatic running control software. |
与自动运行控制软件的通信失败。 |
系统可执行无法正常运行。 |
● |
● |
● |
● |
||||
rc |
信息 |
1130 |
Starting a single resource %1. |
开始启动单一资源。 |
- |
● |
● |
● |
|||||
rc |
信息 |
1131 |
A single resource %1 has been started. |
单一资源启动完毕。 |
- |
● |
● |
● |
|||||
rc |
错误 |
1132 |
Failed to start a single resource %1. |
单一资源启动失败。 |
请按照组资源的消息进行处理。 |
● |
● |
● |
● |
||||
rc |
错误 |
1139 |
Server %1 is not in a condition to start a single resource %2. |
不能启动单一资源。 |
如果目标服务器为保留(宕机后重启),请执行服务器恢复操作。如果是保留(NP未解决),则请将NP资源恢复为正常状态。 |
● |
|||||||
rc |
信息 |
1140 |
Stopping a single resource %1. |
开始停止单一资源。 |
- |
● |
● |
● |
|||||
rc |
信息 |
1141 |
A single resource %1 has been stopped. |
单一资源停止完毕。 |
- |
● |
● |
● |
|||||
rc |
错误 |
1142 |
Failed to stop a single resource %1. |
单一资源停止失败。 |
请按照组资源的消息进行处理。 |
● |
● |
● |
● |
||||
rc |
信息 |
1150 |
Migrating the group %1. |
开始组迁移 |
- |
● |
● |
● |
|||||
rc |
信息 |
1151 |
The group %1 has been migrated. |
组迁移完成 |
- |
● |
● |
● |
|||||
rc |
错误 |
1152 |
Failed to migrate the group %1. |
组迁移失败 |
请按组资源的提示进行处理。 |
● |
● |
● |
● |
||||
rc |
错误 |
1159 |
Server %1 is not in a condition to migrate group %2. |
不能迁移组 |
对象服务器保留(宕机后重启)时,请执行服务器恢复操作。保留(NP未解决)时,请将NP资源设成正常状态。 |
● |
● |
● |
|||||
rc |
信息 |
1170 |
Server %1 in the same server group (%2) has been set as the destination for the group %3. |
服务器组内失效切换 |
- |
● |
● |
● |
|||||
rc |
信息 |
1171 |
Server %1 not in the same server group (%2) has been set as the destination for the group %3. |
服务器组外失效切换 |
- |
● |
● |
● |
|||||
rc |
错误 |
1179 |
Can not fail over the group %1 because there is no appropriate destination in the same server group %2. |
不能进行服务器组内失效切换 |
服务器组内的其他服务器已经停止或关闭后再启动的状态。请重启相应的服务器或复归集群。 |
● |
● |
● |
|||||
rc |
信息 |
1200 |
The resource %1 will be restarted since starting the resource %2 failed. |
因为资源启动失败,重启资源。 |
- |
● |
● |
● |
|||||
rc |
信息 |
1201 |
The group %1 will be failed over to server %2 since starting the resource %3 failed. |
因为资源启动失败,执行组的失效切换。 |
- |
● |
● |
● |
|||||
rc |
信息 |
1202 |
The group %1 will be stopped since starting the resource %2 failed. |
因为资源启动失败,停止组。 |
- |
● |
● |
● |
|||||
rc |
信息 |
1203 |
The cluster service will be stopped since starting the resource %1 failed. |
因为资源启动失败,停止服务。 |
- |
● |
● |
● |
|||||
rc |
信息 |
1204 |
The system will be shut down since starting the resource %1 failed. |
因为资源启动失败,关闭系统。 |
- |
● |
● |
● |
|||||
rc |
信息 |
1205 |
The system will be rebooted since starting the resource %1 failed. |
因为资源启动失败,重启系统。 |
- |
● |
● |
● |
|||||
rc |
信息 |
1220 |
The resource %1 will be stopped again since stopping the resource %2 failed. |
因为资源停止失败,重新停止资源。 |
- |
● |
● |
● |
|||||
rc |
信息 |
1223 |
The cluster service will be stopped since stopping the resource %1 failed. |
因为资源停止失败,停止集群服务。 |
- |
● |
● |
● |
|||||
rc |
信息 |
1224 |
The system will be shut down since stopping the resource %1 failed. |
因为资源停止失败,关闭系统。 |
- |
● |
● |
● |
|||||
rc |
信息 |
1225 |
The system will be rebooted since stopping the resource %1 failed. |
因为资源停止失败,重启系统。 |
- |
● |
● |
● |
|||||
rc |
信息 |
1241 |
Hardware reset will be generated since starting the resource %1 failed. |
因为资源启动失败,重置硬件。 |
- |
● |
● |
● |
|||||
rc |
信息 |
1242 |
STOP error will be generated since starting the resource %1 failed. |
因为资源启动失败,发生停止错误。 |
- |
● |
● |
● |
|||||
rc |
信息 |
1281 |
Hardware reset will be generated since stopping the resource %1 failed. |
因为资源停止失败,产生重置。 |
- |
● |
● |
● |
|||||
rc |
信息 |
1282 |
STOP error will be generated since stopping the resource %1 failed. |
因为资源停止失败,产生停止错误。 |
- |
● |
● |
● |
|||||
rc |
信息 |
1300 |
Script before final action upon activation failure in resource %1 started. |
资源启动异常时最终动作前脚本开始 |
- |
● |
● |
● |
|||||
rc |
信息 |
1301 |
Script before final action upon activation failure in resource %1 completed. |
资源启动异常时最终动作前脚本结束 |
- |
● |
● |
● |
|||||
rc |
信息 |
1302 |
Script before final action upon deactivation failure in resource %1 started. |
资源停止异常时最终动作前脚本开始 |
- |
● |
● |
● |
|||||
rc |
信息 |
1303 |
Script before final action upon deactivation failure in resource %1 completed. |
资源停止异常时最终动作前脚本结束 |
- |
● |
● |
● |
|||||
rc |
信息 |
1304 |
Script before activation in resource %1 started. |
资源启动前脚本开始 |
- |
● |
● |
● |
|||||
rc |
信息 |
1305 |
Script before activation in resource %1 completed. |
资源启动前脚本结束 |
- |
● |
● |
● |
|||||
rc |
信息 |
1306 |
Script after activation in resource %1 started. |
资源启动后脚本开始 |
- |
● |
● |
● |
|||||
rc |
信息 |
1307 |
Script after activation in resource %1 completed. |
资源启动后脚本结束 |
- |
● |
● |
● |
|||||
rc |
信息 |
1308 |
Script before deactivation in resource %1 started. |
资源停止前脚本开始 |
- |
● |
● |
● |
|||||
rc |
信息 |
1309 |
Script before deactivation in resource %1 completed. |
资源停止前脚本结束 |
- |
● |
● |
● |
|||||
rc |
信息 |
1310 |
Script after deactivation in resource %1 started. |
资源停止后脚本开始 |
- |
● |
● |
● |
|||||
rc |
信息 |
1311 |
Script after deactivation in resource %1 completed. |
资源停止后脚本结束 |
- |
● |
● |
● |
|||||
rc |
错误 |
1340 |
Script before final action upon activation failure in resource %1 failed. |
资源启动异常时最终动作前脚本失败 |
请确认脚本失败的原因,进行相应的处理。 |
● |
● |
● |
● |
||||
rc |
错误 |
1341 |
Script before final action upon deactivation failure in resource %1 failed. |
资源停止异常时最终动作前脚本失败 |
请确认脚本失败的原因,进行相应的处理。 |
● |
● |
● |
● |
||||
rc |
错误 |
1342 |
Failed to execute script before activation in resource %1. |
资源启动前脚本失败 |
请确认脚本失败的原因,进行相应的处理。 |
● |
● |
● |
● |
||||
rc |
错误 |
1343 |
Failed to execute script after activation in resource %1. |
资源启动后脚本失败 |
请确认脚本失败的原因,进行相应的处理。 |
● |
● |
● |
● |
||||
rc |
错误 |
1344 |
Failed to execute script before deactivation in resource %1. |
资源停止前脚本失败 |
请确认脚本失败的原因,进行相应的处理。 |
● |
● |
● |
● |
||||
rc |
错误 |
1345 |
Failed to execute script after deactivation in resource %1. |
资源停止后脚本失败 |
请确认脚本失败的原因,进行相应的处理。 |
● |
● |
● |
● |
||||
rc |
错误 |
1346 |
Failed to log on as a user. |
用户登录失败 |
请确认执行用户的域,账号,密码是否设置正确。 |
● |
● |
● |
|||||
rc |
信息 |
1400 |
Forced stop (BMC Power Off) of server %1 has been requested. |
请求强制停止(bmc-poweroff) |
- |
● |
|||||||
rc |
信息 |
1401 |
Forced stop (BMC Power Cycle) of server %1 has been requested. |
请求强制停止(bmc-powercycle) |
- |
● |
|||||||
rc |
信息 |
1402 |
Forced stop (BMC Reset) of server %1 has been requested. |
请求强制停止(bmc-reset) |
- |
● |
|||||||
rc |
信息 |
1403 |
Forced stop (BMC NMI) of server %1 has been requested. |
请求强制停止(bmc-nmi) |
- |
● |
|||||||
rc |
信息 |
1404 |
Forced stop has been requested. |
请求强制停止(VMware vSphere CLI) |
- |
● |
|||||||
rc |
信息 |
1405 |
Script for forced stop has started. |
强制停止脚本已经开始。 |
- |
● |
|||||||
rc |
信息 |
1406 |
Script for forced stop has completed. |
强制停止脚本已经结束。 |
- |
● |
|||||||
rc |
错误 |
1420 |
Forced stop (BMC Power Off) of server %1 failed. |
强制停止失败(bmc-poweroff) |
系统可执行无法正常运行。 |
● |
● |
● |
● |
||||
rc |
错误 |
1421 |
Forced stop (BMC Power Cycle) of server %1 failed. |
强制停止失败(bmc-powercycle) |
系统可执行无法正常运行。 |
● |
● |
● |
● |
||||
rc |
错误 |
1422 |
Forced stop (BMC Reset) of server %1 failed. |
强制停止失败(bmc-reset) |
系统可执行无法正常运行。 |
● |
● |
● |
● |
||||
rc |
错误 |
1423 |
Forced stop (BMC NMI) of server %1 failed. |
强制停止失败(bmc-nmi) |
系统可执行无法正常运行。 |
● |
● |
● |
● |
||||
rc |
错误 |
1424 |
Forced stop failed. |
强制停止失败(VMware vSphere CLI) |
系统可执行无法正常运行。 |
● |
● |
● |
● |
||||
rc |
错误 |
1425 |
Script for forced stop has failed. (%1) |
强制停止脚本停止 |
请确认脚本失败的原因,进行相应的处理。 |
● |
● |
● |
● |
||||
rc |
错误 |
1426 |
Script for forced stop has timed out. |
强制停止脚本发生超时。 |
请确认脚本超时的原因,进行相应的处理。 |
● |
● |
● |
● |
||||
rc |
警告 |
1427 |
Group failover has been canceled because forced stop of server %1 failed |
因强制停止失败失效切换控制。 |
请确认强制停止失败的原因,进行相应的处理。 |
● |
● |
● |
|||||
rc |
信息 |
1440 |
The CPU frequency has been set to high. |
设置CPU频率级别为最高 |
- |
● |
● |
● |
|||||
rc |
信息 |
1441 |
The CPU frequency has been set to low. |
设置CPU频率级别为最低 |
- |
● |
● |
● |
|||||
rc |
信息 |
1442 |
The CPU frequency has been set to %1. |
设置CPU频率级别 |
- |
● |
● |
● |
|||||
rc |
信息 |
1443 |
CPU frequency setting has been switched to automatic control by clouster. |
通过集群把CPU频率设置切换为自动控制 |
- |
● |
● |
● |
|||||
rc |
警告 |
1450 |
Cluster action is disabled. |
集群运行禁用中 |
- |
● |
● |
● |
|||||
rc |
警告 |
1451 |
Ignored the automatic start of groups because automatic group startup is disabled. |
自动启动未执行 |
- |
● |
● |
● |
|||||
rc |
警告 |
1452 |
Ignored the recovery action in resource activation because recovery action caused by group resource activation error is disabled. |
复归操作未执行 |
- |
● |
● |
● |
|||||
rc |
警告 |
1453 |
Ignored the recovery action in resource deactivation because recovery action caused by group resource deactivation error is disabled. |
复归操作未执行 |
- |
● |
● |
● |
|||||
rc |
信息 |
1454 |
Cluster action is set disabled. |
禁用集群运行 |
- |
● |
● |
● |
|||||
rc |
信息 |
1455 |
Cluster action is set enabled. |
启用集群运行 |
- |
● |
● |
● |
|||||
rc |
错误 |
1460 |
CPU frequency control cannot be used. |
CPU频率控制功能不可以使用 |
请确认BIOS,内核的设置。 |
● |
● |
● |
● |
||||
rc |
错误 |
1461 |
Failed to set the CPU frequency to high. |
设置CPU频率级别(最高)失败 |
请确认BIOS,内核的设置。请确认集群服务是否启动。请确认是否设置为使用CPU频率控制功能。 |
● |
● |
● |
● |
||||
rc |
错误 |
1462 |
Failed to set the CPU frequency to low. |
设置CPU频率级别(最低)失败 |
请确认BIOS,内核的设置。请确认集群服务是否启动。请确认是否设置为使用CPU频率控制功能。 |
● |
● |
● |
● |
||||
rc |
错误 |
1463 |
Failed to set the CPU frequency to %1. |
设置CPU频率级别失败 |
请确认BIOS,内核的设置。请确认集群服务是否启动。请确认是否设置为使用CPU频率控制功能。 |
● |
● |
● |
● |
||||
rc |
错误 |
1464 |
Failed to switch the CPU frequency setting to automatic control by cluster. |
通过集群切换CPU频率设置为自动控制失败 |
请确认集群服务是否启动。请确认是否设置为使用CPU频率控制功能。 |
● |
● |
● |
● |
||||
rc |
信息 |
1470 |
Server %1 has been set as the destination for the group %2 (reason: %3).) |
确定启动服务器。 |
- |
● |
● |
● |
|||||
rc |
警告 |
1471 |
There is no appropriate destination for the group %1 (reason: %2). |
没有合适的启动服务器。(启动集群,失效切换) |
在其他服务器上查出监视资源异常。请排除异常的原因并暂停监视。 |
● |
● |
● |
|||||
rc |
警告 |
1472 |
Server %1 is not in a condition to start group %2 (reason: %3). |
没有合适的启动服务器。(启动组) |
在相应的服务器上查出监视资源异常。请排除异常的原因并暂停监视。 |
● |
● |
● |
|||||
rc |
错误 |
1480 |
Group start has been canceled because waiting for group %1 to start has failed. (%2) |
启动等待失败(终止组启动) |
- |
● |
● |
● |
|||||
rc |
警告 |
1481 |
Waiting for group %1 to start has failed. However, group start continues. (%2) |
启动等待失败(继续组启动) |
- |
● |
● |
● |
|||||
rc |
错误 |
1482 |
Group start has been canceled because waiting for group %1 to start has canceled. |
启动等待终止(终止组启动) |
- |
● |
● |
● |
|||||
rc |
警告 |
1483 |
Waiting for group %1 to start has canceled. However, group start continues. |
启动等待终止(继续组启动) |
- |
● |
● |
● |
|||||
rc |
错误 |
1484 |
Group stop has been canceled because waiting for group %1 to stop has failed. (%2) |
停止等待失败(终止组停止) |
- |
● |
● |
● |
|||||
rc |
警告 |
1485 |
Waiting for group %1 to stop has failed. However, group stop continues. (%2) |
停止等待失败(继续组停止) |
- |
● |
● |
● |
|||||
rc |
错误 |
1486 |
Group stop has been canceled because waiting for group %1 to stop has canceled. |
停止等待终止(终止组停止) |
- |
● |
● |
● |
|||||
rc |
警告 |
1487 |
Waiting for group %1 to stop has canceled. However, group stop continues. |
停止等待终止(继续组停止) |
- |
● |
● |
● |
|||||
rc |
信息 |
1490 |
Group %1 started to check the double activation. |
双重启动检查开始 |
- |
● |
|||||||
rc |
信息 |
1491 |
Group %1 completed to check the double activation. |
双重启动检查结束 |
- |
● |
|||||||
rc |
错误 |
1492 |
Group %1 failed to check the double activation. |
双重启动检查失败 |
请确认组的状态。 |
● |
● |
● |
● |
||||
rc |
信息 |
1493 |
Waiting for group %1 to start for check the double activation. |
为了双重启动检查等待组启动 |
请确认组的状态。 |
● |
● |
● |
|||||
rm |
信息 |
1501 |
Monitor %1 has been started. |
监视已启动。 |
- |
● |
● |
● |
|||||
rm |
信息 |
1502 |
Monitor %1 has been stopped. |
监视已停止。 |
- |
● |
● |
● |
|||||
rm |
信息 |
1503 |
Monitor %1 does not monitor in this server. |
非对象服务器。 |
- |
● |
● |
● |
|||||
rm |
警告 |
1504 |
Monitor %1 is in the warning status. (%2 : %3) |
监视警告。 |
请确认警告的原因。 |
● |
● |
● |
● |
||||
rm |
警告 |
1505 |
The number of monitor resources reached the maximum number. (registered resource: %1) |
监视资源数不正确。 |
请确认集群配置信息。 |
● |
● |
● |
● |
||||
rm |
警告 |
1506 |
Configuration of %1 is invalid. (%2 : %3) |
监视资源不正确 |
请确认集群配置信息。 |
● |
● |
● |
● |
||||
rm |
错误 |
1507 |
Failed to start monitor %1. |
监视启动失败。 |
系统可执行无法正常运行。 |
● |
● |
● |
● |
● |
● |
● |
|
rm |
错误 |
1508 |
Failed to stop monitor %1. |
监视停止失败。 |
系统可执行无法正常运行。 |
● |
● |
● |
● |
||||
rm |
错误 |
1509 |
Monitor %1 detected an error. (%2 : %3) |
监视失败 |
请确认监视异常的原因。 |
● |
● |
● |
● |
● |
● |
● |
|
rm |
信息 |
1510 |
Monitor %1 is not monitored. |
非监视。 |
- |
● |
● |
● |
|||||
rm |
信息 |
1511 |
Monitor resource has not been registered. |
未登录的监视资源。 |
- |
● |
● |
● |
|||||
rm |
信息 |
1512 |
%1 was stopped for failure in monitor %2. |
复归对象停止。 |
- |
● |
● |
● |
|||||
rm |
信息 |
1513 |
%1 was restarted for failure in monitor %2. |
复归对象重启。 |
- |
● |
● |
● |
|||||
rm |
信息 |
1514 |
%1 was failed over for failure in monitor %2. |
复归对象组失效切换。 |
- |
● |
● |
● |
|||||
rm |
信息 |
1515 |
There was a request to stop cluster for failure in monitor %1. |
集群停止。 |
- |
● |
● |
● |
|||||
rm |
信息 |
1516 |
There was a request to shut down the system for failure in monitor %1. |
系统关机。 |
- |
● |
● |
● |
|||||
rm |
信息 |
1517 |
There was a request to restart the system for failure in monitor %1. |
系统重启。 |
- |
● |
● |
● |
|||||
rm |
错误 |
1518 |
Failed to stop %1 due to error detection of %2. |
停止复归对象失败。 |
请确认资源的状态。 |
● |
● |
● |
● |
||||
rm |
错误 |
1519 |
Failed to restart %1 due to error detection of %2. |
重启复归对象失败。 |
请确认资源的状态。 |
● |
● |
● |
● |
||||
rm |
错误 |
1520 |
Failed to fail over %1 due to error detection of %2. |
复归对象组失效切换失败。 |
请确认资源的状态。 |
● |
● |
● |
● |
||||
rm |
错误 |
1521 |
Failed to stop the cluster due to error detection of %1. |
集群停止失败。 |
系统可执行无法正常运行。 |
● |
● |
● |
● |
||||
rm |
错误 |
1522 |
Failed to shut down the system due to error detection of %1. |
操作系统关机失败。 |
系统可执行无法正常运行。 |
● |
● |
● |
● |
||||
rm |
错误 |
1523 |
Failed to restart the system due to error detection of %1. |
操作系统重启失败。 |
系统可执行无法正常运行。 |
● |
● |
● |
● |
||||
rm |
错误 |
1524 |
The group of monitor %1 is unknown. |
所属组不明。 |
请确认集群配置信息。 |
● |
● |
● |
● |
||||
rm |
警告 |
1525 |
No action is taken because %1 is not online. |
无法执行复归运行。 |
- |
● |
● |
● |
● |
||||
rm |
信息 |
1526 |
Status of monitor %1 was returned to normal. |
状态已恢复正常。 |
- |
● |
● |
● |
|||||
rm |
信息 |
1527 |
Status of monitor %1 was changed into unknown. |
状态变为不明。 |
系统可执行无法正常运行。 |
● |
● |
● |
|||||
rm |
错误 |
1528 |
Initialization error has occurred (%1 : %2) |
监视初始化时发生异常。 |
系统可执行无法正常运行。 |
● |
● |
● |
● |
||||
rm |
信息 |
1529 |
Monitor %1 was suspended. |
暂停监视。 |
- |
● |
● |
● |
|||||
rm |
信息 |
1530 |
Monitor %1 was resumed. |
恢复监视。 |
- |
● |
● |
● |
|||||
rm |
信息 |
1531 |
All monitors were suspended. |
暂停所有监视。 |
- |
● |
● |
● |
|||||
rm |
信息 |
1532 |
All monitors were resumed. |
恢复所有监视。 |
- |
● |
● |
● |
|||||
rm |
信息 |
1533 |
The polling interval of monitor %1 was changed into %2*%3. |
更改轮询间隔。 |
- |
● |
● |
● |
|||||
rm |
信息 |
1534 |
The polling interval ratio of all monitors was changed into %1. |
更改所有监视的轮询间隔。 |
- |
● |
● |
● |
|||||
rm |
信息 |
1535 |
Causing intentional stop error was required because an error is detected by %1. |
发生停止错误。 |
- |
● |
● |
● |
|||||
rm |
错误 |
1536 |
Causing intentional stop error has failed because an error is detected by %1. |
发生停止错误失败。 |
系统可执行无法正常运行。 |
● |
● |
● |
● |
||||
rm |
警告 |
1537 |
Recovery will not be executed since server is suspending. |
不能执行复归运行(服务器状态为保留)。 |
如果目标服务器为保留(NP未解决),则不能执行监视资源恢复操作。请确认导致保留(NP未解决)的原因,将NP资源恢复为正常状态。 |
● |
● |
● |
● |
||||
rm |
警告 |
1538 |
Recovery will not be executed since none of the recovery targets is active. |
不能执行复归动作(不存在启动的复归目标) |
- |
● |
● |
● |
|||||
rm |
警告 |
1571 |
Monitor %1 was delayed. (timeout=%2, response time=%3, rate=%4) |
监视发生延迟。 |
确认检测出监视延迟的服务器的负载情况,减少负载。 |
● |
● |
● |
● |
||||
rm |
警告 |
1572 |
Monitor %1 could not perform monitoring. |
内部处理发生延迟 |
系统可执行无法正常运行。 |
● |
● |
● |
|||||
rm |
警告 |
1600 |
Shutdown count reached the maximum number (%1). Final action of monitor %2 was ignored. |
关机次数已达到上限。 |
- |
● |
● |
● |
● |
● |
● |
||
rm |
警告 |
1601 |
Since there is no other normally running server, the final action (%1) for the error detection of monitor resource %2 was suppressed. |
控制查出异常的最终动作 |
- |
● |
● |
● |
|||||
rm |
信息 |
1700 |
Script before action(%1) upon failure in %2 monitor resource started. |
监视资源异常时最终动作前脚本开始 |
- |
● |
● |
● |
|||||
rm |
信息 |
1701 |
Script before action(%1) upon failure in %2 monitor resource completed. |
监视资源异常时最终动作前脚本结束 |
- |
● |
● |
● |
|||||
rm |
信息 |
1720 |
Script before action(%1) upon failure in %2 monitor resource failed. |
监视资源异常时最终动作前脚本失败 |
- |
● |
● |
● |
|||||
rm |
信息 |
1750 |
The collecting of detailed information triggered by monitoring %1 error has been started (timeout=%2). |
开始收集详细信息。 |
- |
● |
● |
● |
|||||
rm |
信息 |
1751 |
The collection of detailed information triggered by monitoring %1 error has been completed. |
结束收集详细信息。 |
- |
● |
● |
● |
|||||
rm |
警告 |
1752 |
The collection of detailed information triggered by monitoring %1 error has been failed (%2). |
收集详细信息失败。 |
- |
● |
● |
● |
|||||
rm |
信息 |
1800 |
The %1 service will be started by cluster system. |
启动服务 |
- |
● |
● |
● |
|||||
rm |
信息 |
1801 |
The %1 service will be started again because the service has been stopped by cluster system. (retry: %2/%3) |
尝试启动服务 |
- |
● |
● |
● |
|||||
rm |
信息 |
1802 |
The %1 service will be resumed by cluster system. |
再次展开服务 |
- |
● |
● |
● |
|||||
rm |
信息 |
1803 |
The %1 service will be resumed again because the service has been suspended by cluster system. (retry: %2/%3) |
尝试再次展开服务 |
- |
● |
● |
● |
|||||
rm |
信息 |
1804 |
The %1 service will be stopped by cluster system. |
停止服务 |
- |
● |
● |
● |
|||||
rm |
信息 |
1805 |
The %1 service entered the running state. |
服务执行中状态 |
- |
● |
● |
● |
|||||
rm |
信息 |
1806 |
The %1 service entered the stopped state. |
服务停止状态 (正常) |
- |
● |
● |
● |
|||||
rm |
警告 |
1811 |
Start request of the %1 service failed. Check the service status. |
服务开始请求失败 |
请确认服务的状态。 |
● |
● |
● |
|||||
rm |
警告 |
1812 |
Resume request of the %1 service failed. Check the service status. |
服务再次展开请求失败 |
请确认服务的状况。 |
● |
● |
● |
|||||
rm |
警告 |
1813 |
Stop request of the %1 service failed. Check the service status. |
服务停止请求失败 |
请确认服务的状况。 |
● |
● |
● |
|||||
rm |
警告 |
1816 |
The %1 service has been stopped by other than cluster system. |
服务停止状况 (异常) |
请确认服务停止的状况。 |
● |
● |
● |
|||||
rm |
警告 |
1817 |
The %1 service has been suspended by other than cluster system. |
服务暂时停止状况 (异常) |
请确认服务暂时停止的状况。 |
● |
● |
● |
|||||
rm |
警告 |
1819 |
Start or resume retry count for the %1 service exceeded the threshold (%2). |
服务再启动处理次数超时 |
服务重新启动处理次数超时 |
● |
● |
● |
|||||
rm |
信息 |
1820 |
The cluster will be stopped because there was a failure in %1 service monitoring. |
集群服务停止 (服务监视错误) |
- |
● |
● |
● |
|||||
rm |
信息 |
1821 |
The system will be shut down because there was a failure in %1 service monitoring. |
系统关机 (服务监视错误) |
- |
● |
● |
● |
|||||
rm |
信息 |
1822 |
The cluster will be rebooted because there was a failure in %1 service monitoring. |
系统再启动 (服务监视错误) |
- |
● |
● |
● |
|||||
rm |
错误 |
1870 |
Monitor resource %1 can not be controlled because the license is invalid. |
不可操作(License不正确) |
请确认License的登录状况。 |
● |
● |
● |
|||||
rm |
信息 |
1890 |
Recovery script has executed because an error was detected in monitoring %1. |
复归脚本结束 |
- |
● |
● |
● |
|||||
rm |
错误 |
1891 |
Attempted to execute recovery script due to the error detected in monitoring %1, but failed. |
复归脚本失败 |
请确认复归脚本失败的原因,进行处理。 |
● |
● |
● |
|||||
rm |
错误 |
1892 |
Failed to log on as a user. |
用户登录失败 |
请确认执行用户的域,账号,密码是否设置正确。 |
● |
● |
● |
|||||
rm |
信息 |
1910 |
Dummy Failure of monitor resource %1 is enabled. |
发生模拟故障 |
- |
● |
● |
● |
|||||
rm |
信息 |
1911 |
Dummy Failure of monitor resource %1 is disabled. |
解除模拟故障 |
- |
● |
● |
● |
|||||
rm |
信息 |
1912 |
Dummy Failure of all monitors will be enabled. |
发生所有监视资源的模拟故障 |
- |
● |
● |
● |
|||||
rm |
信息 |
1913 |
Dummy Failure of all monitors will be disabled. |
解除解除所有监视资源的模拟故障 |
- |
● |
● |
● |
|||||
rm |
警告 |
1914 |
An attempt was made to enable Dummy Failure of monitor resource %1, but failed. |
发生模拟故障 |
请确认监视资源%1是否有对应故障检测功能。 |
● |
● |
● |
|||||
rm |
警告 |
1915 |
An attempt was made to disable Dummy Failure of monitor resource %1, but failed. |
解除模拟故障 |
请确认监视资源%1是否有对应故障检测功能。 |
● |
● |
● |
|||||
rm |
信息 |
1930 |
Recovery action caused by monitor resource error is disabled. |
使监视资源异常时的复归运行的抑制功能有效 |
- |
● |
● |
● |
|||||
rm |
信息 |
1931 |
Recovery action caused by monitor resource error is enabled. |
使监视资源异常时的复归运行的抑制功能无效 |
- |
● |
● |
● |
|||||
rm |
警告 |
1932 |
Ignored the recovery action in monitoring %1 because recovery action caused by monitor resource error is disabled. |
为抑制监视资源异常时的运行,不要执行复归运行。 |
- |
● |
● |
● |
|||||
rm |
警告 |
1933 |
Recovery action at timeout occurrence was disabled, so the recovery action of monitor %1 was not executed. |
由于将监视资源超时时的复归运行设为无效,因此不能执行复归运行。 |
- |
● |
● |
● |
|||||
event |
信息 |
2101 |
%1 service has been started. |
服务启动。 |
- |
● |
|||||||
event |
信息 |
2102 |
%1 service has been stopped. |
服务停止。 |
- |
● |
|||||||
event |
警告 |
2130 |
Time-out or other error has occurred while waiting for internal threads to stop. Detected internal error %1. |
结束等待超时。 |
系统可执行无法正常运行。 |
● |
● |
● |
|||||
event |
错误 |
2150 |
The specified parameters are invalid. Check the cluster configuration data. |
配置信息异常。 |
请确认集群配置信息。 |
● |
● |
● |
|||||
event |
错误 |
2151 |
Failed to obtain the policy data. Check the data. |
配置信息异常。 |
请确认策略文件的存在或配置内容。 |
● |
● |
● |
|||||
event |
错误 |
2152 |
Failed to obtain the registry data. System may be unable to operate correctly. |
注册表异常。 |
系统可执行无法正常运行。 |
● |
● |
● |
|||||
event |
错误 |
2153 |
Failed to dispatch to the service manager. System may be unable to operate correctly. |
调度异常。 |
系统可执行无法正常运行。 |
● |
● |
● |
|||||
event |
错误 |
2154 |
Failed to create an internal resource. System may be unable to operate correctly. |
资源创建失败。 |
系统可执行无法正常运行。 |
● |
● |
● |
|||||
event |
错误 |
2155 |
Failed to create communication sockets. System may be unable to operate correctly. |
Socket创建失败。 |
系统可执行无法正常运行。 |
● |
● |
● |
|||||
event |
错误 |
2156 |
Failed to control the shared memory. System may be unable to operate correctly. |
共享内存的控制失败。 |
系统可执行无法正常运行。 |
● |
● |
● |
|||||
event |
错误 |
2157 |
Failed to generate internal threads. System may be unable to operate correctly. |
内部线程的生成失败。 |
系统可执行无法正常运行。 |
● |
● |
● |
|||||
event |
错误 |
2199 |
Other internal error has occurred. System may be unable to operate correctly. |
发生内部错误。 |
系统可执行无法正常运行。 |
● |
● |
● |
|||||
trnsv |
错误 |
2301 |
There was a notification from external (IP=%1), but it was denied. |
客户端IP地址连接限制 |
请确认客户端的IP地址的连接权限 |
● |
● |
● |
|||||
trnsv |
信息 |
2310 |
There was a notification (%1) from external (IP=%2). |
从外部接收异常发生通知 |
- |
● |
● |
● |
|||||
trnsv |
信息 |
2320 |
Recovery action (%1) of monitoring %2 has been executed because a notification arrived from external. |
执行异常发生时的恢复动作 |
- |
● |
● |
● |
|||||
trnsv |
信息 |
2321 |
Recovery action (%1) of monitoring %2 has been completed. |
异常发生时的恢复动作执行完毕 |
- |
● |
● |
● |
|||||
trnsv |
错误 |
2322 |
Attempted to recovery action (%1) of monitoring %2 due to the notification from external, but failed. |
异常发生时的恢复动作执行失败 |
请确认可以执行恢复动作的条件 |
● |
● |
● |
|||||
trnsv |
信息 |
2330 |
Action (%1) has been completed. |
要求的动作执行完毕 |
- |
● |
● |
● |
|||||
trnsv |
错误 |
2331 |
Attempted to execute action (%1), but it failed. |
要求的动作执行失败 |
请确认要求动作可以被执行的条件 |
● |
● |
● |
|||||
trnsv |
信息 |
2340 |
Script before action of monitoring %1 has been executed. |
开始执行脚本 |
- |
● |
● |
● |
|||||
trnsv |
信息 |
2341 |
Script before action of monitoring %1 has been completed. |
脚本执行完毕 |
- |
● |
● |
● |
|||||
trnsv |
错误 |
2342 |
Attempted to execute script before action of monitoring %1, but it failed. |
脚本执行失败 |
确认脚本失败的原因,执行相应处理。 |
● |
● |
● |
|||||
trnsv |
错误 |
2350 |
The system will be shutdown because cluster resume was failed. |
恢复失败导致关机 |
- |
● |
● |
● |
|||||
trnsv |
错误 |
2351 |
An attempt to shutdown the system failed. |
关机失败 |
系统可执行无法正常运行。 |
● |
● |
● |
|||||
lanknb |
错误 |
2851 |
Keep-alive timeout was detected on the server %1. |
检出Keep Alive超时。 |
存在检出Keep Alive超时的服务器。请清除服务器的故障。 |
● |
● |
● |
|||||
lankhb |
信息 |
2852 |
STOP error was detected on the server %1. (source:%2, exit code:%3) |
STOP错误 |
存在发生了STOP错误的服务器。请清除服务器的故障。 |
● |
● |
● |
● |
||||
lankhb |
信息 |
2853 |
Hardware reset was detected on the server %1. (source:%2, exit code:%3) |
STOP硬件复位 |
存在发生了硬件复位的服务器。请清除服务器的故障。 |
● |
● |
● |
● |
||||
ptun |
警告 |
3301 |
The parameter (%1) exceeded the threshold (%2 p.c.). Timeout value=%3(sec) Data=%4(sec) |
发生延迟警报 |
参数超出界限值。请将参数设置为适当的值。 |
● |
● |
● |
● |
||||
ptun |
警告 |
3302 |
The parameter (%1) exceeded the threshold (%2 p.c.). Timeout value=%3(sec) Data=%4(sec) Server=%5 Resource=%6 |
发生延迟警报 |
参数超出界限值。请将参数设置为适当的值。 |
● |
● |
● |
● |
||||
armcmd |
错误 |
3501 |
ARMLOAD detected that the application (watchID=%2) of the group %1 has stopped. The number of failovers has reached the maximum count. Check what has caused the application to stop. |
应用程序发生异常。 |
请调查并清除应用程序结束的原因。 |
● |
● |
● |
|||||
armcmd |
错误 |
3502 |
ARMLOAD detected that the application (watchID=%2) of the group %1 has stopped. Script will be restarted. Check what has caused the application to stop. |
应用程序发生异常。 |
请调查并清除应用程序结束的原因。 |
● |
● |
● |
|||||
armcmd |
错误 |
3503 |
ARMLOAD detected that the application (watchID=%2) of the group %1 has stopped. The application will be restarted. Check what has caused the application to stop. |
应用程序发生异常。 |
请调查并清除应用程序结束的原因。 |
● |
● |
● |
|||||
armcmd |
错误 |
3504 |
ARMLOAD detected that the application (watchID=%2) of the group %1 has stopped. Group will be failed over. Check what has caused the application to stop. |
应用程序发生异常。 |
请调查并清除应用程序结束的原因。 |
● |
● |
● |
|||||
armcmd |
错误 |
3505 |
ARMLOAD detected that the application (watchID=%2) of the group %1has stopped. The server will shut down. Check what has caused the application to stop. |
应用程序发生异常。 |
请调查并清除应用程序结束的原因。 |
● |
● |
● |
|||||
armcmd |
错误 |
3506 |
ARMLOAD detected that the service (watchID=%2) of the group %1 has stopped. The number of failovers has reached the maximum count. Check what has caused the application to stop. |
服务发生异常。 |
请调查并清除应用程序结束的原因。 |
● |
● |
● |
|||||
armcmd |
错误 |
3507 |
ARMLOAD detected that the service (watchID=%2) of the group %1 has stopped. Script will be restarted. Check what has caused the application to stop. |
服务发生异常。 |
请调查并清除应用程序结束的原因。 |
● |
● |
● |
|||||
armcmd |
错误 |
3508 |
ARMLOAD detected that the service (watchID=%2) of the group %1 has stopped. The service will be restarted. Check what has caused the application to stop. |
服务发生异常。 |
请调查并清除应用程序结束的原因。 |
● |
● |
● |
|||||
armcmd |
错误 |
3509 |
ARMLOAD detected that the service (watchID=%2) of the group %1 has stopped. The group will be failed over. Check what has caused the application to stop. |
服务发生异常。 |
请调查并清除应用程序结束的原因。 |
● |
● |
● |
|||||
armcmd |
错误 |
3510 |
ARMLOAD detected that the service (watchID=%2) of the group %1 has stopped. The server will shut down. Check what has caused the application to stop. |
服务发生异常。 |
请调查并清除应用程序结束的原因。 |
● |
● |
● |
|||||
armcmd |
错误 |
3513 |
An error occurred in command %1. Shut down the server. |
命令发生异常。 |
系统可执行无法正常运行。 |
● |
● |
● |
|||||
armcmd |
警告 |
3514 |
An abnormal connection to the shared name (%1) has been detected. |
共有名的连接异常。 |
共有名无法使用。恢复支持共有名的设备。(1)OS不稳定。请确认。(2)请确认该设备是否已经接通电源。(3)请确认该设备和服务器是否正确连接。 |
● |
● |
● |
|||||
armcmd |
信息 |
3515 |
Connection to the shared name (%1) has been recovered. |
恢复向共有名的连接。 |
- |
● |
● |
||||||
armcmd |
警告 |
3516 |
Failed to start the application (WID=%2) of the group %1. |
应用程序的启动失败。 |
请清除应用程序启动失败的原因。 |
● |
● |
● |
|||||
armcmd |
信息 |
3517 |
The application (WID=%2) of the group %1 has restarted. |
重新启动应用程序 |
- |
● |
● |
||||||
armcmd |
警告 |
3518 |
Failed to start the service (WID=%2) of the group %1. |
服务启动失败。 |
请清除服务启动失败的原因。 |
● |
● |
● |
|||||
armcmd |
信息 |
3519 |
The service (WID=%2) of the group %1 has restarted. |
重新启动服务。 |
- |
● |
● |
||||||
armcmd |
错误 |
3520 |
Failed to fail over the group %1. Check whether the server where the group can fail over exists. |
失效切换失败。 |
可执行不存在可以失效切换组的服务器。请确认。 |
● |
● |
● |
|||||
lcns |
信息 |
3551 |
The trial license is valid until %1. (Product name:%2) |
试用版License(在试用期间) |
- |
● |
● |
||||||
lcns |
错误 |
3552 |
The trial license has expired in %1. (Product name:%2) |
试用版License(超过试用期间) |
请注册License。 |
● |
● |
● |
● |
||||
lcns |
警告 |
3553 |
The number of licenses is insufficient. The number of insufficient licenses is %1. (Product name:%2) |
License不足。 |
请注册License。 |
● |
● |
● |
|||||
lcns |
错误 |
3554 |
The license is not registered. (Product name:%1) |
未注册License。 |
请注册License。 |
● |
● |
● |
● |
||||
lcns |
错误 |
3555 |
The same license is registered with other servers. (Product name:%1) |
相同License在其他服务器上已被登录。 |
请删除重复License。 |
● |
● |
● |
● |
||||
lcns |
错误 |
3556 |
Manufacturer or model of this server is invalid. |
厂商或者模式不正确。 |
请确认厂商或者模式。 |
● |
● |
● |
● |
||||
lcns |
错误 |
3558 |
The registered license is invalid. (Product name:%1, Serial No:%2) |
License无效 |
请注册有效License。 |
● |
● |
● |
● |
||||
lcns |
信息 |
3559 |
The fixed term license is effective until %1. (Product name:%2) |
期间定制版License(在使用期间) |
- |
● |
● |
● |
|||||
lcns |
错误 |
3560 |
The fixed term license has expired in %1. (Product name:%2) |
期间定制版License(超过使用期间) |
请注册License。 |
● |
● |
● |
● |
||||
logcmd |
信息 |
3601 |
日志命令。 |
- |
● |
× |
× |
× |
× |
× |
× |
× |
|
diskw |
警告 |
3701 |
Monitor %1 was delayed. (timeout=%2 response time=%3 rate=%4) |
监视延迟。 |
- |
● |
● |
● |
● |
||||
userw |
警告 |
3711 |
Monitor %1 was delayed. (timeout=%2 response time=%3 rate=%4) |
监视延迟。 |
- |
● |
● |
● |
● |
||||
错误 |
4101 |
mail failed(%1).(SMTP server: %2) |
邮件通知失败。 |
检查SMTP服务器是否发生错误,或者与其通信是否发生错误。 |
● |
● |
● |
● |
|||||
信息 |
4102 |
mail successed.(SMTP server: %1) |
邮件通知成功。 |
- |
● |
● |
|||||||
apisv |
信息 |
4301 |
There was a request to stop cluster from the %1(IP=%2). |
集群停止 |
- |
● |
● |
||||||
apisv |
信息 |
4302 |
There was a request to shutdown cluster from the %1(IP=%2). |
集群关闭 |
- |
● |
● |
||||||
apisv |
信息 |
4303 |
There was a request to reboot cluster from the %1(IP=%2). |
集群重启 |
- |
● |
● |
||||||
apisv |
信息 |
4304 |
There was a request to suspend cluster from the %1(IP=%2). |
集群挂起 |
- |
● |
● |
||||||
apisv |
信息 |
4310 |
There was a request to stop server from the %1(IP=%2). |
集群服务停止 |
- |
● |
● |
||||||
apisv |
信息 |
4311 |
There was a request to shutdown server from the %1(IP=%2). |
关闭 |
- |
● |
● |
||||||
apisv |
信息 |
4312 |
There was a request to reboot server from the %1(IP=%2). |
重启 |
- |
● |
● |
||||||
apisv |
信息 |
4330 |
There was a request to start group(%1) from the %2(IP=%3). |
组启动 |
- |
● |
● |
||||||
apisv |
信息 |
4331 |
There was a request to start all groups from the %1(IP=%2). |
全部组启动 |
- |
● |
● |
||||||
apisv |
信息 |
4332 |
There was a request to stop group(%1) from the %2(IP=%3). |
组停止 |
- |
● |
● |
||||||
apisv |
信息 |
4333 |
There was a request to stop all groups from the %1(IP=%2). |
全部组停止 |
- |
● |
● |
||||||
apisv |
信息 |
4334 |
There was a request to restart group(%1) from the %2(IP=%3). |
组重启 |
- |
● |
● |
||||||
apisv |
信息 |
4335 |
There was a request to restart all groups from the %1(IP=%2). |
全部组重启 |
- |
● |
● |
||||||
apisv |
信息 |
4336 |
There was a request to move group(%1) from the %2(IP=%3). |
组移动 |
- |
● |
● |
||||||
apisv |
信息 |
4337 |
There was a request to move all groups from the %1(IP=%2). |
全部组移动 |
- |
● |
● |
||||||
apisv |
信息 |
4338 |
There was a request to failover group(%1) from the %2(IP=%3). |
组失效切换 |
- |
● |
● |
||||||
apisv |
信息 |
4339 |
There was a request to failover all groups from the %1(IP=%2). |
全部组失效切换 |
- |
● |
● |
||||||
apisv |
信息 |
4340 |
There was a request to migrate group(%1) from the %2(IP=%3). |
组迁移 |
- |
● |
● |
||||||
apisv |
信息 |
4341 |
There was a request to migrate all groups from the %1(IP=%2). |
全部组迁移 |
- |
● |
● |
||||||
apisv |
信息 |
4342 |
There was a request to failover all groups from the %1(IP=%2). |
全部组失效切换 |
- |
● |
● |
||||||
apisv |
信息 |
4343 |
There was a request to cancel waiting for the dependence destination group of group %1 was issued from the %2. |
等待取消 |
- |
● |
● |
||||||
apisv |
信息 |
4350 |
There was a request to start resource(%1) from the %2(IP=%3). |
资源启动 |
- |
● |
● |
||||||
apisv |
信息 |
4351 |
There was a request to start all resources from the %1(IP=%2). |
全部资源启动 |
- |
● |
● |
||||||
apisv |
信息 |
4352 |
There was a request to stop resource(%1) from the %2(IP=%3). |
资源停止 |
- |
● |
● |
||||||
apisv |
信息 |
4353 |
There was a request to stop all resources from the %1(IP=%2). |
全部资源停止 |
- |
● |
● |
||||||
apisv |
信息 |
4354 |
There was a request to restart resource(%1) from the %2(IP=%3). |
资源重启 |
- |
● |
● |
||||||
apisv |
信息 |
4355 |
There was a request to restart all resources from the %1(IP=%2). |
全部资源重启 |
- |
● |
● |
||||||
apisv |
信息 |
4360 |
There was a request to suspend monitor resources from the %1(IP=%2). |
监视暂停 |
- |
● |
● |
||||||
apisv |
信息 |
4361 |
There was a request to resume monitor resources from the %1(IP=%2). |
恢复监视 |
- |
● |
● |
||||||
apisv |
信息 |
4362 |
There was a request to enable Dummy Failure of monitor resource(%1) from the %2(IP=%3). |
开始模拟故障 |
- |
● |
● |
||||||
apisv |
信息 |
4363 |
There was a request to disable Dummy Failure of monitor resource(%1) from the %2(IP=%3). |
停止模拟故障 |
- |
● |
● |
||||||
apisv |
信息 |
4364 |
There was a request to disable Dummy Failure of all monitor resources from the %1(IP=%2). |
停止全部模拟故障 |
- |
● |
● |
||||||
apisv |
信息 |
4370 |
There was a request to set CPU frequency from the %1(IP=%2). |
CPU频率控制 |
- |
● |
● |
||||||
apisv |
错误 |
4401 |
A request to stop cluster was failed(%1). |
集群停止失败 |
请确认集群的状态 |
● |
● |
||||||
apisv |
错误 |
4402 |
A request to shutdown cluster was failed(%1). |
集群关闭失败 |
请确认集群的状态 |
● |
● |
||||||
apisv |
错误 |
4403 |
A request to reboot cluster was failed(%1). |
集群重启失败 |
请确认集群的状态 |
● |
● |
||||||
apisv |
错误 |
4404 |
A request to suspend cluster was failed(%1). |
集群挂起失败 |
请确认集群的状态 |
● |
● |
||||||
apisv |
错误 |
4410 |
A request to stop server was failed(%1). |
集群服务停止失败 |
请确认集群的状态 |
● |
● |
||||||
apisv |
错误 |
4411 |
A request to shutdown server was failed(%1). |
服务器关闭失败 |
请确认服务器的状态 |
● |
● |
||||||
apisv |
错误 |
4412 |
A request to reboot server was failed(%1). |
服务器重启失败 |
请确认服务器的状态 |
● |
● |
||||||
apisv |
错误 |
4430 |
A request to start group(%1) was failed(%2). |
组启动失败 |
请确认组的状态 |
● |
● |
||||||
apisv |
错误 |
4431 |
A request to start all groups was failed(%1). |
全部组启动失败 |
请确认组的状态 |
● |
● |
||||||
apisv |
错误 |
4432 |
A request to stop group(%1) was failed(%2). |
组停止失败 |
请确认组的状态 |
● |
● |
||||||
apisv |
错误 |
4433 |
A request to stop all groups was failed(%1). |
全部组停止失败 |
请确认组的状态 |
● |
● |
||||||
apisv |
错误 |
4434 |
A request to restart group(%1) was failed(%2). |
组重启失败 |
请确认组的状态 |
● |
● |
||||||
apisv |
错误 |
4435 |
A request to restart all groups was failed(%1). |
全部组重启失败 |
请确认组的状态 |
● |
● |
||||||
apisv |
错误 |
4436 |
A request to move group(%1) was failed(%2). |
组移动失败 |
请确认组的状态 |
● |
● |
||||||
apisv |
错误 |
4437 |
A request to move all groups was failed(%1). |
全部组移动失败 |
请确认组的状态 |
● |
● |
||||||
apisv |
错误 |
4438 |
A request to failover group(%1) was failed(%2). |
组失效切换失败 |
请确认组的状态 |
● |
● |
||||||
apisv |
错误 |
4439 |
A request to failover all groups was failed(%1). |
全部组失效切换失败 |
请确认组的状态 |
● |
● |
||||||
apisv |
错误 |
4440 |
A request to migrate group(%1) was failed(%2). |
组迁移失败 |
请确认组的状态 |
● |
● |
||||||
apisv |
错误 |
4441 |
A request to migrate all groups was failed(%1). |
全部组迁移失败 |
请确认组的状态 |
● |
● |
||||||
apisv |
错误 |
4442 |
A request to failover all groups was failed(%1). |
全部组失效切换失败 |
请确认组的状态 |
● |
● |
||||||
apisv |
错误 |
4443 |
A request to cancel waiting for the dependency destination group of group %s has failed(%1). |
等待取消失败 |
请确认组的状态 |
● |
● |
||||||
apisv |
错误 |
4450 |
A request to start resource(%1) was failed(%2). |
资源启动失败 |
请确认资源的状态 |
● |
● |
||||||
apisv |
错误 |
4451 |
A request to start all resources was failed(%1). |
全部资源启动失败 |
请确认资源的状态 |
● |
● |
||||||
apisv |
错误 |
4452 |
A request to stop resource(%1) was failed(%2). |
资源停止失败 |
请确认资源的状态 |
● |
● |
||||||
apisv |
错误 |
4453 |
A request to stop all resources was failed(%1). |
全部资源停止失败 |
请确认资源的状态 |
● |
● |
||||||
apisv |
错误 |
4454 |
A request to restart resource(%1) was failed(%2). |
资源重启失败 |
请确认资源的状态 |
● |
● |
||||||
apisv |
错误 |
4455 |
A request to restart all resources was failed(%1). |
全部资源重启失败 |
请确认资源的状态 |
● |
● |
||||||
apisv |
错误 |
4460 |
A request to suspend monitor resource was failed(%1). |
监视暂停失败 |
请确认监视资源的状态 |
● |
● |
||||||
apisv |
错误 |
4461 |
A request to resume monitor resource was failed(%1). |
资源恢复失败 |
请确认监视资源的状态 |
● |
● |
||||||
apisv |
错误 |
4462 |
A request to enable Dummy Failure of monitor resource(%1) was failed(%2). |
模拟故障开始失败 |
请确认监视资源的状态 |
● |
● |
||||||
apisv |
错误 |
4463 |
A request to disable Dummy Failure of monitor resource(%1) was failed(%2). |
模拟故障停止失败 |
请确认监视资源的状态 |
● |
● |
||||||
apisv |
错误 |
4464 |
A request to disable Dummy Failure of all monitor resource was failed(%1). |
全部模拟故障停止失败 |
请确认监视资源的状态 |
● |
● |
||||||
apisv |
错误 |
4470 |
A request to set CPU frequency was failed(%1). |
CPU频率控制失败 |
请确认服务器相应的CPU频率控制。 |
● |
● |
||||||
apisv |
错误 |
4480 |
Initializing internal communication (%1) failed (port=%2). |
内部通信初始化失败 |
内部通信初始化失败。
请确认Expre ssCluster以外的应用程序是否使用该端口。
|
● |
● |
||||||
userw |
警告 |
5001 |
Monitor %1 was delayed.(timeout=%2 response time=%3 rate=%4) |
监视延迟 |
- |
● |
● |
● |
● |
||||
genw |
警告 |
5151 |
Since loss of the target script (%1) has been detected, it was rebooted |
对象脚本重启
%1:脚本名
|
- |
● |
● |
||||||
db2
ftp
http
imap4
odbc
oracle
otx
pop3
psql
smtp
sqlserver
tux
was
wls
|
警告 |
10001 |
%1 |
各个被监视的应用程序的错误消息。 |
根据错误消息处理应用程序错误。 |
● |
× |
× |
× |
× |
× |
× |
× |
db2w
ftpw
httpw
imap4w
odbcw
oraclew
otxw
pop3w
psqlw
smtpw
sqlserverw
tuxw
wasw
wlsw
db2
ftp
http
imap4
odbc
oracle
otx
pop3
psql
smtp
sqlserver
tux
was
wls
|
警告 |
10002 |
The API Error of Windows occurred.%1 |
发生WindowsAPI 错误。%1是API错误代码。 |
根据错误代码处理OS错误。 |
● |
× |
× |
× |
× |
× |
× |
× |
mrw |
警告 |
4901 |
Monitor %1 is in the warning status. (%2 : %3) |
监视警告 |
请确认警告的原因。 |
● |
● |
● |
● |
||||
mrw |
警告 |
4902 |
Configuration of %1 is invalid. (%2 : %3) |
监视资源不正确 |
请确认集群配置信息。 |
● |
● |
● |
● |
||||
mrw |
错误 |
4903 |
Failed to start monitor %1. |
监视启动失败 |
系统可执行处于不能正常运行的状态。 |
● |
● |
● |
● |
● |
● |
● |
|
mrw |
错误 |
4904 |
Failed to stop monitor %1. |
监视停止失败 |
系统可执行处于不能正常运行的状态。 |
● |
● |
● |
● |
||||
mrw |
错误 |
4905 |
Monitor %1 detected an error. (%2 : %3) |
监视失败 |
请确认监视异常的原因。 |
● |
● |
● |
● |
● |
● |
● |
|
mrw |
信息 |
4906 |
Monitor resource has not been registered. |
未登录的监视资源 |
- |
● |
● |
● |
|||||
mrw |
信息 |
4907 |
%1 was stopped for failure in monitor %2. |
复归对象停止 |
- |
● |
● |
● |
|||||
mrw |
信息 |
4908 |
%1 was restarted for failure in monitor %2. |
重启复归对象 |
- |
● |
● |
● |
|||||
mrw |
情報 |
4909 |
%1 was failed over for failure in monitor %2. |
复归对象组 失效切换 |
- |
● |
● |
● |
|||||
mrw |
信息 |
4910 |
There was a request to stop cluster for failure in monitor %1. |
集群停止 |
- |
● |
● |
● |
|||||
mrw |
信息 |
4911 |
There was a request to shut down the system for failure in monitor %1. |
系统关闭 |
- |
● |
● |
● |
|||||
mrw |
信息 |
4912 |
There was a request to restart the system for failure in monitor %1. |
系统重启 |
- |
● |
● |
● |
|||||
mrw |
错误 |
4913 |
Failed to stop %1 due to error detection of %2. |
复归对象停止失败 |
请确认资源的状态。 |
● |
● |
● |
● |
||||
mrw |
错误 |
4914 |
Failed to restart %1 due to error detection of %2. |
复归对象重启失败 |
请确认资源的状态。 |
● |
● |
● |
● |
||||
mrw |
错误 |
4915 |
Failed to fail over %1 due to error detection of %2. |
复归对象组 失效切换失败 |
请确认资源的状态。 |
● |
● |
● |
● |
||||
mrw |
错误 |
4916 |
Failed to stop the cluster due to error detection of %1. |
集群停止失败 |
系统可执行处于不能正常运行的状态。 |
● |
● |
● |
● |
||||
mrw |
错误 |
4917 |
Failed to shut down the system due to error detection of %1. |
OS关闭失败 |
系统可执行处于不能正常运行的状态。 |
● |
● |
● |
● |
||||
mrw |
错误 |
4918 |
Failed to restart the system due to error detection of %1. |
OS重启失败 |
系统可执行处于不能正常运行的状态。 |
● |
● |
● |
● |
||||
mrw |
错误 |
4919 |
The group of monitor %1 is unknown. |
所属组不明 |
请确认集群配置信息。 |
● |
● |
● |
● |
||||
mrw |
警告 |
4920 |
No action is taken because %1 is not online. |
不执行复归动作 |
- |
● |
● |
● |
● |
||||
mrw |
信息 |
4921 |
Status of monitor %1 was returned to normal. |
状态正常 |
- |
● |
● |
● |
|||||
mrw |
信息 |
4922 |
Status of monitor %1 was changed into unknown. |
状态不明 |
系统可执行处于不能正常运行的状态。 |
● |
● |
● |
|||||
mrw |
错误 |
4923 |
Initialization error has occurred (%1 : %2) |
进程初始化异常 |
系统可执行处于不能正常运行的状态。 |
● |
● |
● |
● |
||||
mrw |
信息 |
4924 |
Causing intentional stop error was required because an error is detected by %1. |
停止错误的发生 |
- |
● |
● |
● |
|||||
mrw |
错误 |
4925 |
Causing intentional stop error has failed because an error is detected by %1. |
停止错误的发生 失败 |
系统可执行处于不能正常运行的状态。 |
● |
● |
● |
● |
||||
mrw |
警告 |
4926 |
Recovery will not be executed since server is suspending. |
不执行复归动作(服务器保留) |
服务器的状态为保留 (NP 未解决) 时,不执行监视资源复归动作。确认保留 (NP 未解决) 的原因,将NP资源设置为正常状态。 |
● |
● |
● |
● |
||||
mrw |
警告 |
4927 |
Shutdown count reached the maximum number (%1). Final action of monitor %2 was ignored. |
达到关闭次数的上限 |
- |
● |
● |
● |
● |
● |
● |
● |
|
mrw |
信息 |
4928 |
Script before action(%1) upon failure in %2 monitor resource started. |
监视资源异常时,开始最终动作前脚本 |
- |
● |
● |
● |
|||||
mrw |
信息 |
4929 |
Script before action(%1) upon failure in %2 monitor resource completed. |
监视资源异常时,结束最终动作前脚本 |
- |
● |
● |
● |
|||||
mrw |
信息 |
4930 |
Script before action(%1) upon failure in %2 monitor resource failed. |
监视资源异常时,最终动作前脚本失败 |
- |
● |
● |
● |
|||||
mrw |
信息 |
4931 |
Recovery script has executed because an error was detected in monitoring %1. |
复归脚本结束 |
- |
● |
● |
● |
|||||
mrw |
错误 |
4932 |
Attempted to execute recovery script due to the error detected in monitoring %1, but failed. |
复归脚本失败 |
确认复归脚本失败的原因,采进行处理。 |
● |
● |
● |
|||||
mrw |
警告 |
4933 |
Ignored the recovery action in monitoring %1 because recovery action caused by monitor resource error is disabled. |
为了控制监视资源异常时的复归动作,不执行复归动作。 |
- |
● |
● |
● |
|||||
mrw |
信息 |
4934 |
There was a notification (%1) from external. (detail: %2) |
接收来自外部的异常发生通知 |
- |
● |
● |
● |
|||||
tuxw |
警告 |
10004 |
The API Error of Application occurred.%1 |
发生应用程序API 错误。%1是API错误代码。 |
根据错误代码处理应用程序错误。 |
● |
|||||||
jra |
错误 |
20251 |
Failed to start Java Resource Agent(%1) |
发生了内部错误。
%1:内部错误代码
|
请确认JVM监视资源的运行状况。如果JVM监视资源未启动,请重启服务器。 |
● |
|||||||
jra |
错误 |
20252 |
Failed to start Java Resource Agent(%1) |
指定的设置值不正确。
%1:内部错误代码
|
请确认设置的Java安装路径是都正确。 |
● |
|||||||
sra |
错误 |
20301 |
Service was terminated because reading an SG file failed. |
在设置文件的读取处理中发生了异常。 |
请确认另外输出的消息 |
● |
|||||||
sra |
错误 |
20302 |
The installation folder name could not be acquired. |
获取安装文件夹失败。 |
请重启集群或者执行挂起/复原。 |
● |
|||||||
sra |
错误 |
20305 |
No IModules could be loaded. |
执行本产品所需的文件的一部分不存在,因此不能启动。 |
请重装本产品。 |
● |
|||||||
sra |
错误 |
20306 |
An unexpected error occurred. |
已启动本产品,但是由于某原因不能启动。 |
请重启集群或者执行挂起/复原。 |
● |
|||||||
sra |
错误 |
20307 |
Internal error occurred. |
本产品异常结束。 |
请参照之前输出的系统日志消息。 |
● |
|||||||
sra |
错误 |
20308 |
An error has occurred in issuing WMI. %1(ErrorID:0x%2 class:%3)
%1: Message
%2: Error code
%3: Information that could not be acquired
|
无法获取统计信息。
%1:消息
%2:错误代码
%3:不能获取的信息
|
请重启集群或者执行挂起/复原。 |
● |
|||||||
sra |
警告 |
20336 |
Script is timeout. (%1 %2)
%1: Script file name
%2: Argument
|
发生了内部错误。 |
请确认服务器的负载状况,消除负载。 |
● |
|||||||
sra |
信息 |
20346 |
%1 event succeeded.
%1: Event type (Boot, Shutdown, Stop, Start, or Flush)
|
执行运用管理名命令。
%1为输出执行的事件种类(Boot,Shutdown,Stop,Start,Flush)。
|
- |
● |
|||||||
sra |
警告 |
20347 |
%1 was smaller than %2, it changed to minimum value(%3). |
监视的设定值不正确。
%1:设置项目
%2:设置项目
%3:设定值
|
请通过Cluster WebUI确认设定值。 |
● |
|||||||
sra |
警告 |
20348 |
%1 was too long compared with %2, it changed to %1(%3). |
监视的设置值不正确。
%1:设置项目
%2:设置项目
%3:设置值
|
请通过Cluster WebUI确认设置值。 |
● |
|||||||
sra |
警告 |
20349 |
%1 was smaller than %2, it changed to %2 value(%3). |
监视的设置值不正确。
%1:设置项目
%2:设置项目
%3:设置值
|
请通过Cluster WebUI确认设置值。 |
● |
|||||||
sra |
警告 |
20350 |
%1 was larger than %2, it changed to %2 value(%3). |
监视的设置值不正确。
%1:设置项目
%2:设置项目
%3:设置值
|
请通过Cluster WebUI确认设置值。 |
● |
|||||||
sra |
警告 |
20351 |
%1 was over than Total disk size, %2. |
监视的设置值不正确。
%1:设置项目
%2:设置值
|
请通过Cluster WebUI确认设置值。 |
● |
|||||||
sra |
警告 |
20352 |
%1 was over than Total disk size, %2. |
监视的设置值不正确。
%1:设置项目
%2:设置值
|
请通过Cluster WebUI确认设置值。 |
● |
|||||||
sra |
警告 |
20353 |
Delete MOUNT[%1] in DiskCapacity list. |
监视的设置值不正确。
%1:设置值
|
请通过Cluster WebUI确认设置值。 |
● |
|||||||
sra |
警告 |
20354 |
%1 was illegal value (%2). |
监视的设置值不正确。
%1:设置项目
%2:设置值
|
请通过Cluster WebUI确认设置值。 |
● |
|||||||
sra |
警告 |
20355 |
The DriveLetter of %1 is not ready, or Drive type was not fixed.(DriveLetter = %2) |
监视的设置值不正确。
%1:设置项目
%2:设置值
|
请通过Cluster WebUI确认设置值。 |
● |
|||||||
sra |
错误 |
20358 |
A process resource error was detected. (type = cpu, pid = %1, %2) |
特定进程的CPU使用率监视中查出异常。
%1:进程ID
%2:进程名
|
请确认监视异常的原因。 |
● |
● |
||||||
sra |
错误 |
20358 |
A process resource error was detected. (type = memory leak, pid = %1, %2) |
特定进程的内存使用量监视中查出异常。
%1:进程ID
%2:进程名
|
请确认监视异常的原因。 |
● |
● |
||||||
sra |
错误 |
20358 |
A process resource error was detected. (type = file leak, pid = %1, %2) |
特定进程的打开文件数监视中查出异常。
%1:进程ID
%2:进程名
|
请确认监视异常的原因。 |
● |
● |
||||||
sra |
错误 |
20358 |
A process resource error was detected. (type = thread leak, pid = %1, %2) |
特定进程的线程数监视中查出异常。
%1:进程ID
%2:进程名
|
请确认监视异常的原因。 |
● |
● |
||||||
sra |
错误 |
20358 |
A process resource error was detected. (type = same name process, pid = %1, %2) |
同一名进程监视中查出异常。
%1:进程ID
%2:进程名
|
请确认监视异常的原因。 |
● |
● |
||||||
sra |
错误 |
20359 |
A system resource error was detected. (type = cpu) |
系统的CPU使用率监视中查出异常。 |
请确认监视异常的原因。 |
● |
● |
||||||
sra |
错误 |
20359 |
A system resource error was detected. (type = memory) |
系统的总内存使用量监视中查出异常。 |
请确认监视异常的原因。 |
● |
● |
||||||
sra |
错误 |
20359 |
A system resource error was detected. (type = swap) |
系统的总虚拟内存使用量监视中查出异常。 |
请确认监视异常的原因。 |
● |
● |
||||||
sra |
错误 |
20360 |
A disk resource error was detected. (type = used rate, level = NOTICE, %1) |
磁盘使用率监视中查出通知级别异常。
%1:逻辑驱动器
|
请确认监视异常的原因。 |
● |
● |
||||||
sra |
错误 |
20360 |
A disk resource error was detected. (type = used rate, level = WARNING, %1) |
磁盘使用率监视中查出警告级别的异常。
%1:逻辑驱动器
|
请确认监视异常的原因。 |
● |
● |
||||||
sra |
错误 |
20360 |
A disk resource error was detected. (type = free space, level = NOTICE, %1) |
磁盘空余容量监视中查出通知级别的异常。
%1:逻辑驱动器
|
请确认监视异常的原因。 |
● |
● |
||||||
sra |
错误 |
20360 |
A disk resource error was detected. (type = free space, level = WARNING, %1) |
磁盘空余容量监视中查出警告级别的异常。
%1:逻辑驱动器
|
请确认监视异常的原因。 |
● |
● |
||||||
webmgr |
警告 |
5121 |
HTTPS configuration isn't correct, HTTPS mode doesn't work. Please access WebManager by HTTP mode. |
HTTPS 设置不正确 |
- |
● |
● |
● |
|||||
sss |
错误 |
20004 |
系统驱动器字符获取失败。 |
系统驱动器字符获取失败。 |
系统可执行处于无法正常运行的状态。 |
● |
|||||||
sss |
错误 |
20005 |
服务器名取得失败。 |
服务器名取得失败。 |
系统可执行处于无法正常运行的状态。 |
● |
|||||||
sss |
信息 |
20006 |
服务器名取得失败。 |
服务器名取得失败。 |
- |
● |
● |
||||||
sss |
错误 |
20007 |
配置文件的更新失败。 |
配置文件的更新失败。 |
请确认集群配置信息。 |
● |
● |
||||||
sss |
信息 |
20008 |
配置文件被更新。 |
配置文件被更新。 |
- |
● |
|||||||
sss |
错误 |
20009 |
配置文件的内容无效。 |
配置文件的内容无效。 |
请确认集群配置信息。 |
● |
|||||||
sss |
错误 |
20010 |
%1无法启动服务。 |
%1无法启动服务。 |
系统可执行处于无法正常运行的状态。 |
● |
● |
||||||
sss |
信息 |
20012 |
%1服务启动了。 |
%1服务启动了。 |
- |
● |
|||||||
sss |
信息 |
20013 |
%1服务停止了。 |
%1服务停止了。 |
- |
● |
|||||||
sss |
信息 |
20014 |
启动了LAN卡的双重化模块。 |
启动了LAN卡的双重化模块。 |
可执行是内存不足或OS资源不足。请确认。 |
● |
|||||||
sss |
错误 |
20015 |
启动了LAN卡的双重化模块。 |
启动了LAN卡的双重化模块。 |
- |
● |
● |
||||||
ncctl |
错误 |
20101 |
查出LAN卡%1的异常。 |
查出LAN卡%1的异常。 |
确认是否适当设置了待机中的LAN卡。 |
● |
● |
||||||
ncctl |
警告 |
20102 |
LAN卡%1切换为LAN卡%2。 |
LAN卡%1切换为LAN卡%2。 |
- |
● |
● |
||||||
ncctl |
错误 |
20103 |
LAN卡%1的操作失败了。 |
LAN卡%1的操作失败了。 |
- |
● |
● |
4.3. 驱动程序事件日志消息
4.3.1. 内核模式LAN心跳驱动程序
以下事件在系统事件日志中通过"clphb"记录。
模块类型 |
事件分类 |
事件ID |
消息 |
描述 |
对策 |
|---|---|---|---|---|---|
clphb |
错误 |
3001 |
Fatal error occurred in the driver. |
在驱动程序内部发生致命的错误。 |
可执行是内核内存不足,OS资源不足。请用性能监视器确认。 |
clphb |
信息 |
1001 |
Signal has been set to the shutdown event due to the keep alive timeout. |
用户空间处于停止状态。 |
可执行是内存不足,OS资源不足。请确认。 |
clphb |
信息 |
1002 |
Signal has been set to the shutdown event due to the FILTER closing action. |
接受关闭FILTER口的动作。 |
可执行是内核内存不足,OS资源不足。请用性能监视器确认。 |
4.4. 组资源启动/停止时的详细信息
以下信息在资源启动或停止处理失败时作为记录到事件日志和警报日志中的消息内的详细信息来显示。
4.4.1. 应用程序资源
模块类型 |
分类 |
返回值 |
消息 |
描述 |
对策 |
|---|---|---|---|---|---|
appli |
错误 |
5 |
The application path is invalid. |
应用程序的路径无效。 |
请确认应用程序的路径是否正确。 |
appli |
错误 |
7 |
Failed to start application. |
应用程序的启动失败。 |
可执行是内存不足或者OS的资源不足。请确认。 |
appli |
错误 |
8 |
Failed to stop application. |
应用程序的停止失败。 |
可执行是内存不足或者OS的资源不足。请确认。 |
appli |
错误 |
10 |
Timeout occurred. |
发生超时。 |
请确认应用程序是否在超时时间内退出。 |
appli |
错误 |
11 |
Failed to log on as a user. |
用户登录失败。 |
请确认执行用户的域,帐号,密码是否正确设置。 |
appli |
错误 |
12 |
Returned termination code %1. |
非常驻型程序返回了非法终止代码。 |
请确认程序返回非法终止代码的原因。 |
appli |
错误 |
其他 |
Internal error occurred. |
发生内部错误。 |
可执行是内存不足或者OS的资源不足。请确认。 |
4.4.2. 脚本资源
模块类型 |
分类 |
返回值 |
消息 |
描述 |
对策 |
|---|---|---|---|---|---|
script |
错误 |
6 |
Failed to execute start script. |
开始脚本的启动失败。 |
可执行是内存不足或者OS的资源不足。请确认。 |
script |
错误 |
7 |
Failed to execute stop script. |
结束脚本的启动失败。 |
可执行是内存不足或者OS的资源不足。请确认。 |
script |
错误 |
8 |
Returned termination code %1. |
同步类型脚本返回了非法终止代码。 |
请确认脚本返回非法终止代码的原因。 |
script |
错误 |
9 |
Timeout occurred. |
发生超时。 |
请确认脚本是否在超时时间内结束。 |
script |
错误 |
10 |
Failed to log on as a user. |
用户登录失败。 |
请确认执行用户的域,账号,密码是否设置正确。 |
script |
错误 |
其他 |
Internal error occurred. |
发生内部错误。 |
可执行是内存不足或者OS的资源不足。请确认。 |
4.4.3. 服务资源
模块类型 |
分类 |
返回值 |
消息 |
描述 |
对策 |
|---|---|---|---|---|---|
service |
错误 |
5 |
Failed to get service control right. |
服务控制权的获取失败。 |
请确认服务名是否正确。 |
service |
错误 |
6 |
Failed to start service. |
服务的启动失败。 |
请确认服务的状态。 |
service |
错误 |
7 |
Failed to stop service. |
服务的停止失败。 |
请确认服务的状态。 |
service |
错误 |
8 |
Service has already been running. |
服务已经启动。 |
请确认服务的状态。如果服务启动完毕,可执行是没有将其作为错误设置。 |
service |
错误 |
10 |
Timeout occurred. |
发生超时。 |
请确认服务是否在超时时间内开始或停止。 |
service |
错误 |
13 |
Computer name related to service that is running is different from virtual computer name of target VCOM resource. |
正在启动的服务相关联的计算机名和对象VCOM资源的虚拟计算机名不同。 |
如果在多个服务资源中设置相同服务,请不要设置对象VCOM资源名。 |
service |
错误 |
其他 |
Internal error occurred. |
发生内部错误。 |
可执行是内存不足或者OS的资源不足。请确认。 |
4.4.4. 虚拟机资源
模块类型 |
分类 |
返回值 |
消息 |
描述 |
对策 |
|---|---|---|---|---|---|
vm |
错误 |
5 |
Virtual Machine configuration data is invalid. |
虚拟机器的配置文件可执行损坏。 |
请确认[虚拟机配置文件的路径]里的虚拟机配置文件。 |
vm |
错误 |
6 |
Virtual machine has been already started. |
因为虚拟机已经开启了,所以启动虚拟机失败。 |
请确认虚拟机的状态。 |
vm |
错误 |
7 |
Hyper-V Virtual Machine Management service has not started yet. |
Hyper-V Virtual Machine Management 服务正在停止。 |
请确认Hyper-V Virtual Machine Management 服务的状态。 |
vm |
错误 |
8 |
Failed to start virtual machine. |
虚拟机启动失败。 |
请确认虚拟机的状态和配置文件正常。 |
vm |
错误 |
9 |
Failed to stop virtual machine. |
虚拟机停止失败。 |
请确认虚拟机的状态。 |
vm |
错误 |
10 |
Failed to save virtual machine. |
虚拟机暂停・导出失败。 |
请确认在Hyper-V管理器中虚拟机的状态是「运行中」。 |
vm |
错误 |
11 |
Failed to resume virtual machine. |
虚拟机导入・重启失败。 |
请确认[虚拟机配置文件的路径]里的虚拟机配置文件。 |
vm |
错误 |
13 |
Timeout occurred. |
虚拟机导入,导出,启动,停止时间超时。 |
请确认timeout设定的时间是否合适。 |
vm |
错误 |
其他 |
Internal error occurred. |
内部错误发生。 |
请确认内存是否不足或OS的资源是否不足。 |
4.5. 监视资源异常时的详细信息
以下信息在查出监视资源异常时作为输出到事件日志和警报日志中的消息内的详细信息而显示。
4.5.1. 应用程序监视资源
模块类型 |
分类 |
返回值 |
消息 |
描述 |
对策 |
|---|---|---|---|---|---|
appliw |
错误 |
9 |
Process did not exist.(Exit code:%1) |
不存在进程。(仅限无法获取结束码时显示。) |
由于某种原因,监视对象应用程序资源的进程消失。请确认。 |
appliw |
错误 |
11 |
Failed to log on as a user. |
用户的登录失败。 |
请确认执行用户的域,帐号,密码是否正确设置。 |
appliw |
警告 |
其他 |
Internal error occurred. |
发生内部错误。 |
可执行是内存不足或者OS的资源不足。请确认。 |
4.5.2. DB2监视资源
模块类型 |
分类 |
返回值 |
消息 |
描述 |
对策 |
|---|---|---|---|---|---|
db2w |
警告 |
190 |
Initialization has failed[%1!s!]. |
初始化处理失败。可执行是内存分配等的失败。
%1中可执行显示初始化的内容。
|
可执行是由于OS自身异常,请重新启动服务器。 |
db2w |
警告 |
102 |
The configured value is not correct. |
监视的设置值不正确。 |
可执行是由于在Cluster WebUI上的设置值不正确,请确认设置值。 |
db2w |
警告 |
110 |
A function error was detected. |
发生函数异常。 |
可执行监视应用程序或者OS异常。请确认系统状态。 |
db2w |
错误 |
11 |
An error was detected in accessing the monitor target. |
连接数据库失败。 |
首先确认Cluster WebUI的设置值(数据库名等)。如果没有问题,请确认数据库是否异常。 |
db2w |
警告 |
112 |
An error was detected in user authentication. |
连接数据库失败。 |
首先确认Cluster WebUI的设置值(用户名,密码等)。如果没有问题,请确认数据库是否异常。 |
db2w |
警告 |
113 |
An application error was detected. |
检出数据库异常。 |
请参考另外显示的数据库错误消息,清除故障。 |
db2w |
错误 |
14 |
An error was detected in executing SQL statement [%1]. |
SQL文的执行失败。
%1中将显示执行的SQL文。
|
请参考另外显示的数据库错误消息,清除故障。 |
db2w |
错误 |
15 |
A data error was detected. |
数据库表内的值异常。 |
数据库可执行破损,请中止数据库的运行进行调查。另外,用相同监视表名同时执行多个监视也可执行发生错误。请特别确认双向环境的设置值是否有问题。 |
db2w |
警告 |
140 |
No license is registered. |
未注册License。 |
请注册License。 |
db2w |
警告 |
160 |
Failed to obtain the configuration data. |
显示无法获取设置值。 |
可执行OS异常,请重新启动服务器等。 |
db2w |
警告 |
190 |
Internal error. |
发生内部错误。 |
可执行是内存不足或者OS的资源不足。请确认。 |
4.5.3. 磁盘RW监视资源
模块类型 |
分类 |
返回值 |
消息 |
描述 |
对策 |
|---|---|---|---|---|---|
diskw |
错误 |
5 |
Failed to open the file. |
文件打开处理失败。 |
请确认是否已经加载监视目标磁盘的设备驱动,是否存在监视目标磁盘的设备,监视目标磁盘连接是否正确,监视目标磁盘的电源是否打开,或者监视目标磁盘上是否有其他异常发生。
可执行是内存不足或者OS的资源不足。请确认。
|
diskw |
错误 |
6 |
Failed to write in the file. |
文件写入处理失败。 |
请确认监视目标磁盘连接是否正确,监视目标磁盘的电源是否打开,或者监视目标磁盘上是否有其他异常发生。
可执行是内存不足或者OS的资源不足。请确认。
|
diskw |
错误 |
7 |
Failed to synchronize the disk of the file. |
文件的磁盘同步处理失败。 |
请确认监视目标磁盘连接是否正确,监视目标磁盘的电源是否打开,或者监视目标磁盘上是否有其他异常发生。
可执行是内存不足或者OS的资源不足。请确认。
|
diskw |
错误 |
8 |
Failed to close the file. |
文件关闭处理失败。 |
请确认监视目标磁盘连接是否正确,监视目标磁盘的电源是否打开,或者监视目标磁盘上是否有其他异常发生。
可执行是内存不足或者OS的资源不足。请确认。
|
diskw |
错误 |
71 |
Timeout has occurred when opening the file. |
文件打开处理检出超时。 |
请确认监视目标磁盘连接是否正确,监视目标磁盘的电源是否打开,或者监视目标磁盘上是否有其他异常发生。
可执行是系统高负荷,内存不足,或者OS的资源不足。请确认。
|
diskw |
错误 |
72 |
Timeout has occurred when writing in the file. |
文件写入处理检出超时。 |
请确认监视目标磁盘连接是否正确,监视目标磁盘的电源是否打开,或者监视目标磁盘上是否有其他异常发生。
可执行是系统高负荷,内存不足,或者OS的资源不足。请确认。
|
diskw |
错误 |
73 |
Timeout has occurred when synchronizing the disk of the file. |
文件的磁盘同步处理检出超时。 |
请确认监视目标磁盘连接是否正确,监视目标磁盘的电源是否打开,或者监视目标磁盘上是否有其他异常发生。
可执行是系统高负荷,内存不足,或者OS的资源不足。请确认。
|
diskw |
错误 |
74 |
Timeout has occurred when closing the file. |
文件关闭处理检出超时。 |
请确认监视目标磁盘连接是否正确,监视目标磁盘的电源是否打开,或者监视目标磁盘上是否有其他异常发生。
可执行是系统高负荷,内存不足,或者OS的资源不足。请确认。
|
diskw |
警告 |
100 |
Failed to add keep alive drive when initializing keep alive driver. |
由于Keep Alive驱动程序的初始化处理,Keep Alive的添加失败。 |
可执行是内存不足或者OS的资源不足。请确认。 |
diskw |
警告 |
101 |
There is not enough disk space. |
磁盘空间不足。 |
请确认监视对象磁盘空间是否足够。 |
diskw |
警告 |
102 |
Timeout has occurred when initializing internal resources. |
内部资源的初始化处理检出超时。 |
可执行是内存不足或者OS的资源不足。请确认。 |
diskw |
警告 |
103 |
Timeout has occurred when other timing. |
检测到由于其他不一致导致的超时。 |
系统可执行处于高负荷或者内存或OS资源可执行不足。请进行检查。 |
diskw |
警告 |
104 |
Failed to allocate memory. |
内存空间的分配失败。 |
可执行是内存不足或者OS的资源不足。请确认。 |
diskw |
警告 |
105 |
Internal error occurred. |
检出其他内部异常。 |
可执行是内存不足或者OS的资源不足。请确认。 |
diskw |
警告 |
190 |
Initialization error has occurred in internal resource. |
内部资源的初始化发生异常。 |
可执行是内存不足或者OS的资源不足。请确认。 |
4.5.4. FTP监视资源
模块类型 |
分类 |
返回值 |
消息 |
描述 |
对策 |
|---|---|---|---|---|---|
ftpw |
错误 |
11 |
An error was detected in accessing the monitor target. |
连接监视应用程序失败。 |
首先确认Cluster WebUI的设置值(IP地址等)。如果没有问题,请确认监视应用程序是否异常。 |
ftpw |
错误 |
12 |
An error was detected in user authentication. |
用户认证失败。 |
首先确认Cluster WebUI的设置值(用户名,密码等)。如果没有问题,请确认监视应用程序是否异常。 |
ftpw |
警告 |
110 |
A function error was detected. |
发生函数异常。 |
可执行监视应用程序或OS处于异常状态。请确认系统状态。 |
ftpw |
警告 |
113 |
An application error was detected. |
检出监视应用程序的异常。 |
请参考另外显示的监视应用程序的错误消息,清除故障。 |
ftpw |
警告 |
115 |
A data error was detected. |
应答数据的值异常。 |
请参考另外显示的监视应用程序的错误消息,清除故障。 |
ftpw |
警告 |
140 |
No license is registered. |
未注册License。 |
请注册License。 |
ftpw |
警告 |
188 |
Internal error. |
发生内部错误。 |
可执行是内存不足或者OS的资源不足。请确认。 |
ftpw |
警告 |
190 |
Initialization has failed[%1]. |
初始化处理失败。原因可执行是内存分配或取得设定值失败。
%1中显示初始化的内容。
|
可执行Cluster WebUI上的设置值不正确,请确认。设置值正确时,由于OS自身可执行处于异常状态,请执行重启服务器等操作。 |
4.5.5. 自定义监视资源
模块类型 |
分类 |
返回值 |
消息 |
描述 |
对策 |
|---|---|---|---|---|---|
genw |
错误 |
5 |
Failed to start script. |
脚本启动失败。 |
请确认脚本是否可以启动。 |
genw |
错误 |
6 |
Script did not exist. |
非同步类型的脚本异常结束。 |
请确认脚本结束的原因。 |
genw |
错误 |
8 |
Returned termination code %1. |
同步类型的脚本返回了不正确的结束代码。 |
请确认脚本返回不正确的结束代码的原因。 |
genw |
错误 |
9 |
Failed to log on as a user. |
用户登录失败。 |
请确认执行用户的域,账号,密码是否设置正确。 |
genw |
警告 |
100 |
Failed to start script. |
脚本启动失败。 |
请确认脚本是否可以启动。 |
genw |
警告 |
100 |
Returned termination code %1. |
同步类型的脚本返回了不正确的退出码。 |
请确认脚本返回不正确的退出码的原因。 |
genw |
警告 |
100
190
|
Script path is invalid. |
脚本的路径不正确。 |
请通过Cluster WebUI确认设定值。 |
genw |
警告 |
100
190
|
Internal error occurred. |
发生内部错误。 |
可执行是内存不足或者OS的资源不足。请确认。 |
genw |
警告 |
190 |
Parameter is invalid. |
监视的设定值不正确。 |
请通过Cluster WebUI确认设定值。 |
genw |
警告 |
190 |
Resource does not exist in cluster configuration data. |
集群配置信息不正确。 |
请通过Cluster WebUI确认配置信息。 |
genw |
警告 |
190 |
Failed to get the value from cluster configuration data. |
集群配置信息不正确。 |
请通过Cluster WebUI确认配置信息。 |
genw |
警告 |
190 |
Script did not exist. |
非同步类型的脚本异常退出。 |
请确认脚本退出的原因。 |
genw |
错误 |
200 |
Timeout occurred. |
同步类型的脚本在超时时间内没有结束。 |
请确认脚本结束延迟的原因。 |
4.5.6. HTTP监视资源
模块类型 |
分类 |
返回值 |
消息 |
描述 |
对策 |
|---|---|---|---|---|---|
httpw |
错误 |
11 |
An error was detected in accessing the monitor target. |
连接监视应用程序失败。 |
首先确认Cluster WebUI的设置值(IP地址等)。如果没有问题,请确认监视应用程序是否异常。 |
httpw |
警告 |
110 |
A function error was detected. |
发生函数异常。 |
可执行监视应用程序或OS处于异常状态。请确认系统状态。 |
httpw |
警告 |
113 |
An application error was detected. |
检出监视应用程序的异常。 |
请参考另外显示的监视应用程序的错误消息,清除故障。 |
httpw |
警告 |
115 |
A data error was detected. |
应答数据的值异常。 |
请参考另外显示的监视应用程序的错误消息,清除故障。 |
httpw |
警告 |
140 |
No license is registered. |
未注册License。 |
请注册License。 |
httpw |
警告 |
188 |
Internal error. |
发生内部错误。 |
可执行是内存不足或者OS的资源不足。请确认。 |
httpw |
警告 |
190 |
Initialization has failed[%1!s!]. |
初始化处理失败。原因可执行是内存分配或取得设定值的失败。
%1中显示初始化的内容。
|
可执行Cluster WebUI上的设置值不正确,请确认。设置值正确时,由于OS自身可执行处于异常状态,请执行重启服务器等操作。 |
4.5.7. IMAP4监视资源
模块类型 |
分类 |
返回值 |
消息 |
描述 |
对策 |
|---|---|---|---|---|---|
imap4w |
错误 |
11 |
An error was detected in accessing the monitor target. |
连接监视应用程序失败。 |
首先确认Cluster WebUI的设置值(IP地址等)。如果没有问题,请确认监视应用程序是否异常。 |
imap4w |
错误 |
12 |
An error was detected in user authentication. |
连接监视应用程序失败。 |
首先确认Cluster WebUI的设置值(用户名,密码等)。如果没有问题,请确认监视应用程序是否异常。 |
imap4w |
警告 |
110 |
A function error was detected. |
发生函数异常。 |
可执行监视应用程序或OS处于异常状态。请确认系统状态。 |
imap4w |
警告 |
113 |
An application error was detected. |
检出监视应用程序的异常。 |
请参考另外显示的监视应用程序的错误消息,清除故障。 |
imap4w |
警告 |
115 |
A data error was detected. |
应答数据的值异常。 |
请参考另外显示的监视应用程序的错误消息,清除故障。 |
imap4w |
警告 |
140 |
No license is registered. |
未注册License。 |
请注册License。 |
imap4w |
警告 |
188 |
Internal error. |
发生内部错误。 |
可执行是内存不足或者OS的资源不足。请确认。 |
imap4w |
警告 |
190 |
Initialization has failed[%1!s!]. |
初始化处理失败。原因可执行是内存分配或取得设定值失败。
%1中显示初始化的内容。
|
可执行Cluster WebUI上的设置值不正确,请确认。设置值正确时,由于OS自身可执行处于异常状态,请执行重启服务器等操作。 |
4.5.8. IP监视资源
模块类型 |
分类 |
返回值 |
消息 |
描述 |
对策 |
|---|---|---|---|---|---|
ipw |
错误 |
4 |
Ping could not reach. |
Ping不通。 |
请确认该IP地址的[ping]命令是否成功。如果[ping]命令失败,请确认拥有该IP地址的机器状态,或者网络界面的状态。 |
ipw |
警告 |
105 |
Timeout occurred. |
发生超时。 |
可执行是内存不足或者OS的资源不足。请确认。 |
ipw |
警告 |
189 |
Internal error occurred. |
发生内部错误。 |
可执行是内存不足或者OS的资源不足。请确认。 |
4.5.9. NIC Link Up/Down监视资源
模块类型 |
分类 |
返回值 |
消息 |
描述 |
对策 |
|---|---|---|---|---|---|
miiw |
错误 |
4 |
IP address does not exist. |
IP地址不存在。 |
可执行已经将NIC设为无效。请用[ipconfig]命令确认指定NIC的IP地址是否存在。 |
miiw |
错误 |
8 |
Detected NIC Link Down. |
检出NIC的Link Down。 |
请确认LAN线缆是否正确连接。 |
miiw |
警告 |
105 |
Failed to get IP address table. |
IP地址一览的获取失败。 |
可执行是内存不足或者OS的资源不足。请确认。 |
miiw |
警告 |
106 |
Failed to get the NIC interface name. |
NIC接口名称的获取失败。 |
可执行是内存不足或者OS的资源不足。请确认。 |
miiw |
警告 |
107 |
Failed to get the NIC status. |
NIC状态的获取失败。 |
确保NIC设备支持设备I/O控制。 |
miiw |
警告 |
189 |
An internal error has occurred. |
发生内部错误。 |
可执行是内存不足或者OS的资源不足。请确认。 |
4.5.10. 多任务监视资源
模块类型 |
分类 |
返回值 |
消息 |
描述 |
对策 |
|---|---|---|---|---|---|
mtw |
错误 |
其他 |
Internal error occurred.(status:%1) |
发生内部错误。 |
可执行是内存不足或者OS的资源不足。请确认。 |
mtw |
错误 |
5 |
Status of resources is abnormal. |
资源的状态异常。 |
请确认监视资源一览内设置的监视资源的状态。 |
mtw |
错误 |
1 |
This option is invalid. |
无效选项。 |
可执行是内存不足或者OS的资源不足。请确认。 |
4.5.11. 进程名监视资源
模块类型 |
分类 |
返回值 |
消息 |
描述 |
对策 |
|---|---|---|---|---|---|
psw |
错误 |
4 |
Process [%1, pid=%2] down. |
查出监视对象进程消失。 |
请确认监视对象进程是否正常运行。 |
psw |
错误 |
5 |
The number of processes to be monitored is less than the minimum process count. Process cout %1/%2 (%3) |
监视对象进程的启动进程数低于指定的下限值。 |
请确认监视对象进程是否正常运行。 |
psw |
警告 |
100 |
Internal error occurred. |
发生内部错误。 |
可执行是内存不足或OS资源不足。请确认。 |
psw |
警告 |
190 |
Parameter is invalid. |
监视的设置值不正确。 |
可执行是Cluster WebUI中的设置值不正确,请确认设置值。 |
4.5.12. ODBC监视资源
模块类型 |
分类 |
返回值 |
消息 |
描述 |
对策 |
|---|---|---|---|---|---|
odbcw |
警告 |
190 |
Initialization has failed[%1!s!]. |
初始化处理失败。可执行是内存分配等的失败。
%1中将可执行显示初始化的内容。
|
由于OS自身可执行处于异常状态,请执行重启服务器等操作。 |
odbcw |
警告 |
102 |
The configured value is not correct. |
监视的设置值不正确。 |
可执行Cluster WebUI上的设置值不正确,请确认。 |
odbcw |
警告 |
110 |
A function error was detected. |
函数发生异常。 |
可执行监视应用程序或OS处于异常状态。请确认系统状态。 |
odbcw |
错误 |
11 |
An error was detected in accessing the monitor target. |
连接数据库失败。 |
首先确认Cluster WebUI的设置值(数据库名等)。如果没有问题,请确认监视应用程序是否异常。 |
odbcw |
警告 |
112 |
An error was detected in user authentication. |
连接数据库失败。 |
首先确认Cluster WebUI的设置值(用户名,密码等)。如果没有问题,请确认监视应用程序是否异常。 |
odbcw |
警告 |
113 |
An application error was detected. |
检出数据库异常。 |
请参考另外显示的监视应用程序的错误消息,清除故障。 |
odbcw |
错误 |
14 |
An error was detected in executing SQL statement [%1!s!]. |
SQL文的执行失败。
%1中将显示执行的SQL文。
|
请参考另外显示的监视应用程序的错误消息,清除故障。 |
odbcw |
错误 |
15 |
A data error was detected. |
数据库表内的值异常。 |
数据库可执行破损,请中止数据库的运行进行调查。另外,用相同监视表名同时执行多个监视也可执行发生错误。请特别确认双向环境的设置值是否有问题。 |
odbcw |
警告 |
140 |
No license is registered. |
未注册License。 |
请注册License。 |
odbcw |
警告 |
160 |
Failed to obtain the configuration data. |
显示无法获取设置值。 |
由于OS可执行处于异常状态,请执行重启服务器等操作。 |
odbcw |
警告 |
190 |
Internal error. |
发生内部错误。 |
可执行是内存不足或者OS的资源不足。请确认。 |
4.5.13. Oracle监视资源
模块类型 |
分类 |
返回值 |
消息 |
描述 |
对策 |
|---|---|---|---|---|---|
oraclew |
警告 |
190 |
Initialization has failed[%1!s!]. |
初始化处理失败。可执行是内存分配等的失败。
%1中可执行显示初始化的内容。
|
由于OS自身可执行处于异常状态,请执行重启服务器等操作。 |
oraclew |
警告 |
102 |
The configured value is not correct. |
监视的设置值不正确。 |
可执行Cluster WebUI上的设置值不正确,请确认。 |
oraclew |
警告 |
110 |
A function error was detected. |
发生函数异常。 |
可执行监视应用程序或OS处于异常状态。请确认系统状态。 |
oraclew |
错误 |
11 |
An error was detected in accessing the monitor target. |
连接数据库失败。 |
首先确认Cluster WebUI的设置值(数据库名等)。如果没有问题,请确认监视应用程序是否异常。 |
oraclew |
警告 |
112 |
An error was detected in user authentication. |
连接数据库失败。 |
首先确认Cluster WebUI的设置值(用户名,密码等)。如果没有问题,请确认监视应用程序是否异常。 |
oraclew |
警告 |
113 |
An application error was detected. |
检出数据库异常。 |
请参考另外显示的监视应用程序的错误消息,清除故障。 |
oraclew |
错误 |
14 |
An error was detected in executing SQL statement [%1!s!]. |
SQL文的执行失败。
%1中将显示执行的SQL文。
|
请参考另外显示的监视应用程序的错误消息,清除故障。 |
oraclew |
错误 |
15 |
A data error was detected. |
数据库表内的值异常。 |
数据库可执行破损,请中止数据库的运行进行调查。另外,用相同监视表名同时执行多个监视也可执行发生错误。请特别确认双向环境的设置值是否有问题。 |
oraclew |
警告 |
140 |
No license is registered. |
未注册License。 |
未注册License。 |
oraclew |
警告 |
160 |
Failed to obtain the configuration data. |
显示无法获取设置值。 |
由于OS可执行处于异常状态,请执行重启服务器等操作。 |
oraclew |
警告 |
190 |
Internal error. |
发生内部错误。 |
可执行是内存不足或者OS的资源不足。请确认。 |
4.5.14. POP3监视资源
模块类型 |
分类 |
返回值 |
消息 |
描述 |
对策 |
|---|---|---|---|---|---|
pop3w |
错误 |
11 |
An error was detected in accessing the monitor target. |
连接监视应用程序失败。 |
首先确认Cluster WebUI的设置值(IP地址等)。如果没有问题,请确认监视应用程序是否异常。 |
pop3w |
错误 |
12 |
An error was detected in user authentication. |
连接监视应用程序失败。 |
首先确认Cluster WebUI的设置值(用户名,密码等)。如果没有问题,请确认监视应用程序是否异常。 |
pop3w |
警告 |
110 |
A function error was detected. |
发生函数异常。 |
可执行监视应用程序或OS处于异常状态。请确认系统状态。 |
pop3w |
警告 |
113 |
An application error was detected. |
检出监视应用程序的异常。 |
请参考另外显示的监视应用程序的错误消息,清除故障。 |
pop3w |
警告 |
115 |
A data error was detected. |
应答数据的值异常。 |
请参考另外显示的监视应用程序的错误消息,清除故障。 |
pop3w |
警告 |
140 |
No license is registered. |
未注册License。 |
请注册License。 |
pop3w |
警告 |
188 |
Internal error. |
发生内部错误。 |
可执行是内存不足或者OS的资源不足。请确认。 |
pop3w |
警告 |
190 |
Initialization has failed[%1]. |
初始化处理失败。原因可执行是内存分配或取得设定值失败。
%1中显示初始化的内容。
|
可执行Cluster WebUI上的设置值不正确,请确认。设置值正确时,由于OS自身可执行处于异常状态,请执行重启服务器等操作。 |
4.5.15. PostgreSQL监视资源
模块类型 |
分类 |
返回值 |
消息 |
描述 |
对策 |
|---|---|---|---|---|---|
psqlw |
警告 |
190 |
Initialization has failed[%1]. |
初始化处理失败。可执行是内存分配等的失败。
%1中可执行显示初始化的内容。
|
由于OS自身可执行处于异常状态,请执行重启服务器等操作。 |
psqlw |
警告 |
102 |
The configured value is not correct. |
监视的设置值不正确。 |
可执行Cluster WebUI上的设置值不正确,请确认。 |
psqlw |
警告 |
110 |
A function error was detected. |
发生函数异常。 |
可执行监视应用程序或OS处于异常状态。请确认系统状态。 |
psqlw |
错误 |
11 |
An error was detected in accessing the monitor target. |
连接数据库失败。 |
首先确认Cluster WebUI的设置值(数据库名等)。如果没有问题,请确认监视应用程序是否异常。 |
psqlw |
警告 |
112 |
An error was detected in user authentication. |
连接数据库失败。 |
首先确认Cluster WebUI的设置值(用户名,密码等)。如果没有问题,请确认监视应用程序是否异常。 |
psqlw |
警告 |
113 |
An application error was detected. |
检出数据库异常。 |
请参考另外显示的数据库的错误消息,清除故障。 |
psqlw |
错误 |
14 |
An error was detected in executing SQL statement [%1!s!]. |
SQL文的执行失败。
%1中将显示执行的SQL文。
|
请参考另外显示的数据库的错误消息,清除故障。 |
psqlw |
错误 |
15 |
A data error was detected. |
数据库表内的值异常。 |
数据库可执行破损,请中止数据库的运行进行调查。另外,用相同监视表名同时执行多个监视也可执行发生错误。请特别确认双向环境的设置值是否有问题。 |
psqlw |
警告 |
140 |
No license is registered. |
未注册License。 |
请注册License。 |
psqlw |
警告 |
160 |
Failed to obtain the configuration data. |
显示无法获取设置值。 |
由于OS可执行处于异常状态,请执行重启服务器等操作。 |
psqlw |
警告 |
190 |
Internal error. |
发生内部错误。 |
可执行是内存不足或者OS的资源不足。请确认。 |
4.5.16. 服务监视资源
模块类型 |
分类 |
返回值 |
消息 |
描述 |
对策 |
|---|---|---|---|---|---|
servicew |
错误 |
9 |
Service has been stopped. |
服务处于停止状态。 |
请确认服务的状态。 |
servicew |
警告 |
100 |
Failed to obtain the service control right. |
服务控制权的获取失败。 |
请确认服务名是否正确。 |
servicew |
警告 |
其他 |
An internal error has occurred. |
发生内部错误。 |
可执行是内存不足或OS的资源不足。请确认。 |
4.5.17. SMTP监视资源
模块类型 |
分类 |
返回值 |
消息 |
描述 |
对策 |
|---|---|---|---|---|---|
smtpw |
错误 |
11 |
An error was detected in accessing the monitor target. |
连接监视应用程序失败。 |
首先确认Cluster WebUI的设置值(IP地址等)。如果没有问题,请确认监视应用程序是否异常。 |
smtpw |
错误 |
12 |
An error was detected in user authentication. |
连接监视应用程序失败。 |
首先确认Cluster WebUI的设置值(用户名,密码等)。如果没有问题,请确认监视应用程序是否异常。 |
smtpw |
警告 |
110 |
A function error was detected. |
发生函数异常。 |
可执行监视应用程序或OS处于异常状态。请确认系统状态。 |
smtpw |
警告 |
113 |
An application error was detected. |
检出监视应用程序的异常。 |
请参考另外显示的监视应用程序的错误消息,清除故障。 |
smtpw |
警告 |
115 |
A data error was detected. |
应答数据的值异常。 |
请参考另外显示的监视应用程序的错误消息,清除故障。 |
smtpw |
警告 |
140 |
No license is registered. |
未注册License。 |
请注册License。 |
smtpw |
警告 |
188 |
Internal error. |
发生内部错误。 |
可执行是内存不足或者OS的资源不足。请确认。 |
smtpw |
警告 |
190 |
Initialization has failed[%1]. |
初始化处理失败。原因可执行是内存分配或取得设定值的失败。 |
可执行Cluster WebUI上的设置值不正确,请确认。设置值正确时,由于OS自身可执行处于异常状态,请执行重启服务器等操作。
%1中显示初始化的内容。
|
4.5.18. SQL Server监视资源
模块类型 |
分类 |
返回值 |
消息 |
描述 |
对策 |
|---|---|---|---|---|---|
sqlserverw |
警告 |
190 |
Initialization has failed[%1!s!]. |
初始化处理失败。可执行是内存分配等的失败。
%1中可执行显示初始化的内容。
|
由于OS自身可执行处于异常状态,请执行重启服务器等操作。 |
sqlserverw |
警告 |
102 |
The configured value is not correct. |
监视的设置值不正确。 |
可执行Cluster WebUI上的设置值不正确,请确认。 |
sqlserverw |
警告 |
110 |
A function error was detected. |
发生函数异常。 |
可执行监视应用程序或OS处于异常状态。请确认系统状态。 |
sqlserverw |
错误 |
11 |
An error was detected in accessing the monitor target. |
连接数据库失败。 |
首先确认Cluster WebUI的设置值(数据库名等)。如果没有问题,请确认监视应用程序是否异常。 |
sqlserverw |
警告 |
112 |
An error was detected in user authentication. |
连接数据库失败。 |
首先确认Cluster WebUI的设置值(用户名,密码等)。如果没有问题,请确认监视应用程序是否异常。 |
sqlserverw |
警告 |
113 |
An application error was detected. |
检出数据库异常。 |
请参考另外显示的数据库的错误消息,清除故障。 |
sqlserverw |
错误 |
14 |
An error was detected in executing SQL statement [%1!s!]. |
SQL文的执行失败。
%1中将显示执行的SQL文。
|
请参考另外显示的数据库的错误消息,清除故障。 |
sqlserverw |
错误 |
15 |
A data error was detected. |
数据库表内的值异常。 |
数据库可执行破损,请中止数据库的运行进行调查。另外,用相同监视表名同时执行多个监视也可执行发生错误。请特别确认双向环境的设置值是否有问题。 |
sqlserverw |
警告 |
140 |
No license is registered. |
未注册License。 |
请注册License。 |
sqlserverw |
警告 |
160 |
Failed to obtain the configuration data. |
显示无法获取设置值。 |
由于OS可执行处于异常状态,请执行重启服务器等操作。 |
sqlserverw |
警告 |
190 |
Internal error. |
发生内部错误。 |
可执行是内存不足或者OS的资源不足。请确认。 |
4.5.19. Tuxedo监视资源
模块类型 |
分类 |
返回值 |
消息 |
描述 |
对策 |
|---|---|---|---|---|---|
tuxw |
错误 |
11 |
An error was detected in accessing the monitor target. |
监视应用程序连接失败。 |
先确认Cluster WebUI的设置值(TUXCONFIG文件等)。如果没有问题,再确认是否有监视应用程序的异常。 |
tuxw |
警告 |
110 |
A function error was detected. |
函数发生了异常。 |
可执行是监视应用程序或者是OS异常状态。请确认系统状态。 |
tuxw |
警告 |
113 |
An application error was detected. |
检测出监视应用程序的异常。 |
请参考其他表示的监视应用程序错误信息,清除故障。 |
tuxw |
警告 |
140 |
No license is registered. |
License未注册。 |
请注册License。 |
tuxw |
警告 |
188 |
Internal error. |
发生内部错误。 |
可执行是内存不足或者OS的资源不足。请确认。 |
tuxw |
警告 |
190 |
Initialization has failed[%1]. |
初始化处理失败。原因可执行是内存分配或取得设定值的失败。
%1中显示初始化的内容。
|
可执行Cluster WebUI上的设置值不正确,请确认。设置值正确时,由于OS自身可执行处于异常状态,请执行重启服务器等操作。 |
4.5.20. 虚拟机监视资源
模块类型 |
分类 |
返回值 |
消息 |
描述 |
对策 |
|---|---|---|---|---|---|
vmw |
错误 |
12 |
Virtual machine is unnormal [%1!d!]. |
虚拟机是「运行中」以外的状态。 |
请确认在Hyper-V管理器中虚拟机的状态。 |
vmw |
错误 |
其他 |
Internal error occurred. |
内部错误发生。 |
请确认内存是否不足或OS的资源是否不足。 |
4.5.21. Websphere监视资源
模块类型 |
分类 |
返回值 |
消息 |
描述 |
对策 |
|---|---|---|---|---|---|
wasw |
错误 |
12 |
An error was detected in user authentication. |
监视应用程序连接失败。 |
先确认Cluster WebUI的设置值(TUXCONFIG文件等)。如果没有问题,再确认是否有监视应用程序的异常。 |
wasw |
警告 |
110 |
A function error was detected. |
函数发生了异常。 |
可执行是监视应用程序或者是OS异常状态。请确认系统状态。 |
wasw |
警告 |
113 |
An application error was detected. |
检测出监视应用程序的异常。 |
请参考其他表示的监视应用程序错误信息,排除故障。 |
wasw |
警告 |
140 |
No license is registered. |
License未注册。 |
请注册License。 |
wasw |
警告 |
188 |
Internal error. |
发生内部错误。 |
可执行是内存不足或者OS的资源不足。请确认。 |
wasw |
警告 |
190 |
Initialization has failed[%1]. |
初始化处理失败。原因可执行是内存分配或取得设定值失败。
%1中显示初始化的内容。
|
可执行Cluster WebUI上的设置值不正确,请确认。设置值正确时,由于OS自身可执行处于异常状态,请执行重启服务器等操作。 |
4.5.22. Weblogic监视资源
模块类型 |
分类 |
返回值 |
消息 |
描述 |
对策 |
|---|---|---|---|---|---|
wlsw |
错误 |
11 |
An error was detected in accessing the monitor target. |
监视应用程序连接失败。 |
先确认Cluster WebUI的设置值(IP地址等)。如果没有问题,再确认是否有监视应用程序的异常。 |
wlsw |
错误 |
12 |
An error was detected in user authentication. |
监视应用程序连接失败。 |
先确认Cluster WebUI的设置值(用户名,密码等)。如果没有问题,再确认是否有监视应用程序的异常。 |
wlsw |
警告 |
110 |
A function error was detected. |
函数发生了异常。 |
可执行是监视应用程序或者是OS异常状态。请确认系统状态。 |
wlsw |
警告 |
113 |
An application error was detected. |
检测出监视应用程序的异常。 |
请参考其他表示的监视应用程序错误信息,消除故障。 |
wlsw |
警告 |
140 |
No license is registered. |
License未注册。 |
请注册License。 |
wlsw |
警告 |
188 |
Internal error. |
发生内部错误。 |
可执行是内存不足或者OS的资源不足。请确认。 |
wlsw |
警告 |
190 |
Initialization has failed[%1]. |
初始化处理失败。原因可执行是内存分配或取得设定值的失败。
%1中可执行显示初始化的内容。
|
可执行Cluster WebUI上的设置值不正确,请确认。设置值正确时,由于OS自身可执行处于异常状态,请执行重启服务器等操作。 |
4.5.23. WebOTX监视资源
模块类型 |
分类 |
返回值 |
消息 |
描述 |
对策 |
|---|---|---|---|---|---|
otxw |
错误 |
11 |
An error was detected in accessing the monitor target. |
监视应用程序访问失败。 |
先确认Cluster WebUI的设置值(例如服务器名)。如果没有问题,再确认是否有监视应用程序的异常 |
otxw |
错误 |
12 |
An error was detected in user authentication. |
监视应用程序访问失败。 |
先确认Cluster WebUI的设置值(例如用户名或密码)。如果没有问题,再确认是否有监视应用程序的异常 |
otxw |
警告 |
110 |
A function error was detected. |
函数发生了异常。 |
可执行是监视应用程序或者是OS异常状态。请确认系统状态。 |
otxw |
警告 |
113 |
An application error was detected. |
检测出监视应用程序的异常。 |
请参考另外显示的监视应用程序错误信息,排除故障。 |
otxw |
警告 |
140 |
No license is registered. |
License未注册。 |
请注册License。 |
otxw |
警告 |
188 |
Internal error. |
发生内部错误。 |
可执行是内存不足或者OS的资源不足。请确认。 |
otxw |
警告 |
190 |
Initialization has failed[%1]. |
初始化处理失败。原因可执行是内存分配或取得设定值失败。
%1中显示初始化的内容。
|
可执行Cluster WebUI上的设置值不正确,请确认。设置值正确时,由于OS自身可执行处于异常状态,请执行重启服务器等操作。 |
4.5.24. JVM 监视资源
模块类型 |
分类 |
返回值 |
消息 |
描述 |
对策 |
|---|---|---|---|---|---|
jraw |
错误 |
11 |
An error was detected in accessing the monitor target. |
无法连接监视对象 |
请确认监视对象Java VM是否已启动。 |
jraw |
错误 |
12 |
JVM status changed to abnormal. cause = %1. |
在Java VM的监视中查出异常 |
请根据消息,确认在监视对象Java VM上运行的Java应用程序。 |
jraw |
警告 |
192 |
Internal error occurred. |
发生内部错误 |
请执行集群挂起和集群复原。 |
4.5.25. 系统监视资源
模块类型 |
分类 |
返回值 |
消息 |
描述 |
对策 |
|---|---|---|---|---|---|
sraw |
错误 |
11 |
Monitor sraw has detected an error. (11: A system resource error has been detected.) |
在系统资源的监视中查出异常。 |
资源出现某种异常。请确认。 |
4.5.26. 进程资源监视资源
模块类型 |
分类 |
返回值 |
消息 |
描述 |
对策 |
|---|---|---|---|---|---|
psrw |
错误 |
11 |
Monitor psrw has detected an error. (11: Detected an error in monitoring process resource.) |
在进程资源的监视中查出异常。 |
资源出现某种异常。请确认。 |
4.5.27. 用户空间监视资源
模块类型 |
分类 |
返回值 |
消息 |
描述 |
对策 |
|---|---|---|---|---|---|
userw |
错误 |
71 |
Timeout has occurred when creating dummy thread. |
生成dummy线程处理发生超时。 |
可执行是系统高负荷,内存不足或OS的资源不足。请确认。 |
userw |
警告 |
100 |
Timeout has occurred when initializing internal resources. |
初始化内部资源处理发生超时。 |
可执行是内存不足或者OS资源不足。请确认。 |
userw |
警告 |
101 |
Timeout has occurred when closing dummy thread handle. |
关闭dummy线程句柄处理发生超时。 |
可执行是系统高负荷,内存不足或OS的资源不足。请确认。 |
userw |
警告 |
102 |
Timeout has occurred when other timing. |
检测到由于其他不一致导致的超时。 |
系统可执行处于高负荷或者内存不足或OS资源不足。请进行检查。 |
userw |
警告 |
190 |
Initialization error has occurred in internal resource. |
内部资源的初始化发生异常。 |
可执行是内存不足或者OS资源不足。请确认。 |
4.6. 磁盘RW监视资源STOP代码列表
以下的情况是磁盘RW监视资源在"查出Stall异常时的动作"里选择了[生成主动停止错误]的情况下发生STOP代码列表。
STOP代码 |
内容 |
|---|---|
0xE0000000 |
组资源启动/停止失败时,监视资源检出异常时的最终动作发生的STOP错误 |
0xE000FF** |
Keep alive timout(磁盘RW监视的timeout)发生的STOP错误
后8位(**的部分)在下面(timeout时执行的可执行性比较高的处理)表示。
|
0xE000FF00 |
EXPRESSCLUSTER的内部处理 |
0xE000FF01 |
free(), SetWaitableTimer(), GetTickCount(), WaitForMultipleObjects() |
0xE000FF02 |
CreateFile(), _beginthreadex() |
0xE000FF03 |
malloc(), WriteFile() |
0xE000FF04 |
FlushFileBuffers() |
0xE000FF05 |
CloseHandle() |
0xE000FF06 |
EXPRESSCLUSTER的内部处理 |
4.7. JVM监视资源输出日志消息
以下消息为JVM监视资源独有的日志文件——JVM操作日志,JVM LB联动日志的消息列表。
生成位置如下所示。
JVM操作日志
<EXPRESSCLUSTER X安装路径>\log\ha\jra\jragent*.log (*为0开始的数字)
JVM LB联动日志
<EXPRESSCLUSTER X安装路径>\log\ha\jra\lbadmin.log
4.7.1. JVM操作日志
消息 |
发生原因 |
处理方法 |
|---|---|---|
Failed to write the %1.stat. |
JVM统计日志写入失败。
%1.stat:JVM统计日志文件名
|
请确认磁盘剩余空间是否足够。 |
%1: analyze finish[%4]. state = %2, cause = %3 |
(监视对象Java VM状态异常时)监视对象Java VM的资源使用量超过阈值。
%1:监视对象Java VM名称
%2:监视对象Java VM状态
(1=正常,0=异常)
%3:发生异常时的错误部分
%4:测量线程名
|
请修改在监视对象Java VM上运行的Java应用程序。 |
thread stopped by UncaughtException. |
JVM监视资源的线程已停止。 |
请执行集群挂起/集群复原,重新启动JVM监视资源。 |
thread wait stopped by Exception. |
JVM监视资源的线程已停止。 |
请执行集群挂起/集群复原,重新启动JVM监视资源。 |
%1: monitor thread can't connect to JVM. |
无法连接监视对象Java VM。
%1:监视对象Java VM名称
|
请确认监视对象Java VM是否已启动。 |
%1: monitor thread can't get the JVM state. |
无法从监视对象Java VM获取资源使用量。
%1:监视对象Java VM名称
|
请确认监视对象Java VM是否已启动。 |
%1: JVM state is changed [abnormal -> normal]. |
监视对象Java VM状态由异常变为正常。
%1:监视对象Java VM名称
|
- |
%1: JVM state is changed [normal -> abnormal]. |
监视对象Java VM状态由正常变为异常。
%1:监视对象Java VM名称
|
请修改在监视对象Java VM上运行的Java应用程序。 |
%1: Failed to connect to JVM. |
无法连接监视对象Java VM。
%1:监视对象Java VM名称
|
请确认监视对象Java VM是否已启动。 |
Failed to write exit code. |
JVM监视资源无法写入记录退出代码的文件。 |
请确认磁盘剩余空间是否足够。 |
Failed to be started JVM Monitor. |
启动JVM监视资源失败。 |
请确认JVM操作日志,消除无法启动的原因后,执行集群挂起/集群复原,重新启动JVM监视资源。 |
JVM Monitor already started. |
JVM监视资源已启动。 |
请执行集群挂起/集群复原,重新启动JVM监视资源。 |
%1: GARBAGE_COLLECTOR_MXBEAN_DOMAIN_TYPE is invalid. |
从监视对象Java VM获取GC信息失败。
%1:监视对象Java VM名称
|
请确认监视对象Java VM的操作环境是否正确。 |
%1: GarbageCollectorMXBean is invalid. |
从监视对象Java VM获取GC信息失败。
%1:监视对象Java VM名称
|
请确认监视对象Java VM的操作环境是否正确。 |
%1: Failed to measure the GC stat. |
从监视对象Java VM获取GC信息失败。
%1:监视对象Java VM名称
|
请确认监视对象Java VM的操作环境是否正确。 |
%1: GC stat is invalid. last.getCount = %2, last.getTime = %3, now.getCount = %4, now.getTime = %5. |
从监视对象Java VM获取GC发生次数,测量执行时间失败。
%1:监视对象Java VM名称
%2:上次测量时的GC发生次数
%3:上次测量时的GC总执行时间
%4:此次测量时的GC发生次数
%5:此次测量时的GC总执行时间
|
请确认监视对象Java VM的操作环境是否正确。 |
%1: GC average time is too long. av = %6, last.getCount = %2, last.getTime = %3, now.getCount = %4, now.getTime = %5. |
监视对象Java VM中GC的平均执行时间超过阈值。
%1:监视对象Java VM名称
%2:上次测量时的GC发生次数
%3:上次测量时的GC总执行时间
%4:此次测量时的GC发生次数
%5:此次测量时的GC总执行时间
%6:上次测量到此次测量之间,GC的平均执行时间
|
请修改在监视对象Java VM上运行的Java应用程序。 |
%1: GC average time is too long compared with the last connection. av = %6, last.getCount = %2, last.getTime = %3, now.getCount = %4, now.getTime = %5. |
重新连接监视对象Java VM后,监视对象Java VM中,GC的平均执行时间超过阈值。
%1:监视对象Java VM名称
%2:上次测量时的GC发生次数
%3:上次测量时的GC总执行时间
%4:此次测量时的GC发生次数
%5:此次测量时的GC总执行时间
%6:上次测量到此次测量之间,GC的平均执行时间
|
请修改在监视对象Java VM上运行的Java应用程序。 |
%1: GC count is too frequently. count = %4 last.getCount = %2, now.getCount = %3. |
监视对象Java VM中GC的发生次数超过阈值。
%1:监视对象Java VM名称
%2:上次测量时的GC发生次数
%3:此次测量时的GC发生次数
%4:上次测量到此次测量之间的GC发生次数
|
请修改在监视对象Java VM上运行的Java应用程序。 |
%1: GC count is too frequently compared with the last connection. count = %4 last.getCount = %2, now.getCount = %3. |
重新连接监视对象Java VM后,监视对象Java VM中,GC的发生次数超过阈值。
%1:监视对象Java VM名称
%2:上次测量时的GC发生次数
%3:此次测量时的GC发生次数
%4:上次测量到此次测量之间的GC发生次数
|
请修改在监视对象Java VM上运行的Java应用程序。 |
%1: RuntimeMXBean is invalid. |
从监视对象Java VM获取信息失败。
%1:监视对象Java VM名称
|
请确认监视对象Java VM的操作环境是否正确。 |
%1: Failed to measure the runtime stat. |
从监视对象Java VM获取信息失败。
%1:监视对象Java VM名称
|
请确认监视对象Java VM的操作环境是否正确。
请确认监视对象Java VM中,处理负载是否过高。
|
%1: MEMORY_MXBEAN_NAME is invalid. %2, %3. |
从监视对象Java VM获取内存信息失败。
%1:监视对象Java VM名称
%2:内存池的名称
%3:内存的名称
|
请确认监视对象Java VM的操作环境是否正确。 |
%1: MemoryMXBean is invalid. |
从监视对象Java VM获取内存信息失败。
%1:监视对象Java VM名称
|
请确认监视对象Java VM的操作环境是否正确。 |
%1: Failed to measure the memory stat. |
从监视对象Java VM获取内存信息失败。
%1:监视对象Java VM名称
|
请确认监视对象Java VM的操作环境是否正确。
请确认监视对象Java VM中,处理负载是否过高。
|
%1: MemoryPool name is undefined. memory_name = %2. |
无法从监视对象Java VM获取内存信息。
%1:监视对象Java VM名称
%2:测量对象的Java内存池名称
|
请确认监视对象Java VM的操作环境是否正确。 |
%1: MemoryPool capacity is too little. memory_name = %2, used = %3, max = %4, ratio = %5. |
监视对象Java VM的Java内存池剩余空间小于阈值。
%1:监视对象Java VM名称
%2:测量对象的Java内存池名称
%3:Java内存池的使用量
%4:Java内存池的最大使用量
%5:Java内存池的利用率
|
请修改在监视对象Java VM上运行的Java应用程序。 |
%1: THREAD_MXBEAN_NAME is invalid. |
从监视对象Java VM获取线程信息失败。
%1:监视对象Java VM名称
|
请确认监视对象Java VM的操作环境是否正确。 |
%1: ThreadMXBean is invalid. |
从监视对象Java VM获取线程信息失败。
%1:监视对象Java VM名称
|
请确认监视对象Java VM的操作环境是否正确。 |
%1: Failed to measure the thread stat. |
从监视对象Java VM获取线程信息失败。
%1:监视对象Java VM名称
|
请确认监视对象Java VM的操作环境是否正确。 |
%1: Detect Deadlock. threads = %2. |
监视对象Java VM的线程发生死锁。
%1:监视对象Java VM名称
%2:死锁的线程ID
|
请修改在监视对象Java VM上运行的Java应用程序。 |
%1: Thread count is too much(%2). |
监视对象Java VM中启动的线程数超过阈值。
%1:监视对象Java VM名称
%2:测量时的线程启动数
|
请修改在监视对象Java VM上运行的Java应用程序。 |
%1: ThreadInfo is null.Thread count = %2. |
从监视对象Java VM获取线程信息失败。
%1:监视对象Java VM名称
%2:测量时的线程启动数
|
请确认监视对象Java VM的版本的操作环境是否正确。 |
%1: Failed to disconnect. |
切断监视对象Java VM失败。
%1:监视对象Java VM名称
|
- |
%1: Failed to connect to WebLogicServer. |
连接监视对象WebLogic Server失败。
%1:监视对象Java VM名称
|
请修改在监视对象WebLogic Server上运行的Java应用程序。 |
%1: Failed to connect to Sun JVM. |
连接监视对象Java VM,WebOTX失败。
%1:监视对象Java VM名称
|
请修改在监视对象Java VM,WebOTX上运行的Java应用程序。 |
Failed to open the %1. |
输出JVM统计日志失败。
%1:HA/JVMSaverJVM 统计日志文件名称
|
请确认磁盘剩余空间是否足够,是否超出能打开文件的上限数。 |
%1: Can't find monitor file. |
无法监视。
%1:监视对象Java VM名称
|
- |
%1: Can't find monitor file, monitor stopped[thread:%2]. |
停止监视。
%1:监视对象Java VM名称
%2:测量线程的类型
|
- |
%1: Failed to create monitor status file. |
创建内部文件失败。
%1:监视对象Java VM名称
|
请确认是否超出磁盘剩余空间或卷的最大文件数。 |
%1: Failed to delete monitor status file. |
删除内部文件失败。
%1:监视对象Java VM名称
|
请确认硬盘是否有问题。 |
%1: com.bea:Type=ServerRuntime is invalid. |
从监视对象Java VM获取信息失败。
%1:监视对象Java VM名称
|
请确认监视对象Java VM的操作环境是否正确。 |
%1: WorkManagerRuntimeMBean or ThreadPoolRuntimeMBean is invalid. |
从监视对象WebLogic Server获取信息失败。
%1:监视对象Java VM名称
|
请确认监视对象WebLogic Server的操作环境是否正确。 |
%1: Failed to measure the WorkManager or ThreadPool stat. |
从监视对象WebLogic Server获取信息失败。
%1:监视对象Java VM名称
|
请确认监视对象WebLogic Server的操作环境是否正确。 |
%1: ThreadPool stat is invalid. last.pending = %2, now.pending = %3. |
测量监视对象WebLogic Server线程池的待机请求数失败。
%1:监视对象Java VM名称
%2:上次测量时的待机请求数
%3:此次测量时的待机请求数
|
请确认监视对象WebLogic Server版本的操作环境是否正确。 |
%1: WorkManager stat is invalid. last.pending = %2, now.pending = %3. |
测量监视对象WebLogic Server运行管理的待机请求数失败。
%1:监视对象Java VM名称
%2:上次测量时的待机请求数
%3:此次测量时的待机请求数
|
请确认监视对象WebLogic Server版本的操作环境是否正确。 |
%1: PendingRequest count is too much. count = %2. |
监视对象WebLogic Server线程池的待机请求数超过阈值。
%1:监视对象Java VM名称
%2:此次测量时的待机请求数
|
请修改在监视对象WebLogic Server上运行的Java应用程序。 |
%1: PendingRequest increment is too much. increment = %4, last.pending = %2, now.pending = %3. |
监视对象WebLogic Server线程池的待机请求数增量超过阈值。
%1:监视对象Java VM名称
%2:上次测量时的待机请求数
%3:此次测量时的待机请求数
%4:上次测量到此次测量之间,待机请求数的增量
|
请修改在监视对象WebLogic Server上运行的Java应用程序。 |
%1: PendingRequest increment is too much compared with the last connection. increment = %4, last.pending = %2, now.pending = %3. |
与监视对象WebLogic Server重新连接后,监视对象WebLogic Server线程池的待机请求数增量超过阈值。
%1:监视对象Java VM名称
%2:上次测量时的待机请求数
%3:此次测量时的待机请求数
%4:上次测量到此次测量之间,待机请求数的增量
|
请修改在监视对象WebLogic Server上运行的Java应用程序。 |
%1: Throughput count is too much. count = %2. |
监视对象WebLogic Server线程池在单位时间内执行的请求数超过阈值。
%1:监视对象Java VM名称
%2:此次测量时在单位时间内执行的请求数
|
请修改在监视对象WebLogic Server上运行的Java应用程序。 |
%1: Throughput increment is too much. increment = %4, last.throughput = %2, now.throughput = %3. |
监视对象WebLogic Server线程池在单位时间内执行的请求数增量超过阈值。
%1:监视对象Java VM名称
%2:上次测量时在单位时间内执行的请求数
%3:此次测量时在单位时间内执行的请求数
%4:上次测量到此次测量之间,单位时间内执行请求数的增量
|
请修改在监视对象WebLogic Server上运行的Java应用程序。 |
%1: Throughput increment is too much compared with the last connection. increment = %4:, last.throughput = %2, now.throughput = %3. |
与监视对象WebLogic Server重新连接后,监视对象WebLogic Server线程池在单位时间内执行请求数的增量超过阈值。
%1:监视对象Java VM名称
%2:上次测量时在单位时间内执行的请求数
%3:此次测量时在单位时间内执行的请求数
%4:上次测量到此次测量之间,单位时间内执行请求数的增量
|
请修改在监视对象WebLogic Server上运行的Java应用程序。 |
%1: PendingRequest count is too much. appName = %2, name = %3, count = %4. |
监视对象WebLogic Server运行管理的待机请求数超过阈值。
%1:监视对象Java VM名称
%2:应用程序名
%3:运行管理名
%4:待机请求数
|
请修改在监视对象WebLogic Server上运行的Java应用程序。 |
%1: PendingRequest increment is too much. appName = %2, name = %3, increment = %6, last.pending = %4, now.pending = %5. |
监视对象WebLogic Server运行管理的待机请求增量超过阈值。
%1:监视对象Java VM名称
%2:应用程序名
%3:运行管理名
%4:上次测量时的待机请求数
%5:此次测量时的待机请求数
%6:上次测量到此次测量之间,待机请求数的增量
|
请修改在监视对象WebLogic Server上运行的Java应用程序。 |
%1: PendingRequest increment is too much compared with the last connection. AppName = %2, Name = %3, increment = %6, last.pending = %4, now.pending = %5. |
与监视对象WebLogic Server重新连接后,监视对象WebLogic Server运行管理的待机请求增量超过阈值。
%1:监视对象Java VM名称
%2:应用程序名
%3:运行管理名
%4:上次测量时的待机请求数
%5:此次测量时的待机请求数
%6:上次测量到此次测量之间,待机请求数的增量
|
请修改在监视对象WebLogic Server上运行的Java应用程序。 |
%1: Can't find WorkManager. appName = %2, name = %3. |
无法从WebLogic Server获取已设置的运行管理。
%1:监视对象Java VM名称
%2:应用程序名
%3:运行管理名
|
请修改[监视对象WebLogic的运行管理]的设置。 |
%1: analyze of average start[%2]. |
平均值分析已开始。
%1:监视对象Java VM名称
%2:线程名
|
- |
%1: analyze of average finish[%2].state = %3. |
平均值分析已结束。
%1:监视对象Java VM名称
%2:线程名
%3:监视对象的状态
|
- |
%1: Average of PendingRequest count is too much. count = %2. |
监视对象WebLogic Server线程池的待机请求数的平均值超过阈值。
%1:监视对象Java VM名称
%2:此次测量时的待机请求数
|
请修改在监视对象WebLogic Server上运行的Java应用程序。 |
%1: Average of Throughput count is too much. count = %2. |
监视对象WebLogic Server线程池在单位时间内执行的请求数平均值超过阈值。
%1:监视对象Java VM名称
%2:此次测量时在单位时间内执行的请求数
|
请修改在监视对象WebLogic Server上运行的Java应用程序。 |
%1: Average of PendingRequest count is too much. AppName = %2, Name = %3, count = %4. |
监视对象WebLogic Server运行管理的待机请求数平均值超过阈值。
%1:监视对象Java VM名称
%2:应用程序名
%3:运行管理名
%4:此次测量时的待机请求数
|
请修改在监视对象WebLogic Server上运行的Java应用程序。 |
Error: Failed to operate clpjra_bigip.[%1] |
%1:错误代码 |
请修改设定内容。 |
4.7.2. JVM LB联动日志
消息 |
发生原因 |
处理方法 |
|---|---|---|
lbadmin command start. |
开始执行LB联动的命令。 |
- |
lbadmin command finish. |
已结束执行LB联动的命令。 |
- |
Into HealthCheck mode. |
存活侦测(Health Check)功能有效。 |
- |
Into Weight mode. |
监视对象Java VM的负载计算功能有效。 |
- |
The PID of lbadmin.jar is "%1". |
LB联动进程名的进程ID。
%1:lbadmin.jar的进程ID
|
- |
Thread wait stopped by Exception |
测定备份已中止。 |
- |
Rename Command succeeded. |
成功重命名HTML文件。 |
- |
Rename Command failed. |
重命名HTML文件失败。 |
请确认HTML文件名和HTML重命名的文件名。 |
%1 doesn't exist. |
重命名源HTML文件不存在。
%1:HTML文件名
|
请确认HTML文件名。 |
%1 already exists. |
已存在重命名源的HTML文件。
%1:HTML重命名源文件名
|
请确认HTML重命名目标文件名。 |
Can't rename file:%1. |
重命名HTML文件失败。
%1:HTML文件名
|
请确认HTML重命名目标文件名 |
The number of retries exceeded the limit. |
HTML文件重命名处理超过重试次数上限。 |
请确认HTML重命名目标文件名。 |
The percent of the load is "%1". |
完成监视对象Java VM的负载计算。
%1:监视对象Java VM的负载
|
- |
stat log (%1) doesn't exist. |
没有JVM统计日志文件。
%1:JVM统计日志文件名
|
请执行集群挂起/集群复原,重新启动JVM监视资源。 |
stat log(%1:) cannot be opened for reading. |
无法打开JVM统计日志文件。
%1:JVM统计日志文件名
|
请执行集群挂起/集群复原,重新启动JVM监视资源。 |
format of stat log (%1) is wrong. |
JVM统计日志文件内容非法。
%1:JVM统计日志文件名
|
删除JVM统计日志文件后,请执行集群挂起/集群复原,重新启动JVM监视资源。 |
Failed to get load of application server. |
从JVM统计日志文件获取负载计算的数据失败。 |
请正确设置监视对象Java VM的负载计算。 |
Can't find lock file(%1s*.stat.lck), maybe HA/JVMSaver did not start yet. |
未启动JVM监视。
%1:内部文件名
|
请启动JVM监视资源。 |
4.8. 用户空间监视资源的STOP代码列表
以下信息是在用户空间监视资源的"查出Stall异常时的动作"中选择"生成主动停止错误"时发生的STOP代码列表。
STOP代码 |
内容 |
|---|---|
0xE0000000 |
作为检测到监视资源异常时的最终动作发生的STOP错误 |
0xE000FF** |
因KeepAlive超时(用户空间监视超时)而发生的STOP错误
后8位(**的部分)表示下述Check Point(超时时被执行的可执行性高的处理)。
|
0xE000FF00 |
EXPRESSCLUSTER的内部处理 |
0xE000FF01 |
SetWaitableTimer(), GetTickCount(), WaitForMultipleObjects() |
0xE000FF02 |
_beginthreadex(),WaitForMultipleObjects() |
0xE000FF05 |
CloseHandle() |
0xE000FF06 |
EXPRESSCLUSTER的内部处理 |