1. Preface
1.1. Who Should Use This Guide
The Configuration Guide is intended for system engineers who intend to introduce a system and system administrators who will operate and maintain the introduced system. It describes how to set up EXPRESSCLUSTER X SingleServerSafe.
1.2. How This Guide Is Organized
2. EXPRESSCLUSTER X SingleServerSafe: Provides a product overview of EXPRESSCLUSTER X SingleServerSafe.
3. Creating configuration data: Describes how to start the Cluster WebUI / WebManager and the procedures to create the configuration data by using a sample configuration.
4. Group resource details: Provides details on group resources, which are used as a unit for controlling an application by using EXPRESSCLUSTER X SingleServerSafe.
5. Monitor resource details: Provides details on monitor resources, which are used as a unit when EXPRESSCLUSTER X SingleServerSafe executes monitoring.
6. Other setting details: Provides details on the other settings for EXPRESSCLUSTER X SingleServerSafe.
7. Monitoring details: Provides details on how several types of errors are detected.
8. Notes and Restrictions: Describes known problems and how to prevent them.
1.3. Terms Used in This Guide
EXPRESSCLUSTER X SingleServerSafe, which is described in this guide, uses windows and commands common to those of the clustering software EXPRESSCLUSTER X to ensure high compatibility with EXPRESSCLUSTER X in terms of operation and other aspects. Therefore, cluster-related terms are used in parts of the guide.
The terms used in this guide are defined below.
- Cluster, cluster system
A single server system using EXPRESSCLUSTER X SingleServerSafe
- Cluster shutdown, reboot
Shutdown or reboot of a system using EXPRESSCLUSTER X SingleServerSafe
- Cluster resource
A resource used in EXPRESSCLUSTER X SingleServerSafe
- Cluster object
A resource object used in EXPRESSCLUSTER X SingleServerSafe
- Failover group
A group of group resources (such as applications and services) used in EXPRESSCLUSTER X SingleServerSafe
1.4. EXPRESSCLUSTER X SingleServerSafe Documentation Set
The EXPRESSCLUSTER X SingleServerSafe manuals consist of the four guides below. The title and purpose of each guide is described below:
EXPRESSCLUSTER X SingleServerSafe Installation Guide
This guide is intended for system engineers who intend to introduce a system using EXPRESSCLUSTER X SingleServerSafe and describes how to install EXPRESSCLUSTER X SingleServerSafe.
EXPRESSCLUSTER X SingleServerSafe Configuration Guide
This guide is intended for system engineers who intend to introduce a system using EXPRESSCLUSTER X SingleServerSafe and system administrators who will operate and maintain the introduced system. It describes how to set up EXPRESSCLUSTER X SingleServerSafe.
EXPRESSCLUSTER X SingleServerSafe Operation Guide
This guide is intended for system administrators who will operate and maintain an introduced system that uses EXPRESSCLUSTER X SingleServerSafe. It describes how to operate EXPRESSCLUSTER X SingleServerSafe.
EXPRESSCLUSTER X SingleServerSafe Legacy Feature Guide
This guide is intended for system engineers who want to introduce systems using EXPRESSCLUSTER X SingleServerSafe and describes EXPRESSCLUSTER X SingleServerSafe 4.2 WebManager and Builder.
1.5. Conventions
In this guide, Note, Important, See also are used as follows:
Note
Used when the information given is important, but not related to the data loss and damage to the system and machine.
Important
Used when the information given is necessary to avoid the data loss and damage to the system and machine.
See also
Used to describe the location of the information given at the reference destination.
The following conventions are used in this guide.
Convention |
Usage |
Example |
|---|---|---|
Bold |
Indicates graphical objects, such as fields, list boxes, menu selections, buttons, labels, icons, etc. |
In User Name, type your name.
On the File menu, click Open Database.
|
Angled bracket within the command line |
Indicates that the value specified inside of the angled bracket can be omitted. |
|
Monospace (courier) |
Indicates path names, commands, system output (message, prompt, etc), directory, file names, functions and parameters. |
|
Monospace bold (courier) |
Indicates the value that a user actually enters from a command line. |
Enter the following:
clpcl -s -a
|
Monospace italic
(courier)
|
Indicates that users should replace italicized part with values that they are actually working with. |
|
1.6. Contacting NEC
For the latest product information, visit our website below:
2. EXPRESSCLUSTER X SingleServerSafe
This chapter outlines the functions of EXPRESSCLUSTER X SingleServerSafe and describes the types of errors that can be monitored.
This chapter covers:
2.1. EXPRESSCLUSTER X SingleServerSafe
EXPRESSCLUSTER X SingleServerSafe is set up on a server. It monitors for application errors and hardware failures on the server and, upon detecting an error or failure, automatically restarts the failed application or reboots the server so as to ensure greater server availability.
With EXPRESSCLUSTER X SingleServerSafe, specify the applications and hardware components to be monitored for automatic error detection. Upon detecting an error, EXPRESSCLUSTER X SingleServerSafe automatically restarts the application or server that caused the error to recover from the error.
2.2. How an error is detected in EXPRESSCLUSTER X SingleServerSafe
EXPRESSCLUSTER X SingleServerSafe performs several different types of monitoring to ensure quick and reliable error detection. The details of the monitoring functions are described below.
- Monitoring activation status of applicationsAn error can be detected by starting up an application by using an application-starting resource (called application resource and service resource) of EXPRESSCLUSTER and regularly checking whether the process is active or not by using application-monitoring resource (called application monitor resource and service monitor resource). It is effective when the factor for application to stop is due to error termination of an application.
Note
If an application started directly by EXPRESSCLUSTER X SingleServerSafe starts and then ends a resident process to be monitored, EXPRESSCLUSTER X SingleServerSafe cannot detect an error in that resident process.
An internal application error (for example, application stalling and result error) cannot be detected.
- Monitoring applications and/or protocols to see if they are stalled or failed by using the monitoring option.You can monitor for the stalling and failure of applications including specific databases (such as Oracle, DB2), protocols (such as FTP, HTTP), and application servers (such as WebSphere, WebLogic) by introducing optional monitoring products of EXPRESSCLUSTER X SingleServerSafe. For details, see "5. Monitor resource details".
- Resource monitoringAn error can be detected by monitoring the resources (applications, services, etc.) and LAN status by using the monitor resources of EXPRESSCLUSTER X SingleServerSafe. It is effective when the factor for application to stop is due to an error of a resource that is necessary for an application to operate.
3. Creating configuration data
In EXPRESSCLUSTER X SingleServerSafe, data describing how a system is set up is called configuration data. Configuration data is created using Cluster WebUI. This chapter describes how to start the Cluster WebUI and the procedure for creating configuration data by using a sample cluster configuration.
This chapter covers:
3.1. Checking the values to be specified
Before creating configuration data by using the Cluster WebUI, check the values you are going to specify as the configuration data. Write down the values to make sure there is no missing information.
3.1.1. Sample environment
Sample configuration data values are shown below. The following sections describe step-by-step procedures for creating configuration data based on these conditions. When actually specifying the values, you might need to modify them according to the cluster you intend to create. For details about how to decide on the values, see "4. Group resource details" and "Monitor resource details."
Sample values of configuration data
Target |
Parameter |
Value |
|---|---|---|
Server information |
Server name |
server1 |
System drive |
C: |
|
group |
Type |
Failover |
Group name |
failover1 |
|
Startup server |
server1 |
|
First group resources |
Type |
Application resources |
Group resource name |
appli1 |
|
Resident Type |
Resident |
|
Start Path |
Path of execution file |
|
First monitor resource |
Type |
User mode monitor resources |
Monitor resource name |
userw |
|
User Heartbeat Interval/Timeout |
On |
|
Monitoring Method |
keepalive |
|
Action When Timeout Occurs |
Generating of intentional Stop Error |
|
Create a Dummy Thread |
On |
|
Second monitor resources |
Type |
IP monitor resources |
Monitor resource name |
ipw1 |
|
Monitor IP address |
192.168.0.254 (gateway) |
|
Recovery Target |
server1(server name) |
|
Reactivation threshold |
- |
|
Final Action |
Stop service and reboot OS |
|
Third monitor resources |
Type |
Application monitor |
Monitor resource name |
appliw1 |
|
Target Resource |
appli1 |
|
Recovery Target: |
failover1 |
|
Reactivation threshold |
3 |
|
Final Action: |
Stop service and reboot OS |
Note
The values of "User mode monitor resources" for the first monitor resources are automatically specified.
3.2. Starting up the Cluster WebUI
The configuration data can be created by accessing the Cluster WebUI. This section describes the overview of the Cluster WebUI and how to create the configuration data.
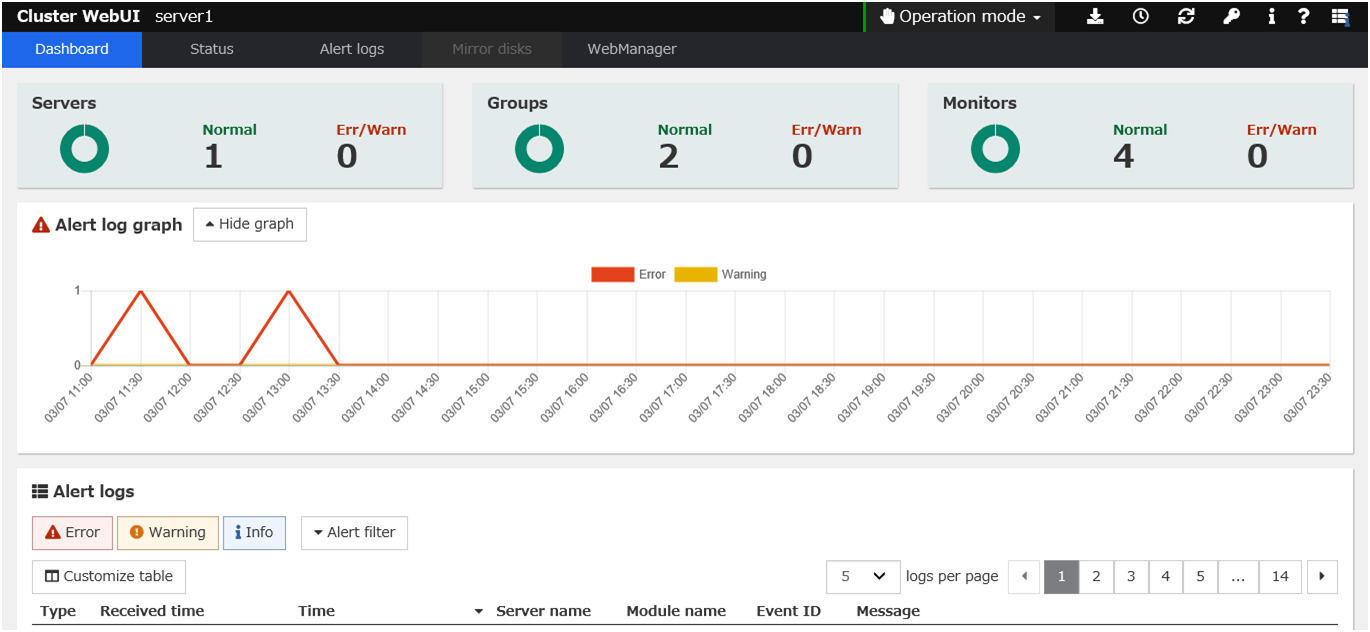
3.2.1. What is Cluster WebUI?
The Cluster WebUI is a function for monitoring the server status, starting and stopping servers and groups, and collecting operation logs through a web browser. The overview of the Cluster WebUI is shown in the following figure.
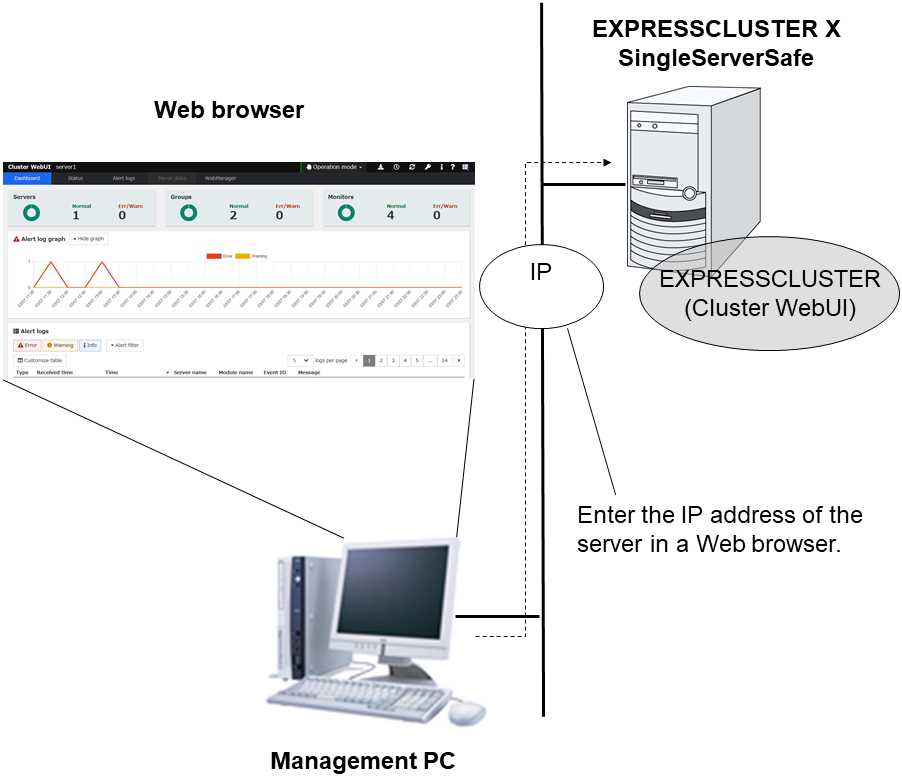
3.2.2. Starting the Cluster WebUI
The following describes how to start the Cluster WebUI.
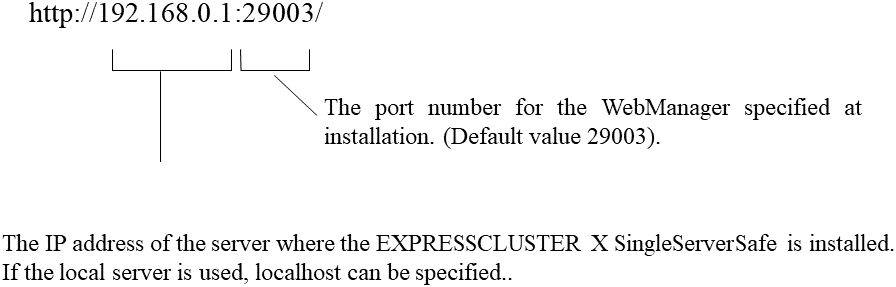
- Start your Web browser.Enter the IP address and port number of the server where EXPRESSCLUSTER X SingleServerSafe is installed in the browser address bar.
- The Cluster WebUI starts.
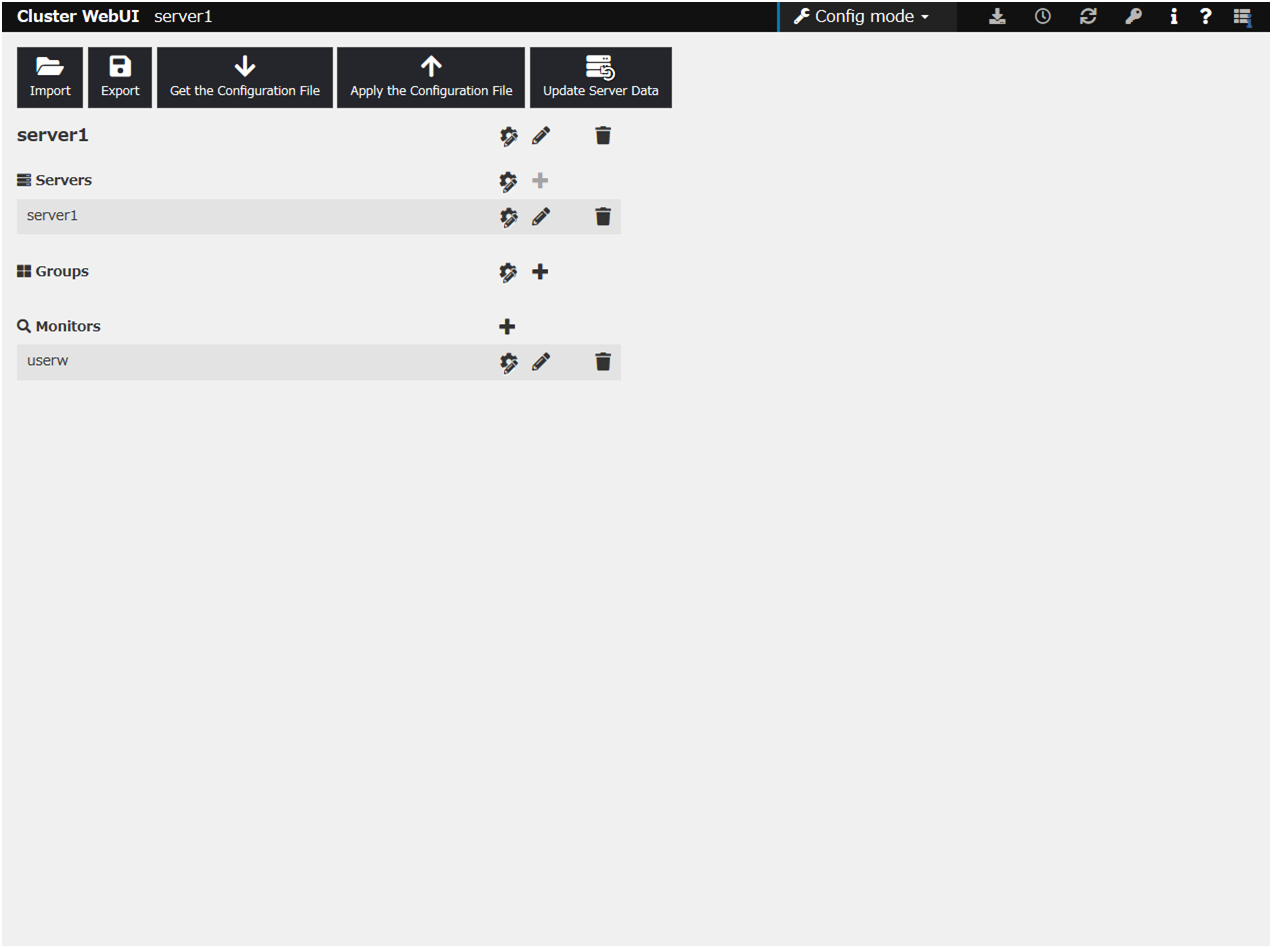
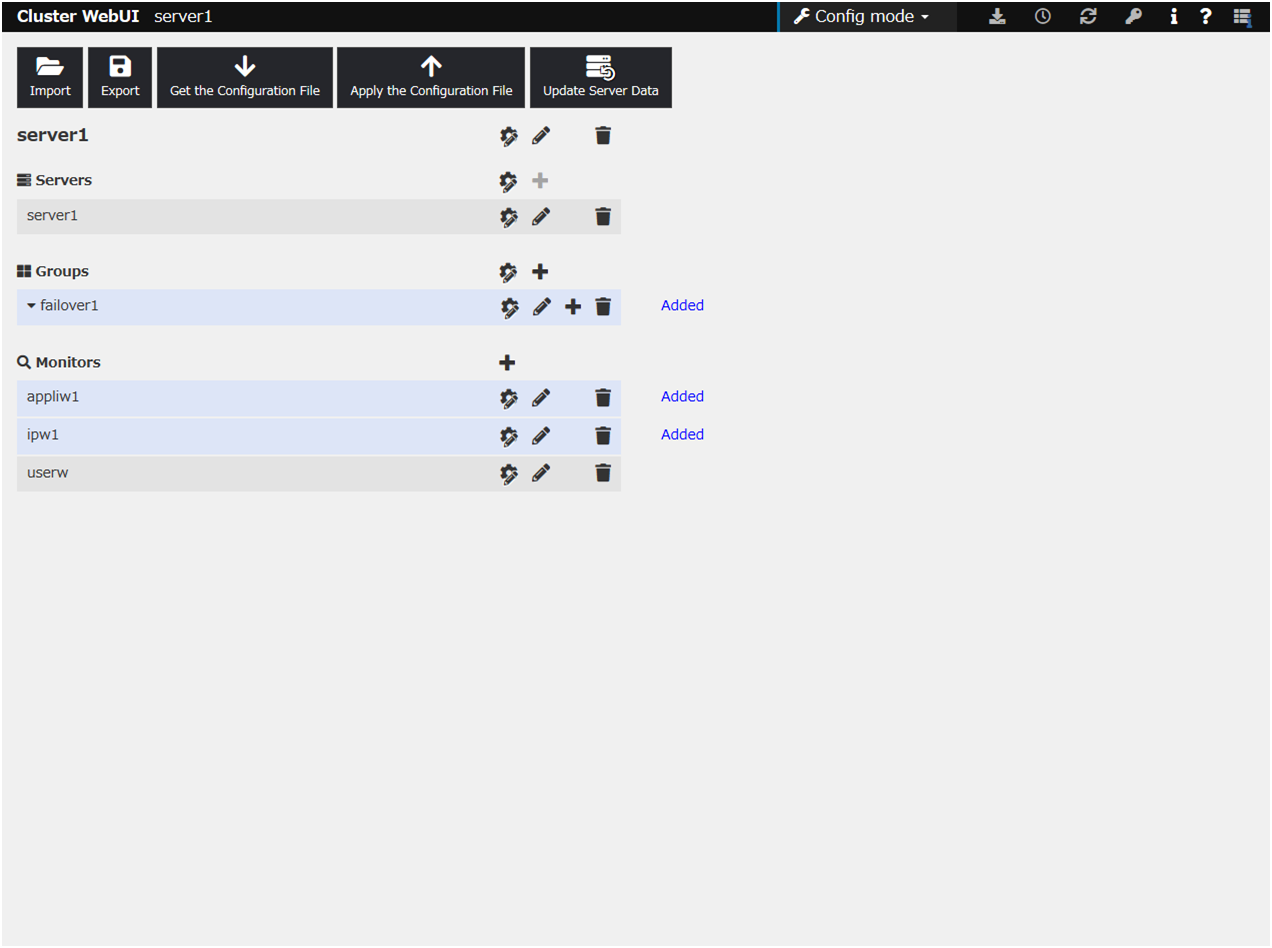
From the drop-down menu of the toolbar, select Config Mode to switch to the config mode.
See also
To enable encrypted communication with EXPRESSCLUSTER Server, see "6.1.9. WebManager tab" in "6. Other setting details". Enter the following to perform encrypted communication.
https://192.168.0.1:29003/
3.3. Creating the configuration data
Creating configuration data involves three steps: setting up the server, creating groups, and creating monitor resources. Use the creation wizard to create new configuration data. The procedure is described below.
Note
Most of the created configuration data can be modified later by using the rename function or property viewing function.
-
Set up the server on which to run EXPRESSCLUSTER X SingleServerSafe.
- Specify the server name to be configured.
-
Set up groups. Starting and stopping an application is controlled by a group. Create as many groups as necessary. Generally, you need as many groups as the number of applications you want to control. However, when you use script resources, you can combine more than one application into a single group.
- Add a group.
- Add a resource that can start and stop an application.
3.3.3. Setting up monitor resources
Add a monitor resource that monitors the specified target.Create as many resources as the number of targets you want to monitor.- Add a monitor resource that performs monitoring.
3.3.1. Setting up the server
Set up the server.
3.3.1.1. Setting up the server
The server settings are automatically created when you reboot the OS after installing EXPRESSCLUSTER X SingleServerSafe. When you switch from the Cluster WebUI's operation mode window to the Config Mode window, you will see the created data.
The window is as follows:
3.3.2. Setting up groups
3.3.2.1. Adding a group
Set up a group.
Click Add group in Groups.
The Group Definition dialog box is displayed.
Choose one of the types below.
Type:
- FailoverIn general, specify this.
- Virtual machineWhen using a virtual machine resource, specify this.Enter the group name (failover1) in the Name box, and click Next.
- Make sure that the Failover is possible on all servers check box is selected, and then click Next.
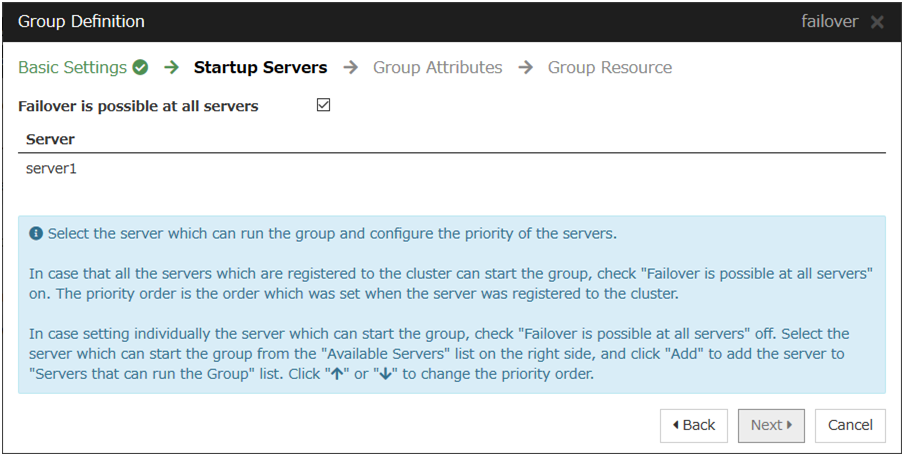
This dialog box is used to specify the values of the failover group attributes. Click Next without specifying anything. The Group Resource List is displayed.
3.3.2.2. Adding a group resource (application resource)
Add an application resource that can start and stop the application.
Click Add in Group Resource List.
The Resource Definition of Group(failover1) dialog box is displayed. Select the group resource type (application resource) in the Type box, and enter the group resource name appli1 in the Name box. Click Next.
Note
The available types are Application resource, Script resource, and Service resource. When selecting Virtual machine for the type of the group in "2-1 Adding a group", Virtual machine resource is selectable.
A page for setting up a dependency is displayed. Click Next.
- Recovery Operation at Activation Failure Detection and Recovery Operation at Deactivation Failure Detection are displayed.Click Next.
Select Resident in the Resident Type. And specify the path of the execution file for the Start Path.
Note
For the Start Path and Stop Path, specify an absolute path to the executable file or the name of the executable file of which the path configured with environment variable is effective. Do not specify a relative path. If it is specified, starting up the application resource may fail.
- Click Finish.An application resource is added to the Group Resource List.
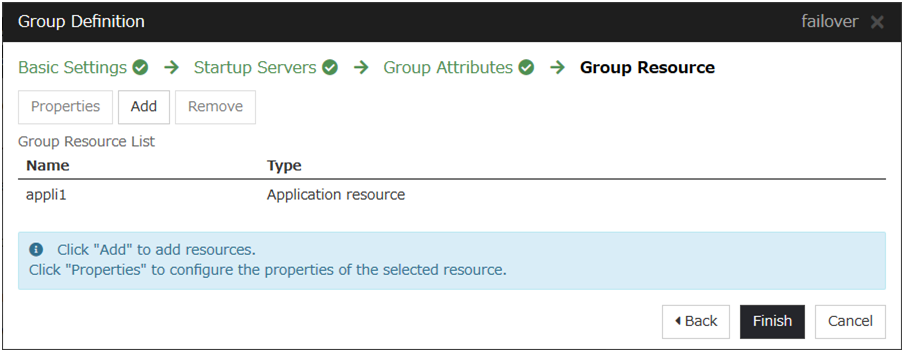
Click Finish.
3.3.3. Setting up monitor resources
Add a monitor resource that monitors the specified target.
3.3.3.1. Adding a monitor resource (IP monitor resource)
Click Add monitor resource in Monitors. The Monitor Resource Definition is displayed.
Select the monitor resource type ip monitor in the Type box, and enter the monitor resource name ipw1 in the Name box. Click Next.
Note
Monitor resources are displayed in Type. Select the resource you want to monitor.If the licenses for optional products have not been installed, the resources and monitor resources corresponding to those licenses are not shown in the list on the Cluster WebUI.If any monitor resources are not displayed in the list box of Type even though the licenses are registered, please click Get License Info button.Enter the monitor settings. Change nothing from the default values. Click Next.
The IP Addresses is displayed. Click Add.
Enter the IP address to be monitored 192.168.0.254 in the IP Address box, and then click OK.
Note
For monitoring target of the IP monitor resource, specify an IP address of the device (i.e., gateway) that is assumed to be always active on public LAN
The entered IP address is set in the IP Addresses. Click Next.
Specify the recovery target. Click Browse.
Click failover1 in the displayed tree view. Click OK. "failover1" is set in the Recovery Target.
- Click OK.After the settings are specified, the window appears as follows.
This concludes creating the configuration data. Proceed to the next section "3.4. Saving configuration data".
3.4. Saving configuration data
Click Export in the config mode of Cluster WebUI.
Select a location to save the data and save it.
Note
One file (clp.conf) and one directory (scripts) are saved. If any of these are missing, the attempt to apply the configuration data will fail. Make sure to treat these two as a set. When new configuration data is edited, clp.conf.bak is created in addition to these two.
Note
If you specified a port number for Port Number that differed from the default value when installing EXPRESSCLUSTER X SingleServerSafe, click Cluster Properties and then the Port No. tab and change the value of WebManager HTTP Port Number to the same value as that specified at the time of installation, before saving the configuration data.
3.5. Applying configuration data
Click Apply the Configuration File in the config mode of Cluster WebUI.
- Depending on the difference between the existing configuration data and the configuration data you are uploading, a pop-up window might be displayed to prompt you to check the operation necessary to upload the data.If there is no problem with the operation, click OK.When the upload ends successfully, a popup message saying "The application finished successfully." is displayed. Click OK.If the upload fails, perform the operations by following the displayed message.
- The status will be displayed on the Cluster WebUI.
 For how to operate and check the Cluster WebUI, see the online manual from the
 button on the upper right of the screen.
4. Group resource details
This chapter provides details about group resources.
EXPRESSCLUSTER X SingleServerSafe uses windows common to those of the clustering software EXPRESSCLUSTER X to ensure high compatibility with EXPRESSCLUSTER X in terms of operation and other aspects.
This chapter covers:
4.1. Group resources
The following resources can be defined as group resources.
Group resource name |
Function |
Abbreviation |
|---|---|---|
Application resource |
Provides a mechanism for starting and stopping an application (including a user-created application). |
appli |
Script resource |
Provides a mechanism for starting and stopping a script (BAT) such as a user-created script. |
script |
Service resource |
Provides a mechanism for starting and stopping a service such as a database or Web service. |
service |
VM resource |
Starts and stops a virtual machine. |
vm |
4.1.1. System requirements for VM resource
The versions of the virtualization platform that support VM resources are listed below.
Virtualization platform |
Version |
Remarks |
|---|---|---|
Hyper-V |
Windows Server 2012 Hyper-V
Windows Server 2012 R2 Hyper-V
|
Note
VM resources do not work on Windows Server 2016.
4.2. Setting up application resources
You can register applications that are to be managed by EXPRESSCLUSTER X SingleServerSafe and executed when a group starts or stops. It is also possible to register your own applications in application resources.
Applications are programs that are executable from the command line and have an extension such as exe, cmd, or bat.
4.2.1. Details tab
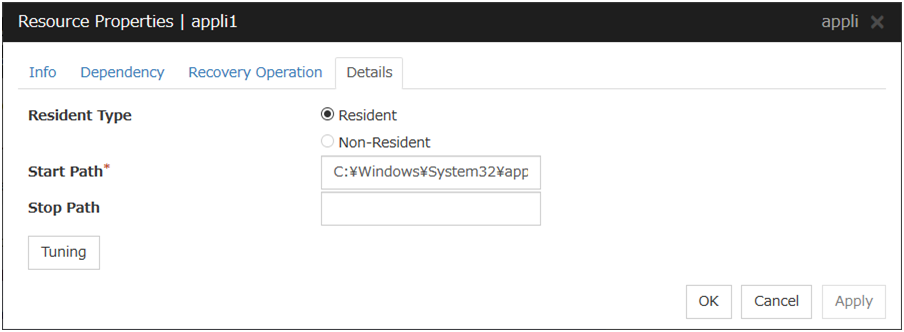
Resident Type (default: Resident)
Specify the type of the application. Choose one of the types below.
Start Path (within 1023 bytes)
Specify the name of the file that can be run when the application resource is started.
Stop Path (within 1023 bytes)
Specify the name of the file that can be run when the application resource is stopped.
The operation is as described below if the resident type is Resident.
Note
For the Start Path and Stop Path, specify an absolute path to the executable file or the name of the executable file of which the path configured with environment variable is effective. Do not specify a relative path. If it is specified, starting up the application resource may fail.
Tuning
Use this button to display the Application Resource Tuning Properties dialog box. Configure the detailed settings for the application resources.
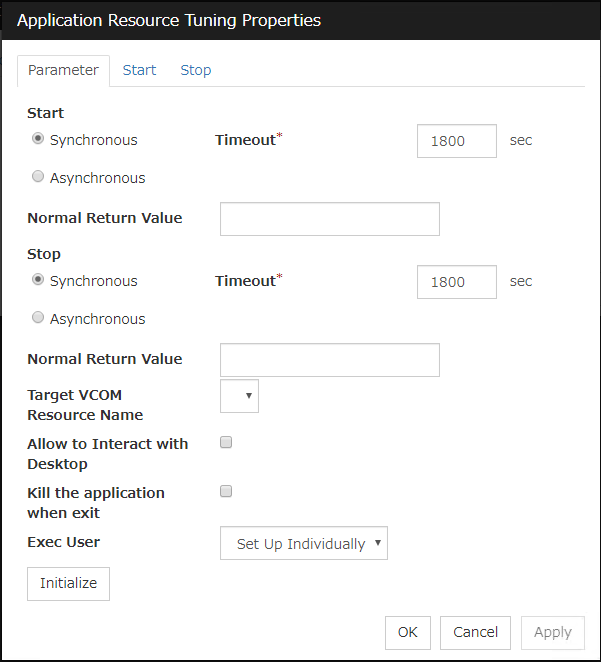
Application Resource Tuning Properties
Parameter tab
Detailed parameter settings are displayed on this tab.Synchronous (Start)
This setting is not available for a resident application.If the application is non-resident, select this to wait for the application to stop when it is run.Asynchronous (Start)
This setting is not available for a resident application.If the application is non-resident, select this so as not to wait for the application to stop when it is run.Normal Return Value (Start) (Within 1023 bytes)
This entry field cannot be enterd when Asynchronous is selected.Specify what error code returned from the executable file set by Start Path is normal when Resident Type is Non-resident.
Values can be separated by commas (for example, 0, 2, 3).
Values can be specified using a hyphen (for example, 0-3).
Note
In case that a batch file is specified as the executable file, an error cannot be detected when 1 is specified as Normal Return Value because 1 is returned when an error occurs with cmd.exe which executes the batch file.
Synchronous (Stop)
If the application is resident, and the stop path is not specified, select this to wait for the currently running application to stop. If the application is resident, and the stop path is specified, select this to wait for the application specified for the stop path to stop.If the application is non-resident, select this to wait for the application to stop when it is run.Asynchronous (Stop)
If the application is resident, select this so as not to wait for the currently running application or the application specified for the stop path to stop.If the application is non-resident, select this so as not to wait for the application to stop when it is run.Normal Return Value (Stop) (Within 1023 bytes)
This entry field cannot be enterd when Asynchronous is selected.Specify what error code returned from the executable file set by Stop Path is normal when Resident Type is Non-resident.
Values can be separated by commas (for example, 0, 2, 3).
Values can be specified using a hyphen (for example, 0-3).
Note
In case that a batch file is specified as the executable file, an error cannot be detected when 1 is specified as Normal Return Value because 1 is returned when an error occurs with cmd.exe which executes the batch file.
Timeout (Start) (1 to 9999)
This setting is not available for a resident application.Configure the timeout value to wait (synchronous) for a non-resident application to stop when the application is run. A value can be entered only when Synchronous is selected. If the application does not stop within the timeout value set here, it is considered as an error.Timeout (Stop) (1 to 9999)
For a resident application, configure the timeout value to wait (Synchronous) for the currently running application or the application specified for the stop path to stop.Configure the timeout value to wait (synchronous) for currently running resident application(s) to stop or for a non-resident application to stop when the application is run.The timeout value can be set only when Synchronous is selected. If the application does not stop within the timeout value set here, it is considered as an error.Target VCOM Resource Name
Not used.
Allow to Interact with the Desktop
Specify whether to allow the application to be run to interact with desktop. If this is selected, the application screen is displayed on the desktop when the application starts running.
Kill the application when exit
Specify whether or not to forcibly terminate the application as termination of deactivation. If this is selected, the application is forcibly terminated instead of normal termination. This is effective only when Resident Type is set to Resident and the stop path is not specified.
Exec User
Specify a user who executes the application. The user can be selected from the users registered in the Account tab of Cluster Properties.With Set Up Individually specified, the settings of the user in the Start and Stop tabs are applied.With any value other than Set Up Individually specified, the settings in the Start and Stop tabs are not used: Those of the user specified for this parameter are applied.Initialize
Click Initialize to reset the values of all items to their default values.
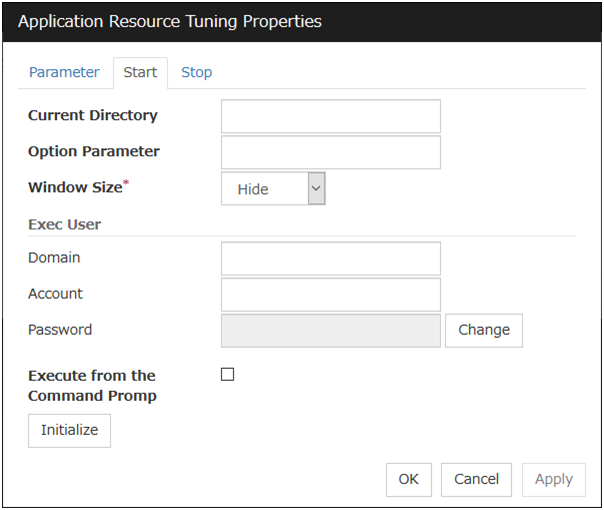
Start and Stop tabs
A detailed setting for starting and stopping the application is displayed.Current Directory (Within 1023 bytes)
Specify a directory for running the application.
Option Parameter (Within 1023 bytes)
Enter parameters to be entered for the application. If there are multiple parameters, delimit parameters with spaces. For a parameter that includes a space, enclose the parameter with double quotation marks.Example: "param 1" param2Window Size
Select the size of the window for running the application from the following:
Exec User Domain
Specify the domain of a user account that runs the application.In the case of Stop tab, it is unnecessary to stop and/or resume the group.Exec User Account
Specify the user account that runs the application.In the case of Stop tab, it is unnecessary to stop and/or resume the group.Exec User Password
Specify the password for the user account that runs the application.In the case of Stop tab, it is unnecessary to stop and/or resume the group.Execute from the Command Prompt
Specify whether to run the application from the command prompt (cmd.exe). Specify this when running an application (such as JavaScript and VBScript) whose extension is other than exe, cmd, or bat.
Initialize
Click Initialize to reset the values of all items to their default values.
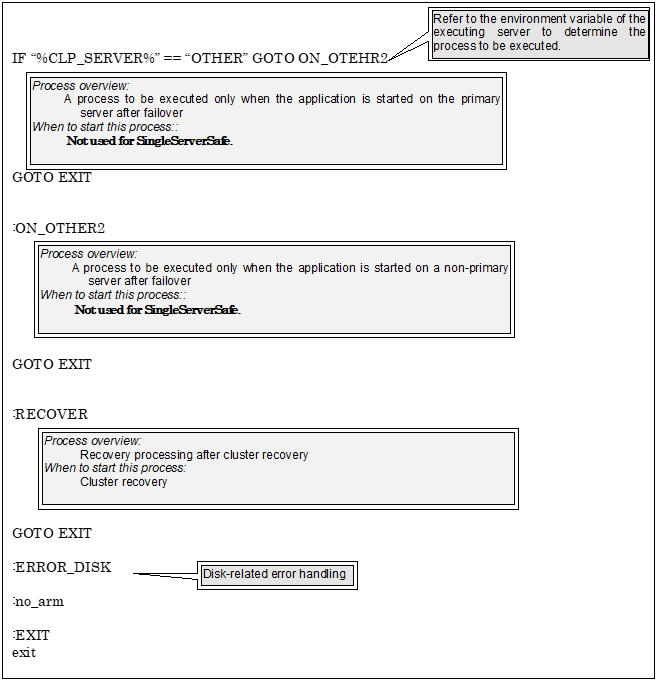
4.3. Setting up script resources
Group A start script: a sample of stop.bat
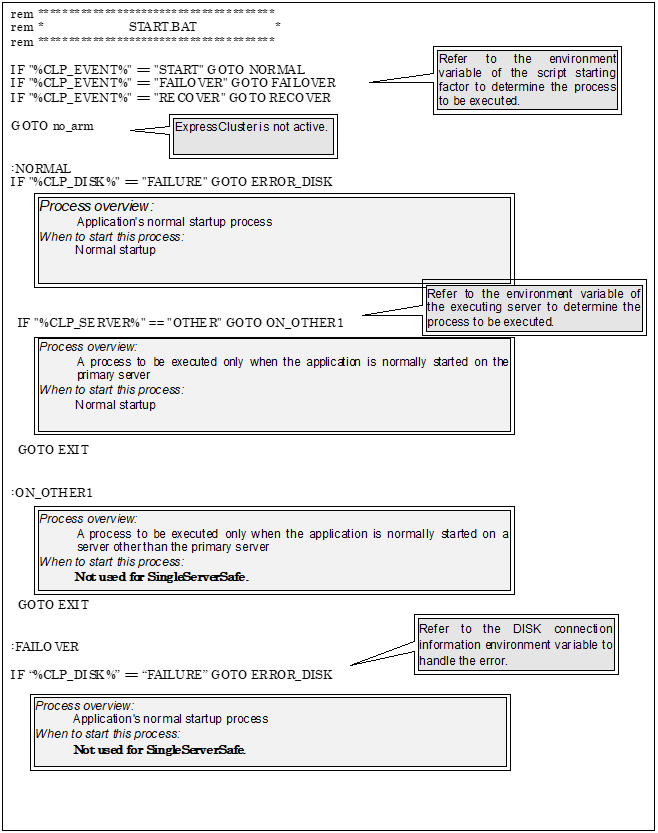
Group A stop script: a sample of stop.sh
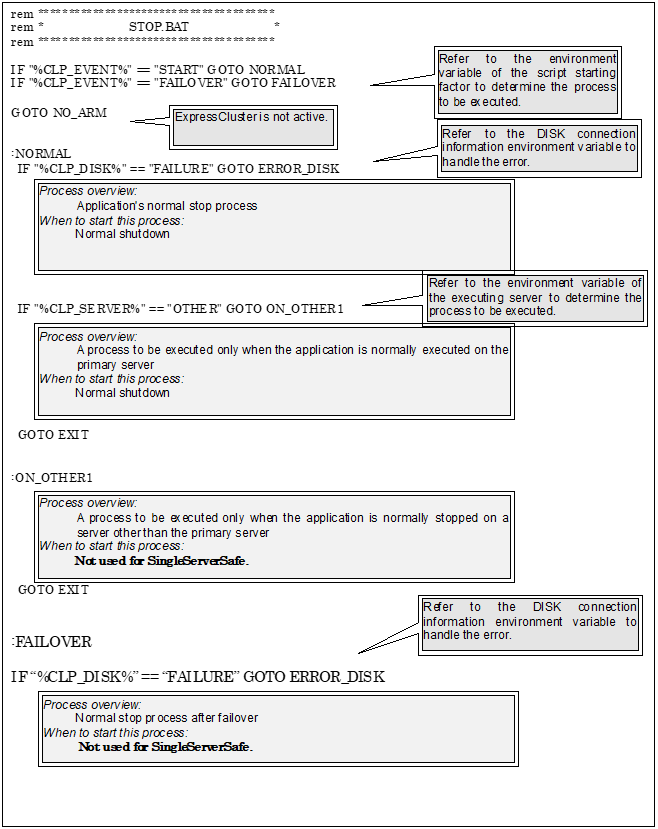
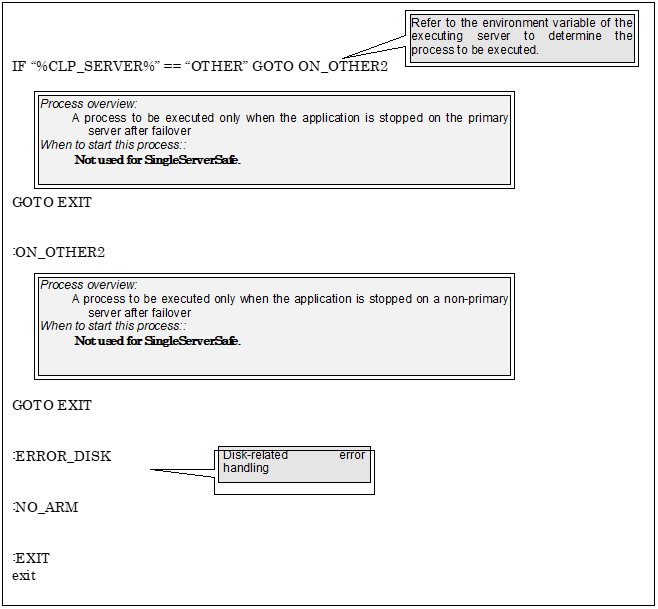
4.3.1. Tips for creating scripts
The clplogcmd command, though which message output on the alert log is possible, is available.
4.3.2. Notes on script resources
Stop the processing by using the exit command in the script activated through the start command, when the start command is used in the start/stop script.
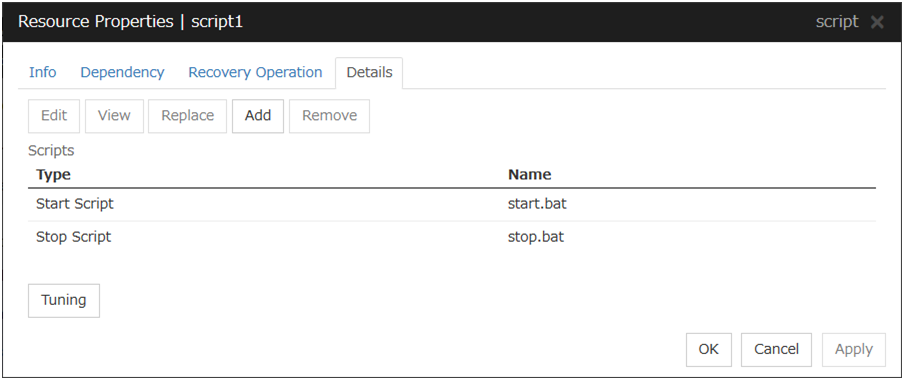
4.3.3. Details tab
The default script file names, start.bat and stop.bat, are listed on Scripts.
Add
Use this button to add a script other than start.bat script and stop.bat script.
Note
Do not use 2-byte characters for the name of a script to be added.Do not use "& (ampersand)" nor "= (equal mark)" for the name of a script to be added.Remove
Use this button to delete a script. The start.bat script and stop.bat script cannot be deleted.
View
Use this button to display the selected script file. You cannot display the script file if it is currently displayed or edited.
Edit
Use this button to edit the selected script file. Click Save to apply the change. You cannot modify the name of the script file.
Replace
Opens the Open dialog box, where you can select a file.
Note
The file will not be deleted even if you delete a script file from the Cluster WebUI. If the cluster configuration data is reloaded by restarting the Cluster WebUI after deleting the script file, the deleted script file will be displayed in the Scripts.
The content of the script file selected in the Resource Properties is replaced with the one selected in the Open dialog box. You cannot replace the script file if it is currently displayed or edited. Select a script file only. Do not select binary files (applications), and so on.
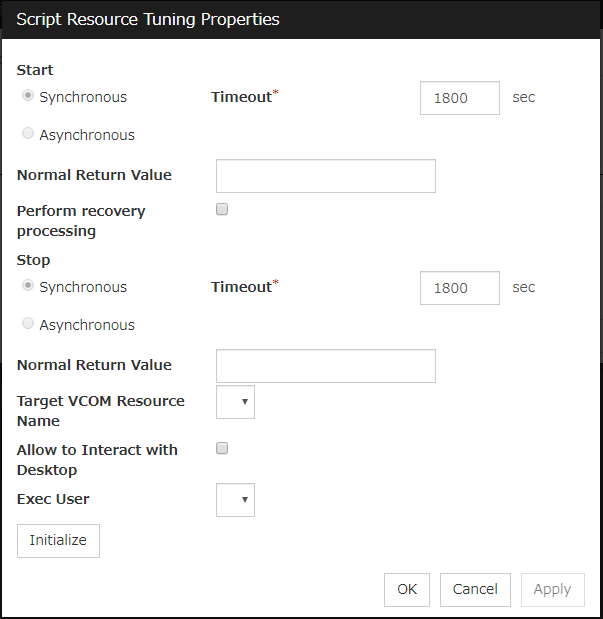
Tuning
Open the Script Resource Tuning Properties dialog box. You can make advanced settings for the script resource.
Script Resource Tuning Properties
Parameter tab
Detailed parameter settings are displayed on this tab.
Common to all start scripts and stop scripts
Synchronous
Select this button to wait for a script to end when it is run.
Asynchronous
This cannot be selected.
Normal Return Value
Configure what error code from the script is normal.
Values can be separated by commas (for example, 0, 2, 3).
Values can be specified using a hyphen (for example, 0-3).
Note
When specifying a value to Normal Return Value, set the same value to start script and stop script.An error cannot be detected when 1 is specified as Normal Return Value because 1 is returned when an error occurs with cmd.exe which executes the script.Perform recovery processing
Specify whether to run a start script or not in any of the following timings:
When the server is recovered
When a monitor resource/ARMLOAD command error is detected
When the group resource activation terminates due to an error
When executed as the recovery operation, RECOVER is set for CLP_EVENT, the environment variable.
Timeout (1 to 9999)
When you want to wait for a script to end (when selecting Synchronous), specify how many seconds you want to wait before a timeout. This box is enabled when Synchronous is selected. If the script does not complete within the specified time, it is determined as an error.
Target VCOM Resource Name
Not used.
Allow to Interact with Desktop
Specify whether to allow the script to be run to communicate with desktop. If this is selected, progress status of the script can be checked on the screen. It is effective if used when debugging the script.
Exec User
Specify a user who executes the script. The user can be selected from the users registered in the Account tab of Cluster Properties.If no user is specified, the script is run by the local system account.Initialize
Click Initialize to reset the values of all items to their default values.
4.4. Setting up service resources
4.4.1. Notes on service resources
Generally, the service executed by the service resource is set to manual start. In case of the service which is exexuted by automatic start or the service which may be executed by other than the service resource, it is necessary to check on Do not assume it as an error when the service is already started which is described below in Service tab of Service resource tuning properties. If this check box is off, activation fails when executing service start processing by the service resource to the service which has already been executed.
- The service executed by the service resource is not controlled by applications other than EXPRESSCLUSTER. Therefore, it is recommended to set the recovery operation not to be performed by the service control manager.If a service is set to restart upon the recovery operation by the service control manager, an unexpected action might be performed due to duplication with the recovery operation by EXPRESSCLUSTER.
4.4.2. Details tab
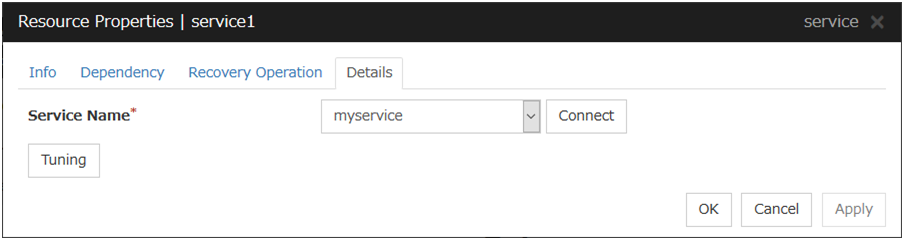
Service Name (within 1023 bytes)
Specify the service name or service display name used in the service resource.Combo box options display the list of the service display names of the services collected from the server.
Connect
Collects the service list from the server and updates the service display name list to be displayed in the Service Name combo box.
Tuning
Open the Service Resource Tuning Properties dialog box. You can make advanced settings for the service resource.
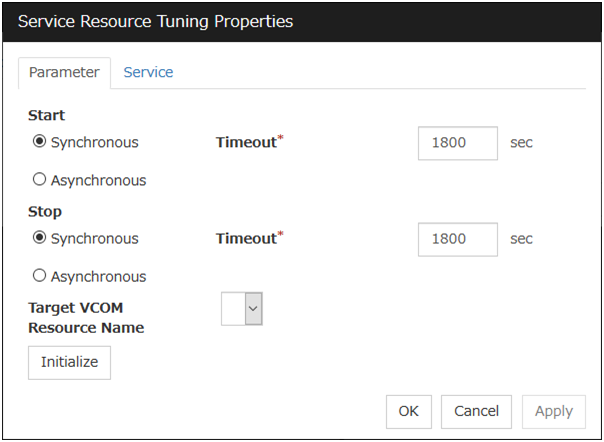
Service Resource Tuning Properties
Parameter tab
Detailed parameter settings are displayed on this tab.Synchronous
When the service is started up, it waits for "Started." Typically, the status changes from "Stopping" to "Started" when the service is started.When stopping the service, it waits for that the status of service becomes "Stopped." Typically, the status changes from "Stopping" to "Stopped" when the service is stopped.Asynchronous
No synchronization is performed.
Timeout (1 to 9999)
Specify the timeout for the status of the service to become "Started" at the time starting the service. The timeout can be specified only when Synchronous is selected. If the status of the service does not change to "Started" within the timeout, it is determined as an error.Specify the timeout for the stats of the service to become "Stopped" at the time stopping the service. The timeout can be specified only when Synchronous is selected. If the status of the service does not change to "Stopped" within the timeout, it is determined as an error.Target VCOM Resource Name
Not used.
Initialize
Click Initialize to reset the values of all items to their default values.
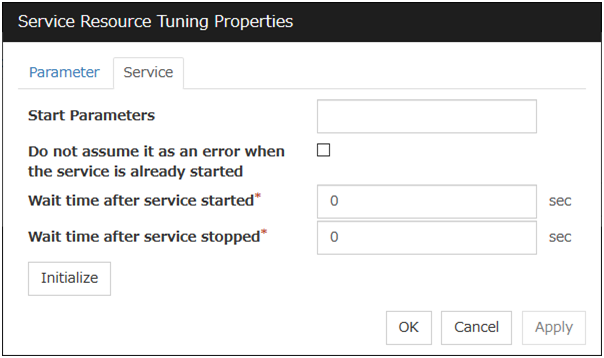
Service tab
The settings for the service are displayed.Start Parameters (Within 1023 bytes)
Specify a parameter for the service. When there are multiple parameters, leave a space between parameters. For a parameter that includes a space, enclose the parameter by double quotation marks. Note that backslash \ cannot be used.Example: "param 1" param2Do not assume it as an error when the service is already started
Wait after the service is started (0 to 9999)
Specify the time to wait after the service is started.The service resource activation will be completed after waiting for the specified time.Wait after the service is stopped (0 to 9999)
Specify the time to wait after the service is stopped.The service resource deactivation will be completed after waiting for the specified time.Initialize
Click Initialize to reset the values of all items to their default values.
4.5. Setting up VM resources
VM resources control virtual machines set up on the following virtualization platform:
4.5.1. Notes on VM resources
A VM resource can be registered with a group for which the group type is virtual machine.
Only one VM resource can be registered per group.
VM resources are effective when EXPRESSCLUSTER is installed on host OS of virtual infrastructure (Hyper-V).
If VM resources are stopped, the VM is deleted from Hyper-V manager.
4.5.2. Details tab
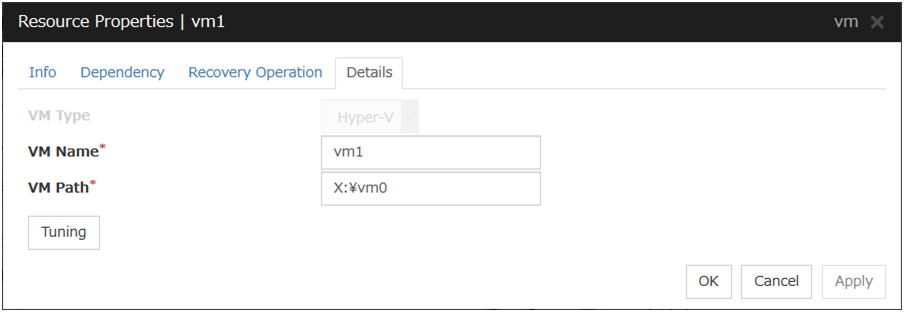
VM Type
Specify the virtualization platform on which the virtual machine is set up. Currently, only Hyper-V is supported.
VM Name
Enter the virtual machine name displayed in the Hyper-V Manager.
VM Path
Enter the path of the virtual machine configuration file.
Tuning
This displays the Virtual Machine Resource Tuning Properties dialog box. Specify detailed settings for the VM resource.
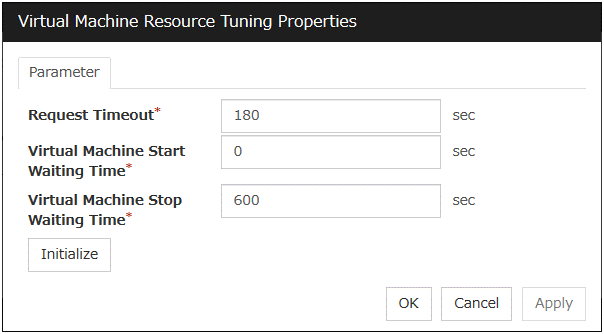
Virtual Machine Resource Tuning Properties
Parameter tab
Detailed settings for the parameters are displayed.
Request Timeout
Specify how long the system waits for completion of a request such as to start or stop a virtual machine.If the request is not completed within this time, a timeout occurs and resource activation or deactivation fails.Virtual Machine Start Waiting Time
Specify the wait time to wait for the startup completion of the guest OS on the virtual machine and the application after the request to the virtual machine to start up completes and the status of the virtual machine becomes running at the resource activation.
Virtual Machine Stop Waiting Time
Specify the wait time for the shutdown of the guest OS on the virtual machine at the resource deactivation.
Initialize Values
Clicking Initialize Values sets the values of all the items to the defaults.
5. Monitor resource details
This chapter provides details about monitor resources. A monitor resource is the unit used when EXPRESSCLUSTER X SingleServerSafe performs monitoring.
EXPRESSCLUSTER X SingleServerSafe uses windows common to those of the clustering software EXPRESSCLUSTER X to ensure high compatibility with EXPRESSCLUSTER X in terms of operation and other aspects.
This chapter covers:
5.1. Monitor resources
The following resources can be defined as monitor resources:
Monitor resource name
|
Function
|
Monitor Timing:
(Default values are shown in bold.)
|
Target Resource:
|
|---|---|---|---|
Application monitor resource |
Monitors application resources. |
When activated (Fixed) |
appli |
Service monitor resource |
Monitors service resources. |
When activated (Fixed) |
service |
Disk RW monitor resource |
Monitors disk devices by writing dummy data to the file system. |
Always or when activated |
All resources |
IP monitor resource |
Monitors IP addresses and communication paths by using the ping command and checking whether there is a response . |
Always or when activated |
All resources |
NIC Link Up/Down monitor resource |
Acquires the NIC link status to monitor whether the link is up or down. |
Always or when activated |
All resources |
Custom monitor resource |
Performs monitoring by executing any script. |
Always or when activated |
All resources |
Multi target monitor resource |
Performs monitoring by using multiple monitor resources in combination. |
When activated (Fixed) |
All resources |
Message receive monitor resource |
Specifies the action to take when an error message is received and how the message is displayed on the Cluster WebUI. |
Always (Fixed) |
None |
VM monitor resource |
Provides a mechanism for monitoring a virtual machine started by a VM resource. |
When activated (Fixed) |
vm |
Process Name monitor resource |
Monitors monitor the process of specified processes. |
Always or when activated |
All resources |
DB2 monitor resource |
Provides a mechanism for monitoring an IBM DB2 database. |
When activated (Fixed) |
All resources |
FTP monitor resource |
Provides a mechanism for monitoring an FTP server. |
When activated (Fixed) |
All resources |
HTTP monitor resource |
Provides a mechanism for monitoring an HTTP server. |
When activated (Fixed) |
All resources |
IMAP4 monitor resource |
Provides a mechanism for monitoring an IMAP server. |
When activated (Fixed) |
All resources |
ODBC monitor resource |
Provides a mechanism for monitoring an ODBC accessible database. |
When activated (Fixed) |
All resources |
Oracle monitor resource |
Provides a mechanism for monitoring an Oracle database. |
When activated (Fixed) |
All resources |
POP3 monitor resource |
Provides a mechanism for monitoring a POP server. |
When activated (Fixed) |
All resources |
PostgreSQL monitor resource |
Provides a mechanism for monitoring a PostgreSQL database. |
When activated (Fixed) |
All resources |
SMTP monitor resource |
Provides a mechanism for monitoring an SMTP server. |
When activated (Fixed) |
All resources |
SQL Server monitor resource |
Provides a mechanism for monitoring an SQL server database. |
When activated (Fixed) |
All resources |
Tuxedo monitor resource |
Provides a mechanism for monitoring a Tuxedo application server. |
When activated (Fixed) |
All resources |
Weblogic monitor resource |
Provides a mechanism for monitoring a WebLogic application server. |
When activated (Fixed) |
All resources |
WebOTX monitor resource |
Provides a mechanism for monitoring a WebOTX application server. |
When activated (Fixed) |
All resources |
Websphere monitor resource |
Provides a mechanism for monitoring a WebSphere application server. |
When activated (Fixed) |
All resources |
JVM monitor resources |
Provides a mechanism for monitoring a Java VM. |
Always or when activated |
All resources |
System monitor resources |
Provides a mechanism for monitoring a System Resource. |
Always (Fixed) |
All resources |
Process resource monitor resources |
Provides a mechanism for monitoring process resources. |
Always (Fixed) |
All resources |
User mode monitor resource |
Provides a mechanism for monitoring any user space stalls. |
Always (Fixed) |
None |
5.1.1. Monitor resources that require a license
Optional product name |
Monitor resource name |
|---|---|
EXPRESSCLUSTER X Database Agent 4.2 for Windows |
DB2 monitor resources |
ODBC monitor resources |
|
Oracle monitor resources |
|
PostgreSQL monitor resources |
|
SQL Server monitor resources |
|
EXPRESSCLUSTER X Internet Server Agent 4.2 for Windows |
FTP monitor resources |
HTTP monitor resources |
|
IMAP4 monitor resources |
|
POP3 monitor resources |
|
SMTP monitor resources |
|
EXPRESSCLUSTER X Application Server Agent 4.2 for Windows |
Tuxedo monitor resources |
Websphere monitor resources |
|
Weblogic monitor resources |
|
WebOTX monitor resources |
|
EXPRESSCLUSTER X Java Resource Agent 4.2 for Windows |
JVM monitor resources |
EXPRESSCLUSTER X System Resource Agent 4.2 for Windows |
System monitor resources |
Process resource monitor resources |
For the procedure for registering a license, see the "Installation Guide".
5.1.2. Applications supported by monitoring options
The following applications are the target monitoring options that are supported.
x86_64 version
Monitor resource
|
Application to be monitored
|
EXPRESSCLUSTER
Version
|
Remarks
|
|---|---|---|---|
Oracle monitor |
Oracle Database 12c Release 1 (12.1) |
12.00 or later |
|
Oracle Database 12c Release 2 (12.2) |
12.00 or later |
||
Oracle Database 18c (18.3) |
12.10 or later |
||
Oracle Database 19c (19.3) |
12.10 or later |
||
DB2 monitor |
DB2 V10.5 |
12.00 or later |
|
DB2 V11.1 |
12.00 or later |
||
DB2 V11.5 |
12.20 or later |
||
PostgreSQL monitor |
PostgreSQL 9.3 |
12.00 or later |
|
PostgreSQL 9.4 |
12.00 or later |
||
PostgreSQL 9.5 |
12.00 or later |
||
PostgreSQL 9.6 |
12.00 or later |
||
PostgreSQL 10 |
12.00 or later |
||
PostgreSQL 11 |
12.10 or later |
||
PostgreSQL 12 |
12.22 or later |
||
PowerGres on Windows V9.1 |
12.00 or later |
||
PowerGres on Windows V9.4 |
12.00 or later |
||
PowerGres on Windows V9.6 |
12.00 or later |
||
PowerGres on Windows V11 |
12.10 or later |
||
SQL Server monitor |
SQL Server 2014 |
12.00 or later |
|
SQL Server 2016 |
12.00 or later |
||
SQL Server 2017 |
12.00 or later |
||
SQL Server 2019 |
12.20 or later |
||
Tuxedo monitor |
Tuxedo 12c Release 2 (12.1.3) |
12.00 or later |
|
Weblogic monitor |
WebLogic Server 11g R1 |
12.00 or later |
|
WebLogic Server 11g R2 |
12.00 or later |
||
WebLogic Server 12c R2 (12.2.1) |
12.00 or later |
||
Websphere monitor |
WebSphere Application Server 8.5 |
12.00 or later |
|
WebSphere Application Server 8.5.5 |
12.00 or later |
||
WebSphere Application Server 9.0 |
12.00 or later |
||
WebOTX monitor |
WebOTX Application Server V9.1 |
12.00 or later |
|
WebOTX Application Server V9.2 |
12.00 or later |
||
WebOTX Application Server V9.3 |
12.00 or later |
||
WebOTX Application Server V9.4 |
12.00 or later |
||
WebOTX Application Server V9.5 |
12.00 or later |
||
WebOTX Application Server V10.1 |
12.00 or later |
||
JVM monitor |
WebLogic Server 11g R1 |
12.00 or later |
|
WebLogic Server 12c R2 (12.2.1) |
12.00 or later |
||
WebOTX Application Server V9.1 |
12.00 or later |
||
WebOTX Application Server V9.2 |
12.00 or later |
||
WebOTX Application Server V9.3 |
12.00 or later |
||
WebOTX Application Server V9.4 |
12.00 or later |
||
WebOTX Application Server V9.5 |
12.00 or later |
||
WebOTX Application Server V10.1 |
12.00 or later |
||
WebOTX Enterprise Service Bus V8.4 |
12.00 or later |
||
WebOTX Enterprise Service Bus V8.5 |
12.00 or later |
||
Apache Tomcat 8.5 |
12.00 or later |
||
Apache Tomcat 9.0 |
12.00 or later |
||
WebSAM SVF for PDF 9.1 |
12.00 or later |
||
WebSAM SVF for PDF 9.2 |
12.00 or later |
||
WebSAM Report Director Enterprise 9.1 |
12.00 or later |
||
WebSAM Report Director Enterprise 9.2 |
12.00 or later |
||
WebSAM Universal Connect/X 9.1 |
12.00 or later |
||
WebSAM Universal Connect/X 9.2 |
12.00 or later |
||
System monitor |
N/A |
12.00 or later |
|
Process resource monitor |
N/A |
12.10 or later |
5.2. Monitor resource properties
5.2.1. Info tab
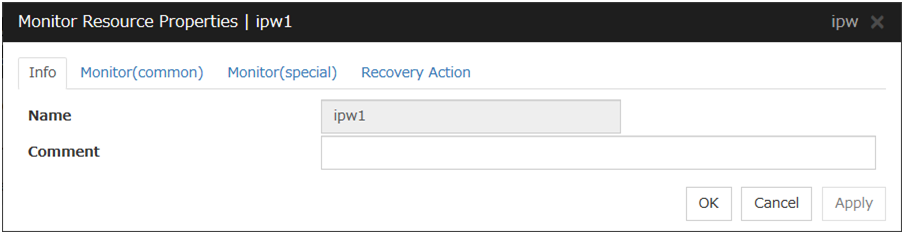
Name
The monitor resource name is displayed.
Comment (Within 127 bytes)
Enter a comment for the monitor resource. Use only one-byte alphabets and numbers.
5.2.2. Monitor (common) tab
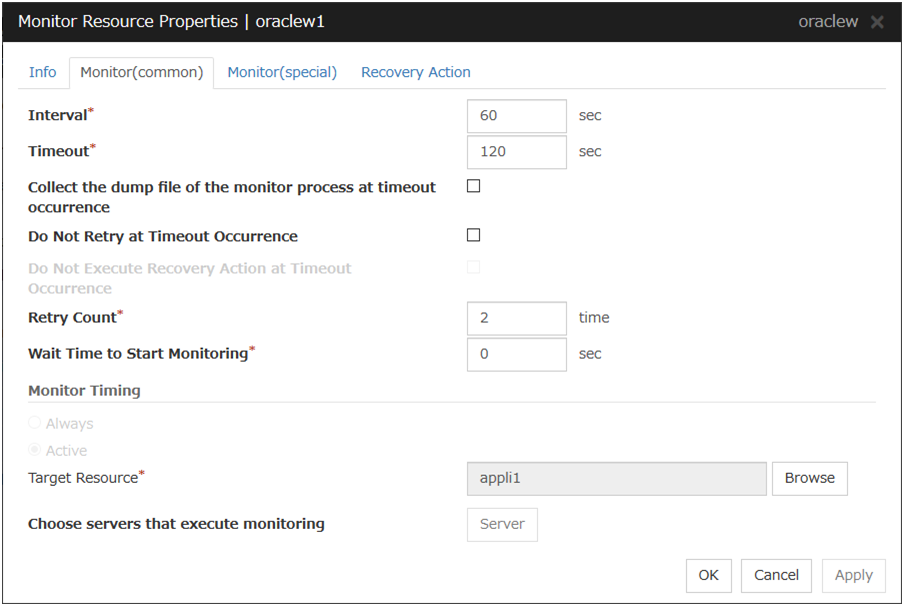
Interval (1 to 999)
Specify the interval to check the status of monitor target.
Timeout (5 to 999)
When the normal status cannot be detected within the time specified here, the status is determined to be error.
Collect the dump file of the monitor process at timeout occurrence (for Oracle monitor resource only)
Specify whether collecting the dump file of the EXPRESSCLUSTER monitoring process when time out occurs. This item is not displayed with the monitor resource which has no dump collecting function.The collected dump file is saved inwork\rm\resource name\errinfo.curfolder under EXPRESSCLUSTER install folder. When collection is executed more than once, the folder names of the past collection information are renamed as errinfo.1, errinfo.2. And the folders are saved by 5 generations from the latest information.
Do Not Retry at Timeout Occurrence
When this function is enabled, recovery action is executed immediately if a monitor resource timeout occurs.
Do not Execute Recovery Action at Timeout Occurrence
When this function is enabled, recovery action is not executed if a monitor resource timeout occurs.This can be set only when the Do Not Retry at Timeout Occurrence function is enabled.Note
For the following monitor resources, the Do Not Retry at Timeout Occurrence and Do Not Execute Recovery Action at Timeout Occurrence functions cannot be set.
Custom monitor resource (only when Monitor Type is Asynchronous)
multi target monitor resource
message receive monitor resource
VM monitor resource
JVM monitor resource
System monitor resource
Process resource monitor resource
User mode monitor resource
Retry Count (0 to 999)
Specify how many times an error should be detected in a row after the first one is detected before the status is determined as error.If you set this to zero (0), the status is determined as error at the first detection of an error.
Wait Time to Start Monitoring (0 to 9999)
Set the wait time to start monitoring.
Monitor Timing:
Set the monitoring timing.
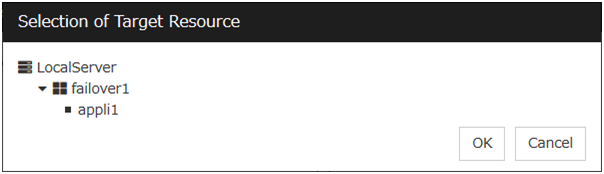
Target Resource:
The resource which will be monitored while activated is shown.
Browse
Click this button to open the dialog box to select the target resource. Server names and resource names are displayed in a tree. Select the target resource, and then click OK.
Choose servers that execute monitoring
Not used.
5.2.3. Monitor (special) tab
Some monitor resources require the parameters at the monitoring operaion to be configured. The parameters are described in the explanation part about each resource.
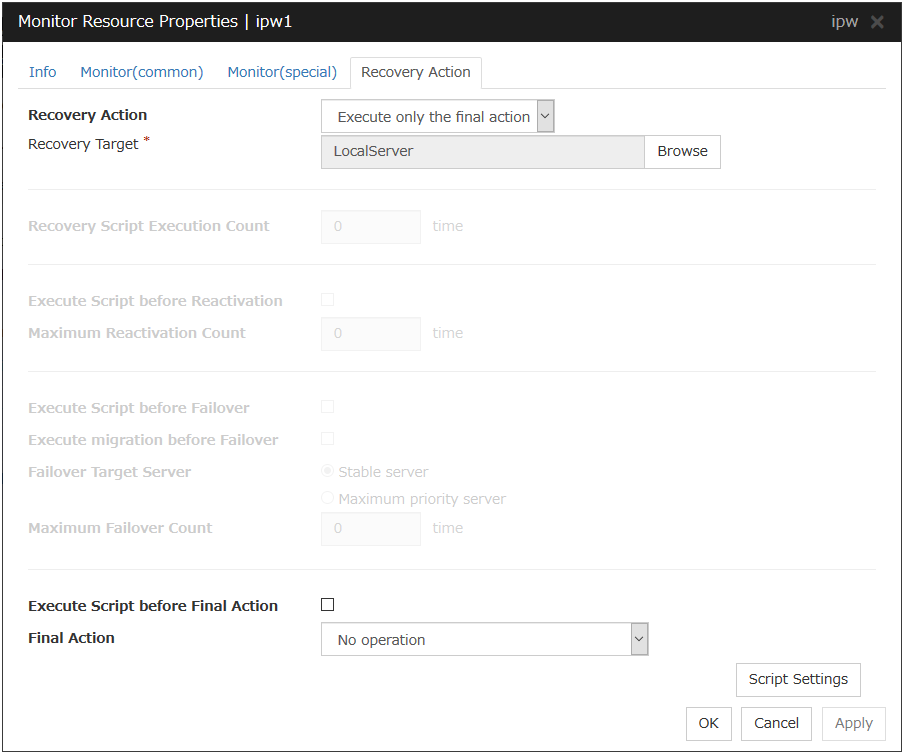
5.2.4. Recovery Action tab
Ordinary monitor resource (except Message Receive Monitor resource)
Message Receive Monitor
In this dialog box, you can configure the recovery target and an action to be taken at the time when an error is detected. By setting this, it allows failover of the group, restart of the resource or the group when an error is detected. However, recovery will not occur if the recovery target is not activated.
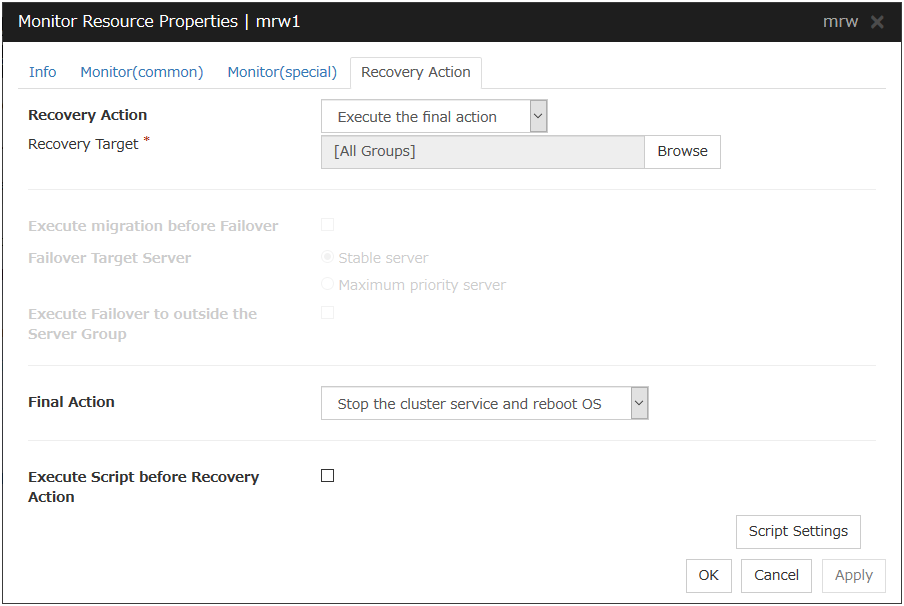
Recovery Action
Specify the operation to perform when an error is detected.
Recovery Target
This field displays the object of the target to be recovered upon detection of an error.
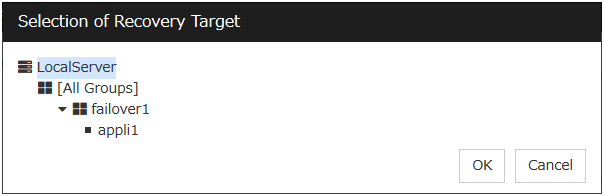
Browse
Click this button to open the dialog box in which you can select the target resource. LocalServer, All Groups, and the group names and resource names that are registered in the cluster are shown in a tree view. Select the target resource and click OK.
Recovery Script Execution Count (0 to 99)
Specify the number of times to allow execution of the script configured by Script Settings when an error is detected. If this is set to zero (0), the script does not run.
Execute Script before Reactivation
Specify whether to run the script before reactivation.
Maximum Reactivation Count (0 to 99)
When Custom is selected for Recovery Action, specify the maximum number of times the recovery target is to be reactivated. If this is set to zero (0), no reactivation is executed. For Message Receive Monitor resource, this parameter can not be set.
Execute Script before Failover
Not used.
Execute migration before failing over
Not used.
Failover Target Server:
Not used.
Maximum Failover Count
Not used.
Execute Script before Final Action
Select whether script is run or not before executing final action.
Execute Script before Recovery Action
Select whether script is run or not before executing recovery action.This can be set only for a message receive monitor resource.
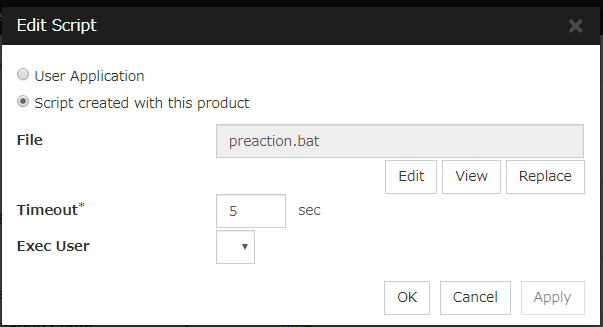
Script Settings
Click here to display the Edit Script dialog box. Set the recovery script/command.
User Application
Use an executable file (executable batch file or execution file) on the server as a script. For the file name, specify an absolute path or name of the executable file of the local disk on the server. If you specify only the name of the executable file, you must configure the path with environment variable in advance. If there is any blank in the absolute path or the file name, put them in double quotation marks (" ") as follows.
Example:
"C:\Program Files\script.bat"If you want to execute VBScript, enter a command and VBScript file name as follows.
Example:
cscript script.vbsEach executable file is not included in the cluster configuration information of the Cluster WebUI. They must be prepared on each server since they cannot be edited or uploaded by the Cluster WebUI.
Script created with this product
Use a script file which is prepared by the Cluster WebUI as a script. You can edit the script file with the Cluster WebUI if you need. The script file is included in the cluster configuration information.
File (Within 1023 bytes)
Specify a script to be executed (executable batch file or execution file) when you select User Application.
View
Click here to display the script file when you select Script created with this product.
Edit
Click here to edit the script file when you select Script created with this product. Click Save to apply the change. You cannot modify the name of the script file.
Replace
Click here to replace the contents of a script file with the contents of the script file which you selected in the file selection dialog box when you select Script created with this product. You cannot replace the script file if it is currently displayed or edited. Select a script file only. Do not select binary files (applications), and so on.
Timeout (1 to 9999)
Specify the maximum time to wait for completion of script to be executed. The default value is set as 5.
Exec User
Specify a user who executes the script. The user can be selected from the users registered in the Account tab of Cluster Properties.If no user is specified, the script is run by the local system account.
Final Action
Select the recovery action to perform after a recovery attempt through reactivation fails.Select the final action from the following:
Note
Use No Operation to:
Suppress the final action temporarily
Show only alerts on detection of an error
Take the final action practically with multi-target monitor resources
- Stop ResourceWhen a group resource is selected as a recovery target, the selected group resource and group resources that depend on the selected group resource are stopped.This option is disabled when "LocalServer", "All Groups", or a group is selected.
- Stop GroupWhen a group or group resource is selected as a monitor target, this option stops the group or the group that the group resource belongs. When All Groups is selected, all the groups running on the server of which a monitor resource has detected an error are stopped. This is disabled when a LocalServer is selected as a recovery target.
- Stop cluster serviceEXPRESSCLUSTER X SingleServerSafe is stopped.
- Stop cluster service and shutdown OSEXPRESSCLUSTER X SingleServerSafe is stopped, and the OS is shut down.
- Stop cluster service and reboot OSEXPRESSCLUSTER X SingleServerSafe is stopped, and the OS is rebooted.
- Generating of intentional Stop ErrorA stop error is intentionally generated for the server.
5.3. Setting up application monitor resources
Application monitor resources monitor application resources. Monitoring starts when the application resource is activated. The application resource can be monitored if it is specified as a Resident type resource.
5.3.1. Monitoring by application monitor resources
They regularly monitor whether applications are active or not. When they detect that applications do not exist, it is determined to be an error.
5.3.2. Note on application monitor resources
An application monitor resource monitors a successfully activated application resource. The application resource can be monitored if it is specified as a resident type resource.
5.4. Setting up service monitor resources
Service monitor resources monitor service resources. Monitoring starts when the service resource is activated.
5.4.1. Monitoring by service monitor resources
They regularly check the service status with the service control manager and if the status of the service resource becomes Stopped, it is considered as an error.
5.4.2. Note on service monitor resources
5.5. Setting up disk RW monitor resources
Disk RW monitor resources monitor disk devices by writing dummy data to the file system.
5.5.1. Monitoring by disk RW monitor resources
Note
If you want multipath software to initiate a path failover when a disk path is not connected, specify a longer monitoring timeout time (for which the default value is 300 seconds) for the disk RW monitor resource than the path failover time.
5.5.2. Monitor (special) tab
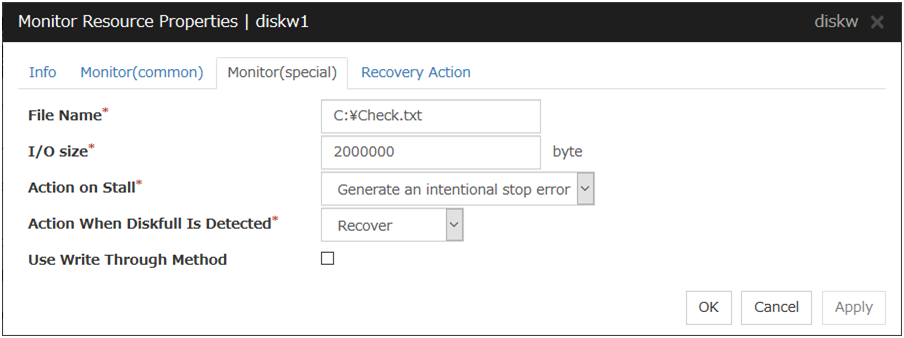
File Name (within 1023 bytes)
Enter the file name to access. This file is created upon monitoring and deleted after I/O completes.
Note
Specify an absolute path for the file name. If a relative path is specified for the file name, the disk RW monitor resource may monitor the unexpected place.
Important
Do not specify any existing file for the file name. If an existing file is specified for the file name, the data of the file is lost.
I/O size (1 to 9999999; default: 2000000)
Specify the I/O size for the disk to monitor.
Action on Stall
Specify the action to take when stalling is detected.Stalling is detected if I/O control is not returned from the OS within the time specified in Timeout of the Monitor (common) tab.
Action When Diskfull Is Detected
Select the action when diskfull (state in which the disk being monitored has no free space) is detected
Use Write Through Method
Applies the Write Through method to the monitor I/O method.
If the Write Through method is enabled, the error detection precision of the disk RW monitor will improve. However, the I/O load on the system may increase.
5.6. Setting up IP monitor resources
IP monitor resource is a monitor resource which monitors IP addresses by using the ping command depending on whether there is a response or not.
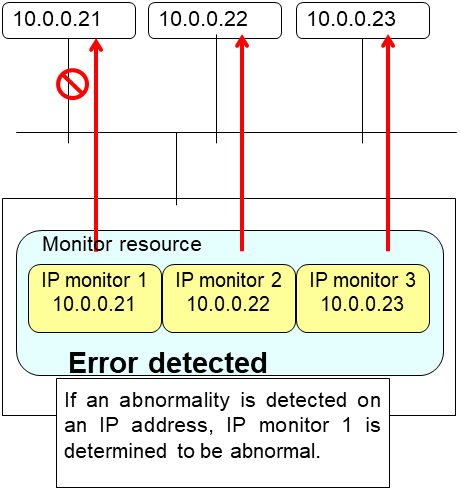
5.6.1. Monitoring by IP monitor resources
IP monitor resource monitors specified IP addresses by using the ping command. If all IP addresses do not respond, the status is determined to be error.
- If you want to establish error when all of the multiple IP addresses have error, register all those IP addresses with one IP monitor resource.
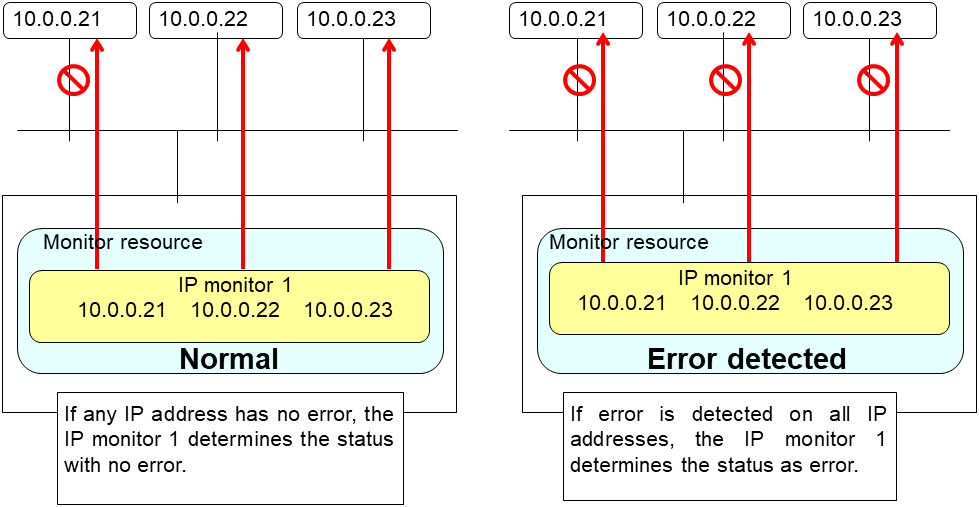
- If you want to establish error when any one of IP addresses has an error, create one IP monitor resource for each IP address.
5.6.2. Monitor (special) tab
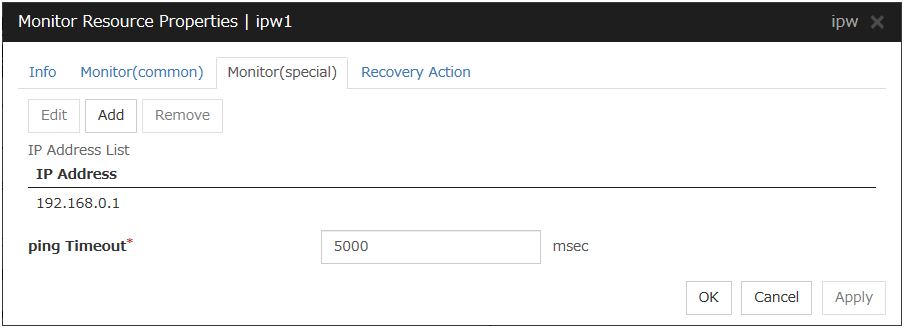
Add
Click Add to add an IP address to be monitored. Click Edit to display the IP Address Settings dialog box.
Remove
Click Remove to remove an IP address selected in IP Addresses from the list so that it will no longer be monitored.
Edit
Click Edit to display the IP Address Settings dialog box. The dialog box shows the IP address selected in IP Addresses on the Parameter tab. Edit the IP address, and then click OK.
Ping Timeout (1 to 999,999; default: 1,000)
Specify the timeout of the ping to be sent to monitor the IP address in milliseconds.
IP Address Settings
The detailed setting for interface is displayed.
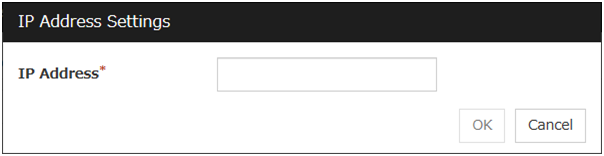
IP Address (within 255 bytes)
Enter an IP address to be monitored in this field, and then click OK. Enter an IP address that is always available for communication.
5.7. Setting up NIC link up/down monitor resources
The NIC Link Up/Down monitor resource obtains the information on how the specified NIC is linked and monitors the linkage is up or down by using WMI.
5.7.1. Configuration and range of NIC link up/down monitoring
- When you are monitoring any NIC directly connected to another server by using a LAN cable, an error is detected if the other server goes down (because a link cannot be established).The recovery action to be taken at detection of error should be configured with the appropriate value.For example, if you select Stop cluster service and reboot OS, the OS will be restarted an endless number of times.
5.7.2. Monitor (special) tab
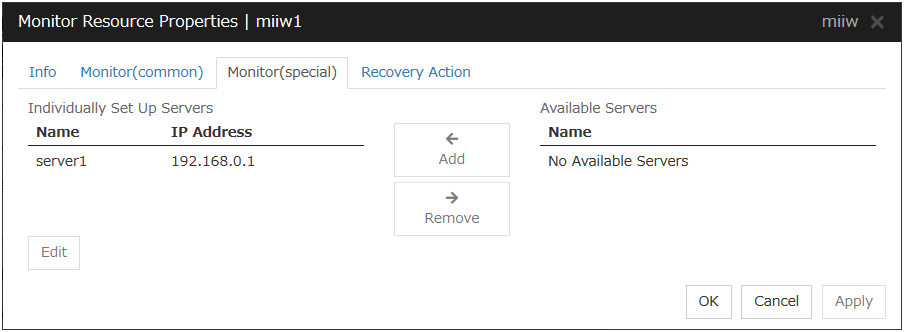
Add
Add the server to be monitored to the list of monitoring servers. Click Edit to display the IP Address Settings dialog box.
Remove
Delete the server to be monitored from the list of monitoring servers.
Edit
Edit the IP address of the NIC of the server to be monitored.
IP Address Settings
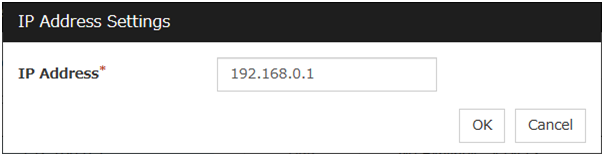
IP Address (within 47 bytes)
Specify the IP address of the NIC to be monitored.
5.8. Setting up custom monitor resources
Custom monitor resources monitor system by executing an arbitrary script.
5.8.1. Monitoring by custom monitor resources
5.8.2. Note on custom monitor resources
When a command for outputting a message (standard output, error output) in response to the prompt is executed as part of a batch file, the batch file may stop during execution of the command. Therefore, specify (perform redirection to) a file or nul as the message output destination.
When the monitor type is set to Asynchronous, configure for the timeout a larger value than the waiting time for the monitor start.
5.8.3. Monitor (special) tab
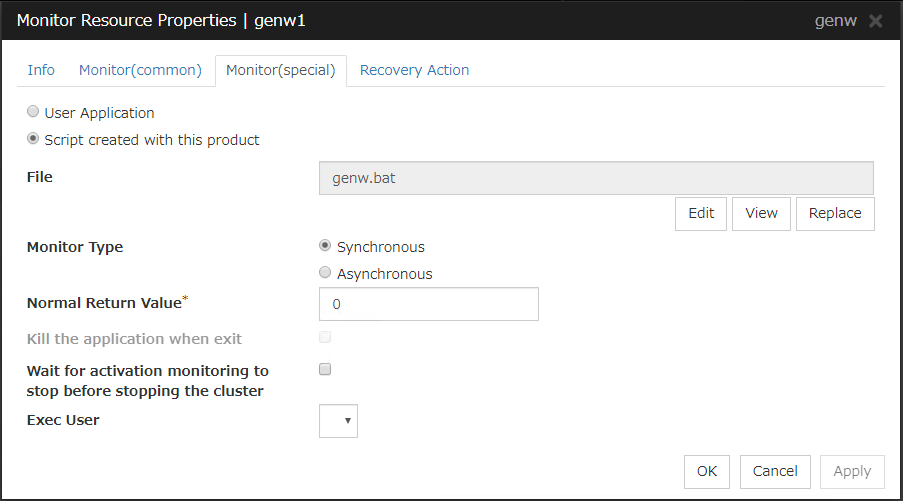
User Application
Use an executable file (executable batch file or execution file) on the server as a script. For the file name, specify an absolute path or name of the executable file of the local disk on the server.These executable files are not included in the configuration data of the Cluster WebUI. They must be prepared on the server since they cannot be edited or uploaded by the Cluster WebUI.
Script created with this product
Use a script file which is prepared by the Cluster WebUI as a script. You can edit the script file with the Cluster WebUI if you need. The script file is included in the configuration data.
File (within 1023 bytes)
Specify the script to be executed (executable shell script file or execution file) when you select User Application with its absolute path on the local disk of the server.However, no argument can be specified after the script.
View
Click here to display the script file when you select Script created with this product.
Edit
Click here to edit the script file when you select Script created with this product. Click Save to apply the change. You cannot modify the name of the script file.
Replace
Click here to replace the content of the script file with that of the script file you selected in the file selection dialog box, when Script created with this product is selected. You cannot replace the script file if it is currently displayed or edited. Select a script file only. Do not select binary files (applications), and so on.
Monitor Type
Select a monitor type.
Normal Return Value (within 1023 bytes)
When Asynchronous is selected for Monitor Type, set the values of script error code to be determined as normal. If you want to set two or more values here, separate them by commas like 0,2,3 or connect them with a hyphen to specify the range like 0-3.
Default value: 0
Forcibly Terminate Application When Stopping
Specify whether or not to forcibly terminate the application as termination of monitoring stop. If this is selected, the application is forcibly terminated instead of normal termination. This is effective only when Monitor Type is set to Asynchronous.
Exec User
Specify a user who executes the script. The user can be selected from the users registered in the Account tab of Cluster Properties.If no user is specified, the script is run by the local system account.
Wait for activation monitoring to stop before stopping the cluster
The cluster stop waits until the custom monitor resource is stopped. This is effective only when the monitoring timing is set to Active.
5.9. Setting up multi target monitor resources
The multi target monitor resource monitors more than one monitor resources.
5.9.1. Note on the multi target monitor resource
The multi target monitor resources regard the offline status of registered monitor resources as being an error. For this reason, for a monitor resource that performs monitoring when the target is active is registered, the multi target monitor resource might detect an error even when an error is not detected by the monitor resource. Do not, therefore, register monitor resources that perform monitoring when the target is active.
5.9.2. Status of the multi target monitor resource
The number of registered monitor resources 2Error Threshold 2Warning Threshold 1
The table below describes status of a multi target monitor resource:
Monitor resource1 status
(Normal
(normal))
|
Monitor resource1 status
(Error
(error))
|
Monitor resource1 status
(Offline
(offline))
|
|
|---|---|---|---|
Monitor resource2 status
(Normal
(normal))
|
Normal
(normal)
|
Caution
(caution)
|
Caution
(caution)
|
Monitor resource2 status
(Error
(error))
|
Caution
(caution)
|
Error
(error)
|
Error
(error)
|
Monitor resource2 status
(Offline
(offline))
|
Caution
(caution)
|
Error
(error)
|
Normal
(normal)
|
- Multi target monitor resource monitors status of registered monitor resources.If the number of the monitor resources with the error status exceeds the error threshold, multi target monitor resource detects an error.If the number of the monitor resources with the caution status exceeds the caution threshold, the status of the multi target monitor resource becomes caution.If all registered monitor resources are in the status of stopped (offline), the status of multi-target monitor resource becomes normal.Unless all the registered monitor resources are stopped (offline), the multi target monitor resource recognizes the stopped (offline) status of a monitor resource as error.
- If the status of a registered monitor resource becomes error, actions for the error of the monitor resource are not executed.Actions for error of the multi target monitor resource are executed only when the status of the multi target monitor resource becomes error.
5.9.3. Monitor (special) tab
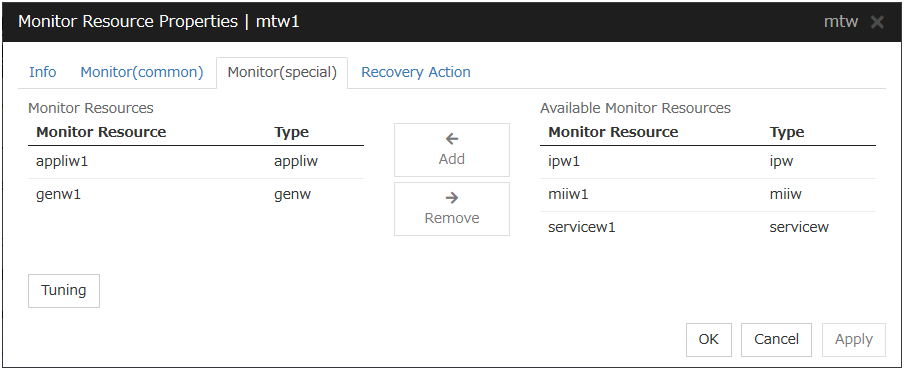
Add
Click Add to add a selected monitor resource to Monitor Resources.
Remove
Click Remove to delete a selected monitor resource from Monitor Resources.
Tuning
Use this button to display the MultiTarget Monitor Resource Tuning Properties dialog box. You can make advanced settings for the multi target monitor resource.
MultiTarget Monitor Resource Tuning Properties
Parameter tab
The detailed setting for parameters is displayed.
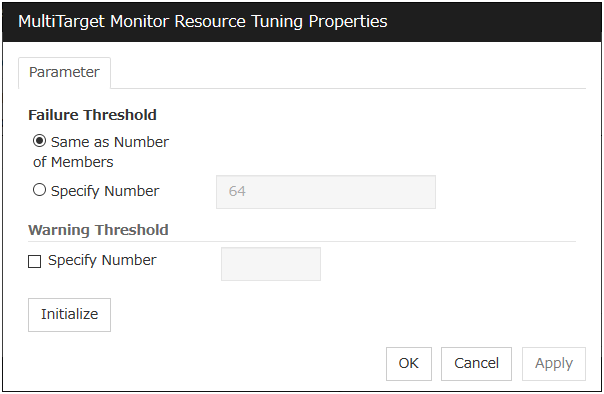
Error Threshold
Select the condition for multi target monitor resources to be determined as an error.
Warning Threshold
Initialize
Used for initializing the value to the default value. Click Initialize to initialize all the items to their default values.
5.10. Setting up message receive monitor resources
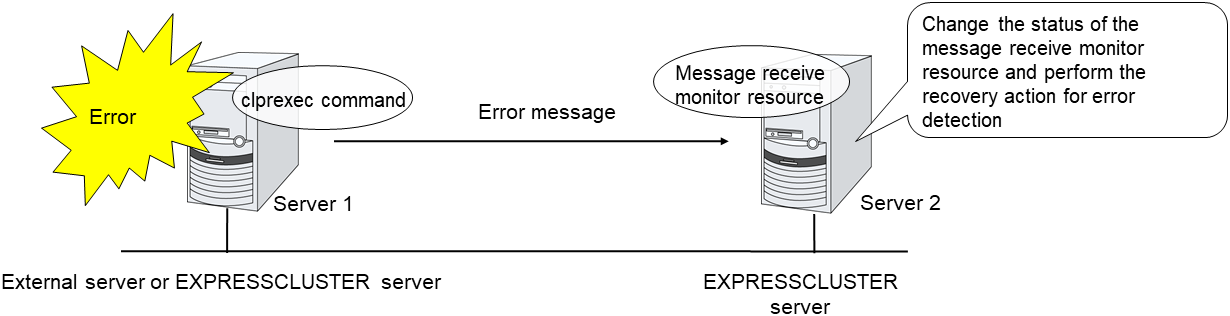
5.10.1. Monitoring by message receive monitor resources
5.10.2. Notes on message receive monitor resources
If a message receive monitor resource is paused when an error message is received from outside, error correction is not performed.
If an error message is received from outside, the status of the message receive monitor resource becomes "error". The error status of the message receive monitor resource is not automatically restored to "normal". To restore the status to normal, use the clprexec command. For details about the clprexec command, see "EXPRESSCLUSTER X SingleServerSafe command reference" in the "EXPRESSCLUSTER X SingleServerSafe Operation Guide".
If an error message is received when the message receive monitor resource is already in the error status due to a previous error message, recovery from the error is not performed.
5.10.3. Monitor (special) tab
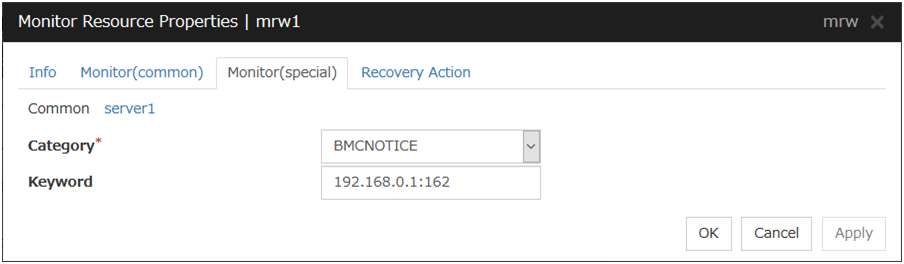
For Category and Keyword, specify a keyword passed using the -k parameter of the clprexec command. Monitor Target can be omitted.
Category (within 32 bytes)
Specify the category specified with -k argument of clprexec command. You can specify any character string.
Keyword (within 1,023 bytes)
Specify the keyword specified with -k argument of clprexec command.
5.11. Setting up VM monitor resources
5.11.1. Notes on VM monitor resources
For the version of the supported virtualization platform, see "System requirements for VM resource" in "4. Group resource details".
5.11.2. Monitoring by VM monitor resources
A VM monitor resource performs monitoring in the manner below, according to the virtualization platform.
5.12. Setting up process name monitor resources
Process name monitor resources monitor the process of arbitrary process name.
5.12.1. Notes on process name monitor resources
If you set 1 for Minimum Process Count, and if there are two or more processes having the name specified for the monitor target, only one process is selected according to the following conditions and is subject to monitoring.
When the processes are in a parent-child relationship, the parent process is monitored.
When the processes are not in a parent-child relationship, the process having the earliest activation time is monitored.
When the processes are not in a parent-child relationship and their activation times are the same, the process having the lowest process ID is monitored.
If monitoring of the number of started processes is performed when there are multiple processes with the same name, specify the process count to be monitored for Minimum Process Count. If the number of processes with the same name falls short of the specified minimum count, an error is recognized. You can set 1 to 999 for Minimum Process Count. If you set 1, only one process is selected for monitoring.
If the name of the target process is too long, the process name is output to the log file with the latter part omitted.
Use the following command to check the name of a process that is actually running and specify the name for the monitor target process name.
EXPRESSCLUSTER installation path\bin\GetProcess.vbs
When the above command is executed, GetProcess_Result.txt is output to the folder in which the command is executed. Open GetProcess_Result.txt and specify the CommandLine section of the process being displayed. If the output information includes double quotations (""), specify the section including the double quotations.
Example of output file
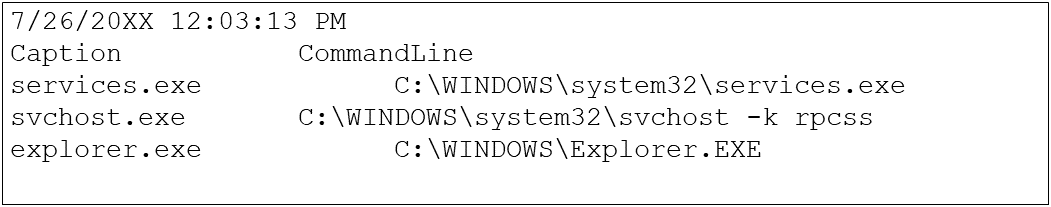
To monitor svchost.exe shown in the above command output information, specify C:\WINDOWS\system32\svchost -k rpcss as the monitor target process name.
The process name specified for the name of the target process specifies the target process, using the process arguments as part of the process name. To specify the name of the target process, specify the process name containing the arguments. To monitor only the process name with the arguments excluded, specify it with the wildcard (*) using right truncation or partial match excluding the arguments.
5.12.2. Monitoring by process name monitor resources
Those processes having the specified process name are monitored.If Minimum Process Count is set to 1, the process ID is determined by the process name, and the error state is determined if the process ID vanishes. Process stalls cannot be detected.
If Minimum Process Count is set to a value greater than 1, the number of processes that have the specified process name are monitored. The number of processes to be monitored is calculated using the process name, and if the number falls below the minimum count, an error is recognized. Process stalls cannot be detected.
5.12.3. Monitor (special) tab
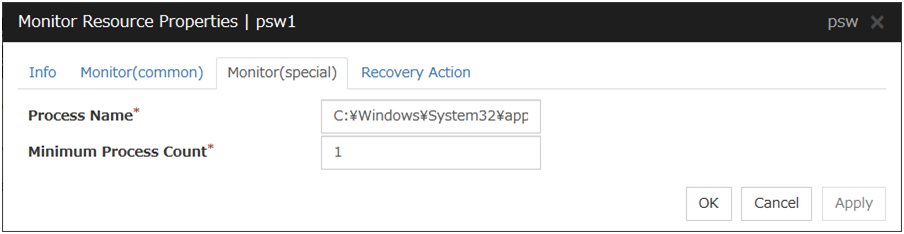
Process Name (within 1023 bytes)
Specify the name of the process to be monitored. You must specify the process name.Default value: NoneWild cards can be used to specify process names in the three patterns described below. Patterns other than these cannot be used.
prefix search : <character string included in process name>*
suffix search : *<character string included in process name>
partial search : *<character string included in process name>*
Minimum Process Count (1 to 999)
Set the process count to be monitored for the monitor target process. If the number of processes having the specified monitor target process name falls short of the set value, an error is recognized.
5.13. Setting up DB2 monitor resources
DB2 monitor resources monitor DB2 database that runs on the server.
5.13.1. Notes on DB2 monitor resources
For the supported version of DB2, see " 5.1.2. Applications supported by monitoring options" in "5. Monitor resource details".
DLL interface (DB2CLI.DLL/DB2CLI64.DLL) needs to be installed on servers where monitoring is performed because DB2 CLI is used for monitoring.
For target monitoring resources, specify a service resource or a script resource that starts DB2. Monitoring starts after the target resource is activated; however, if the database cannot be started right after the target resource is activated, adjust the time by using Wait Time to Start Monitoring.
To monitor a DB2 database that runs in the guest OS on a virtual machine controlled by a VM resource, specify the VM resource as the monitor target and specify enough wait time for the DB2 database to become accessible after the VM resource is activated for Wait Time to Start Monitoring. Also, set up the DB2 client on the host OS side, where monitor resources run, and register the database on the virtual machine to the database node directory.
A monitor table is created when monitoring starts. When monitoring is stopped due to the group stopping, the monitor table is deleted. When monitoring is temporarily stopped or when server fails before the failover group stops due to system error, the monitor table will not be deleted. Note that, if the server is shut down due to a system failure or other cause before the group is stopped, the monitor table is not deleted. In this case, an alert message saying that "a monitor table exists" might be displayed next time monitoring is started. This is not an error.
DB2 may output operation logs for each monitoring. Configure DB2 settings if this needs to be adjusted.
Selectable monitor level |
Prior creation of a monitor table |
|---|---|
Level 1 (monitoring by select) |
Required |
Level 2 (monitoring by update/select) |
Optional |
Create a monitor table using either of the following methods:
(In the following example, the monitor table is named DB2WATCH):
sql> create table DB2WATCH (num int not null primary key)
sql> insert into DB2WATCH values(0)
sql> commit
5.13.2. Monitoring by DB2 monitor resources
DB2 monitor resources perform monitoring according to the specified monitoring level.
- Level 1 (monitoring by select)Monitoring with only reference to the monitor table. SQL statements issued to the monitor table are of (select) type.An error is recognized if:
A database connection could not be established
An error message is sent in response to an SQL statement
- Level 2 (monitoring by update/select)Monitoring with reference to and update of the monitoring table. One SQL statement can read/write numerical data of up to 10 digits. At monitoring start/end, the monitor table is created/deleted. SQL statements issued to the monitor table are of (create / update / select / drop) type.An error is recognized if:
A database connection could not be established
An error message is sent in response to an SQL statement
The written data is not the same as the read data
5.13.3. Monitor (special) tab
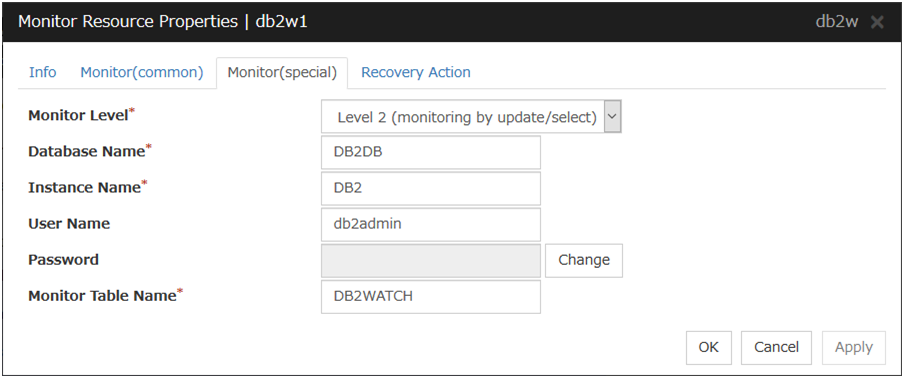
Monitor Level
Select one of the following levels. You cannot omit this level setting.
Default value: Level 2 (monitoring by update/select)
Database Name (within 255 bytes)
Specify the database name to be monitored. Specifying this item cannot be omitted.
Default value: None
Instance Name (within 255bytes)
Specify the database instance name. Specifying this item cannot be omitted.
Default value: DB2
User Name (within 255 bytes)
Specify the user name to log on to the database.
Default value: db2admin
Password (within 255 bytes)
Specify the password to log on to the database. Click Change and enter the password in the dialog box.
Default value: None
Monitor Table Name (within 255 bytes)
Specify the name of a monitor table created on the database. Specifying this item cannot be omitted. Make sure not to specify the same name as the table used for operation because a monitor table will be created and deleted. Be sure to set the name different from the reserved word in SQL statements.Some characters cannot be used to specify a monitor table name according to the database specifications. For details, refer to the database specifications.Default value: DB2WATCH
5.14. Setting up FTP monitor resources
FTP monitor resources monitor FTP services that run on the server. FTP monitor resources monitor FTP protocol and they are not intended for monitoring specific applications. FTP monitor resources monitor various applications that use FTP protocol.
5.14.1. Notes on FTP monitor resources
5.14.2. Monitoring by FTP monitor resources
When connection to the FTP service fails.
When an error is notified as a response to the FTP command.
5.14.3. Monitor (special) tab
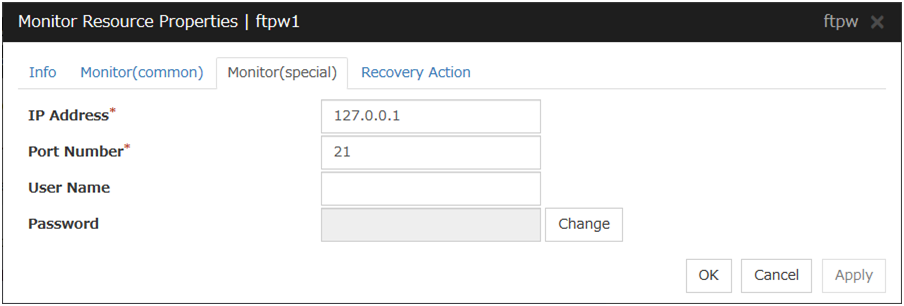
IP Address (within 255 bytes)
Specify the IP address of the FTP server to be monitored. Specifying this item cannot be omitted.Usually, specify the loopback address (127.0.0.1) to connect to the FTP server that runs on the local server. If the addresses for which connection is possible are limited by FTP server settings, specify an address for which connection is possible. To monitor an FTP server that runs in the guest OS on a virtual machine controlled by a VM resource, specify the IP address of the virtual machine.Default value: 127.0.0.1
Port Number (1 to 65535)
Specify the FTP port number to be monitored. Specifying this item cannot be omitted.
Default value: 21
User Name (within 255 bytes)
Specify the user name to log on to FTP.
Default value: None
Password (within 255 bytes)
Specify the password to log on to FTP. Click Change and enter the password in the dialog box.
Default value: None
5.15. Setting up HTTP monitor resources
HTTP monitor resources monitor HTTP services that run on the server. HTTP monitor resources monitor HTTP protocol but they are not intended for monitoring specific applications. HTTP monitor resources monitor various applications that implement HTTP protocol.
5.15.1. Notes on HTTP monitor resources
5.15.2. Monitoring by HTTP monitor resources
an error is notified during the connection to the HTTP daemon.
the response message to the HEAD request is not started with "/HTTP"
the status code for the response to the HEAD request is in 400s and 500s (when URI other than the default is specified to the request URI)
5.15.3. Monitor (special) tab
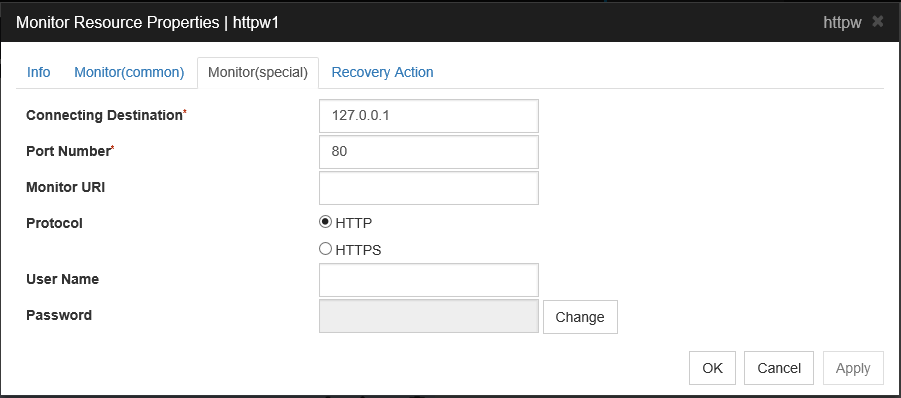
Connecting Destination (within 255 bytes)
Specify the IP address of the HTTP server to be monitored. Be sure to specify the name.Usually, specify the loopback address (127.0.0.1) to connect to the HTTP server that runs on the local server. If the addresses for which connection is possible are limited by HTTP server settings, specify an address for which connection is possible. To monitor an HTTP server that runs in the guest OS on a virtual machine controlled by a VM resource, specify the IP address of the virtual machine.Default value: 127.0.0.1
Port Number (1 to 65535)
You must specify the port number of the HTTP to be monitored. Specifying this item cannot be omitted.
Default value: 80 (HTTP)443 (HTTPS)
Monitor URI (within 255 bytes)
Specify the URI of the HTTP to be monitored.If URI is not specified, the document root is monitored. It is not necessary to create a monitoring page.If a URI is specified, that URI is monitored. The specified URI needs to allow anonymous access.Write the following in URI form from the DocumentRoot.(Example) When the URI of the web page to be monitored is as follows: http://WebServer:80/watch/sample.htm
/watch/sample.htmDefault value: None
Protocol
Configure protocol used for communication with HTTP server. In general, HTTP is selected. If you need to connect with HTTP over SSL, select HTTPS.
User Name(within 255 bytes)
Specify a user name for logging in to the HTTP server.This specification is necessary only for basic authentication.Default value: None
Password(within 255 bytes)
Specify a password for logging in to the HTTP server.This specification is necessary only for basic authentication.Default value: None
5.16. Setting up IMAP4 monitor resources
IMAP4 monitor resources monitor IMAP4 services that run on the server. IMAP4 monitor resources monitor IMAP4 protocol but they are not intended for monitoring specific applications. IMAP4 monitor resources monitor various applications that use IMAP4 protocol.
5.16.1. Notes on IMAP4 monitor resources
As the monitoring target resource, specify a service resource or script resource that starts the IMAP4 server. Monitoring starts after the target resource is activated. However, if the IMAP4 server cannot be started immediately after the target resource is activated, adjust the time by using Wait Time to Start Monitoring.
To monitor an IMAP4 server that runs in the guest OS on a virtual machine controlled by a VM resource, specify the VM resource as the monitor target and specify enough wait time for the IMAP4 server to become accessible after the VM resource is activated for Wait Time to Start Monitoring.
The IMAP4 server might output an operation log or other data for each monitoring operation. If this needs to be adjusted, specify the IMAP4 server settings as appropriate.
5.16.2. Monitoring by IMAP4 monitor resources
When connection to the IMAP4 server fails.
When an error is notified as a response to the command.
5.16.3. Monitor (special) tab
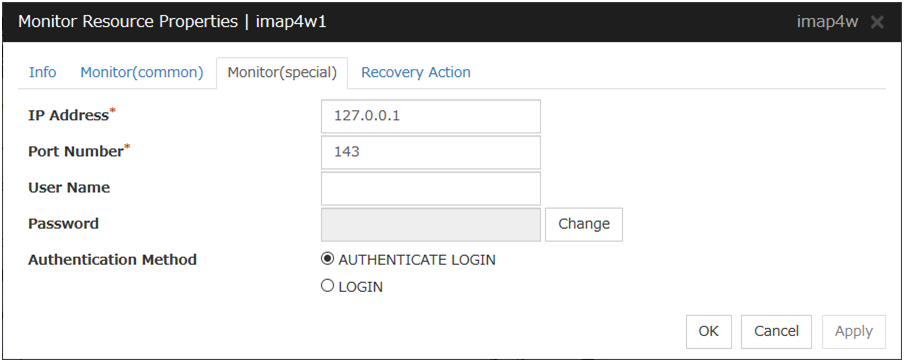
IP Address (within 255 bytes)
Specify the IP address of the IMAP4 server to be monitored. Specifying this item cannot be omitted.Usually, specify the loopback address (127.0.0.1) to connect to the IMAP4 server that runs on the local server. If the addresses for which connection is possible are limited by IMAP4 server settings, specify an address for which connection is possible. To monitor an IMAP4 server that runs in the guest OS on a virtual machine controlled by a VM resource, specify the IP address of the virtual machine.Default value: 127.0.0.1
Port Number (1 to 65,535)
Specify the port number of the IMAP4 to be monitored. Specifying this item cannot be omitted.
Default value: 143
User Name (within 255 bytes)
Specify the user name to log on to IMAP4.
Default value: None
Password (within 189 bytes)
Specify the password to log on to IMAP4. Click Change and enter the password in the dialog box.
Default value: None
Authentication Method
Select the authentication method to log on to IMAP4. It must follow the settings of IMAP4 being used:
AUTHENTICATE LOGIN (default value)
The encryption authentication method that uses the AUTHENTICATE LOGIN command.
LOGIN
The plaintext method that uses the LOGIN command.
5.17. Setting up ODBC monitor resources
ODBC monitor resources monitor ODBC database that runs on the server.
5.17.1. Notes on ODBC monitor resources
Selectable monitor level |
Prior creation of a monitor table |
|---|---|
Level 1 (monitoring by select) |
Required |
Level 2 (monitoring by update/select) |
Optional |
Create a monitor table using either of the following methods:
(In the following example, the monitor table is named ODBCWATCH):
sql> create table ODBCWATCH (num int not null primary key);
sql> insert into ODBCWATCH values(0);
sql> commit;
5.17.2. Monitoring by ODBC monitor resources
ODBC monitor resources perform monitoring according to the specified monitoring level.
- Level 1 (monitoring by select)Monitoring with only reference to the monitor table. SQL statements issued to the monitor table are of (select) type.An error is recognized if:
A database connection could not be established
An error message is sent in response to an SQL statement
- Level 2 (monitoring by update/select)Monitoring with reference to and update of the monitoring table. One SQL statement can read/write numerical data of up to 10 digits. At monitoring start/end, the monitor table is created/deleted. SQL statements issued to the monitor table are of (create / update / select / drop) type.An error is recognized if:
A database connection could not be established
An error message is sent in response to an SQL statement
The written data is not the same as the read data
5.17.3. Monitor (special) tab
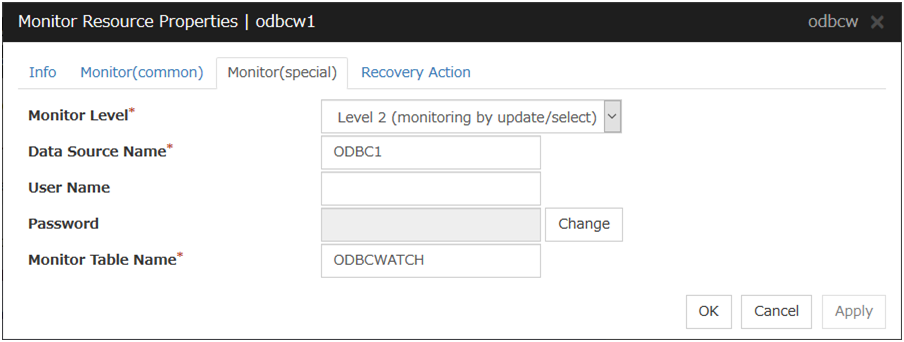
Monitor Level
Select one of the following levels. You cannot omit this level setting.
Default value: Level 2 (monitoring by update/select)
Data Source Name (within 255 bytes)
Specify the data source name to be monitored. Specifying this item cannot be omitted.
Default value: None
User Name (within 255 bytes)
Specify the user name to log on to the database. You do not have to specify if the user name is specified in the data source settings.
Default value: None
Password (within 255 bytes)
Specify the password to log on to the database. Click Change and enter the password in the dialog box.
Default value: None
Monitor Table Name (within 255 bytes)
Specify the name of a monitor table created on the database. Specifying this item cannot be omitted. Make sure not to specify the same name as the table used for operation because a monitor table will be created and deleted. Be sure to set the name different from the reserved word in SQL statements.Some characters cannot be used to specify a monitor table name according to the database specifications. For details, refer to the database specifications.Default value: ODBCWATCH
5.18. Setting up Oracle monitor resources
Oracle monitor resources monitor Oracle database that runs on the server.
5.18.1. Notes on Oracle monitor resources
Monitor level |
Necessary permissions |
|---|---|
Level 0 (database status) |
SELECT permission for V$PROCESS / SELECT permission for V$INSTANCE |
Level 1 (monitoring by select) |
SELECT permission for V$PROCESS / SELECT permission for a monitor table |
Level 2 (monitoring by update/select) |
SELECT permission for V$PROCESS / CREATE TABLE / DROP ANY TABLE / INSERT permission for a monitor table / UPDATE permission for a monitor table /SELECT permission for a monitor table |
Oracle database may output operation logs for each monitoring. Configure the Oracle settings if this needs to be adjusted.
Selectable monitor level |
Prior creation of a monitor table |
|---|---|
Level 0 (database status) |
Optional |
Level 1 (monitoring by select) |
Required |
Level 2 (monitoring by update/select) |
Optional |
Create a monitor table using either of the following methods:
(In the following example, the monitor table is named ORAWATCH):
sql> create table ORAWATCH (num int primary key);
sql> insert into ORAWATCH values(0);
sql> commit;
*Create this in a schema for the user specified for the user name parameter.
5.18.2. Monitoring by Oracle monitor resources
Oracle monitor resources perform monitoring according to the specified monitor level.
- Level 0 (database status)The Oracle management table (V$INSTANCE table) is referenced to check the DB status (instance status). This level corresponds to simplified monitoring without SQL statements being executed for the monitor table.An error is recognized if:
The DB (instance) status is in the inactive state (MOUNTED, STARTED)
- Level 1 (monitoring by select)Monitoring with only reference to the monitor table. SQL statements issued to the monitor table are of (select) type.An error is recognized if:
A database connection could not be established
An error message is sent in response to an SQL statement
- Level 2 (monitoring by update/select)Monitoring with reference to and update of the monitoring table. One SQL statement can read/write numerical data of up to 10 digits. At monitoring start/end, the monitor table is created/deleted. SQL statements issued to the monitor table are of (create / update / select / drop) type.An error is recognized if:
A database connection could not be established
An error message is sent in response to an SQL statement
The written data is not the same as the read data
5.18.3. Monitor (special) tab
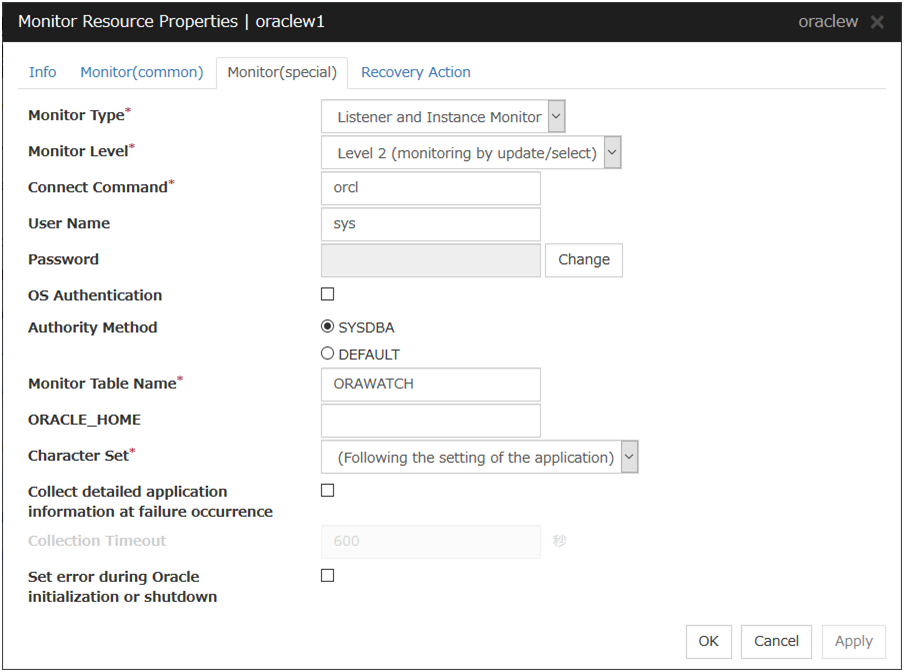
Monitor Type
Select the Oracle features to be monitored.
Default value: Monitor Listener and Instance
Monitor Level
Select one of the following levels. You cannot omit this level setting.
Default value: Level 2 (monitoring by update/select)
Connect String (within 255 bytes)
Specify the connect string for the database to be monitored. You must specify the connect string.When Monitor Type is set to Monitor Instance only, set ORACLE_SID.
Monitor Type
ORACLE_HOME
Connect Command
Monitor Level
Monitor Listener and Instance
Need not be specified
Specify the connect string
As specified
Monitor Listener only
Monitoring dependent on Oracle command if specified
Specify the connect string
Ignored
Check for connection to the instance through the listener if not specified
Specify the connect string
Ignored
Monitor Instance only
Check for the instance by BEQ connection if specified
Specify ORACLE_SID
As specified
Check for the instance through the listener if not specified
Specify the connect string
As specified
Default value: None for the connect string
User Name (within 255 bytes)
Specify the user name to log on to the database. Be sure to specify this when a method other than Monitor Listener only is selected for Monitor Method or when OS authentication is used.
Default value: sys
Password (within 255 bytes)
Specify the password to log on to the database. Click Change and enter the password in the dialog box.
Default value: None
OS Authentication
Specify the authentication method to log on to the Oracle monitor. It must follow the Oracle monitor settings.
Authority Method
Select the user authority to log on to the Oracle monitor. This must be set according to the authority of the specified user name.
Monitor Table Name (within 255 bytes)
Specify the name of a monitor table created on the database. Specifying this item cannot be omitted. Make sure not to specify the same name as the table used for operation because a monitor table will be created and deleted. Be sure to set the name different from the reserved word in SQL statements.
Some characters cannot be used to specify a monitor table name according to the database specifications. For details, refer to the database specifications.
Default value: ORAWATCH
ORACLE_HOME (within 255 bytes)
Specify the path name configured in ORACLE_HOME. Begin with [/]. This is used when Monitor Type is set to Monitor Listener only or Monitor Instance only.
Default value: None
Character Set
Select the character set for Oracle. When the language for Oracle is not Japanese or English, select AMERICAN_AMERICA.US7ASCII.
Collect detailed application information at failure occurrence
Specify whether to collect detailed Oracle information if an Oracle database error is detected.
work\rm\resource name\errinfo.curfolder under EXPRESSCLUSTER install folder. When collection is executed more than once, the folder names of the past collection information are renamed as errinfo.1, errinfo.2. And the folders are saved by 5 generations from the latest information.Note
When the oracle service is stopped due to cluster stop or other reasons while collecting, the correct information may not be collected.Do not perform the manual operation such as Group stop or Group move while collecting information. Monitoring process may not work normally depending on the timing of the manual operation.
Collection Timeout (1 to 9,999)
Specify the timeout time for collecting detailed information in seconds.
Default value: 120
Set error during Oracle initialization or shutdown
When this function is enabled, a monitor error occurs immediately upon the detection of Oracle initialization or shutdown in progress.
Disable this function when Oracle automatically restarts in cooperation with Oracle Clusterware or the like during operation. Monitoring becomes normal even during Oracle initialization or shutdown.However, a monitor error occurs if Oracle initialization or shutdown continues for one hour or more.Default value: Disabled
5.19. Setting up POP3 monitor resources
POP3 monitor resources monitor POP3 services that run on the server. POP3 monitor resources monitor POP3 protocol but they are not intended for monitoring specific applications. POP3 monitor resources monitor various applications that use POP3 protocol.
5.19.1. Notes on POP3 monitor resources
5.19.2. Monitoring by POP3 monitor resources
When connection to the POP3 server fails.
When an error is notified as a response to the command.
5.19.3. Monitor (special) tab
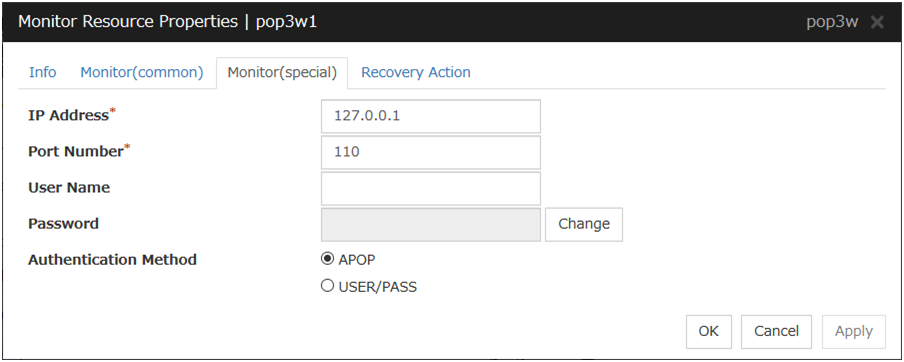
IP Address (within 255 bytes)
Specify the IP address of the POP3 server to be monitored. Specifying this item cannot be omitted.Usually, specify the loopback address (127.0.0.1) to connect to the POP3 server that runs on the local server. If the addresses for which connection is possible are limited by POP3 server settings, specify an address for which connection is possible. To monitor a POP3 server that runs in the guest OS on a virtual machine controlled by a VM resource, specify the IP address of the virtual machine.Default value: 127.0.0.1
Port Number (1 to 65535)
Specify the POP3 port number to be monitored. Specifying this item cannot be omitted.
Default value: 110
User Name (within 255 bytes)
Specify the user name to log on to POP3.
Default value: None
Password (within 255 bytes)
Specify the password to log on to POP3. Click Change and enter the password in the dialog box.
Default value: None
Authentication Method
Select the authentication method to log on to POP3. It must follow the settings of POP3 being used:
5.20. Setting up PostgreSQL monitor resources
PostgreSQL monitor resources monitor PostgreSQL database that runs on the server.
5.20.1. Notes on PostgreSQL monitor resources
For the supported PostgreSQL/PowerGres version, see " 5.1.2. Applications supported by monitoring options " in "5. Monitor resource details".
Interface DLL (LIBPQ.DLL) needs to be installed on the server where monitoring is performed because PostgreSQL/PowerGres library is used for monitoring. Specify the path of this DLL to the environmental variable when monitoring PostgreSQL.
For a target monitoring resource, specify a service resource or a script resource that can start PostgreSQL/PowerGres. Monitoring starts after the target resource is activated; however, if the database cannot be started right after the target resource is activated, adjust the time by using Wait Time to Start Monitoring.
To monitor a PostgreSQL database that runs in the guest OS on a virtual machine controlled by a VM resource, specify the VM resource as the monitor target and specify enough wait time for the PostgreSQL database to become accessible after the VM resource is activated for Wait Time to Start Monitoring.
A monitor table is created when monitoring starts. When monitoring is stopped due to the group stopping, the monitor table is deleted. When monitoring is temporarily stopped or when the server fails before the failover group stops due to system error, the monitor table is not deleted. Note that, if the server is shut down due to a system failure or other cause before the group is stopped, the monitor table will not be deleted. In this case, an alert message saying that "a monitor table exists" might be displayed next time monitoring is started. This is not an error.
PostgreSQL/PowerGres may output operation logs for each monitoring. Configure the PostgreSQL/PowerGres settings if this needs to be adjusted.
Because PostgreSQL is open-source software (OSS), its operation is checked but not guaranteed. Make sure to use PostgreSQL after evaluating it by yourself.
If PostgreSQL monitoring is performed, an error indicating that no library can be found may be output depending on the OS and PostgreSQL versions. In this case, add PostgreSQL bin to the PATH of the system environment variable. After that, restart the cluster.
When adding PATH to the environment variable (The following is an example of PATH of PostgreSQL9.6 bin.)
C:\Program Files\PostgreSQL\9.6\bin
When this monitor resource is used, messages like those shown below are output to a log on the PostgreSQL side. These messages are output by the monitor processing and do not indicate any problems.
YYYY-MM-DD hh:mm:ss JST moodle moodle LOG: statement: DROP TABLE psqlwatch
YYYY-MM-DD hh:mm:ss JST moodle moodle ERROR: table "psqlwatch" does not exist
YYYY-MM-DD hh:mm:ss JST moodle moodle STATEMENT: DROP TABLE psqlwatch
YYYY-MM-DD hh:mm:ss JST moodle moodle LOG: statement: CREATE TABLE psqlwatch (num INTEGER NOT NULL PRIMARY KEY)
YYYY-MM-DD hh:mm:ss JST moodle moodle NOTICE: CREATE TABLE / PRIMARY KEY will create implicit index "psqlwatch_pkey" for table "psql watch"
YYYY-MM-DD hh:mm:ss JST moodle moodle LOG: statement: DROP TABLE psqlwatch
Selectable monitor level |
Prior creation of a monitor table |
|---|---|
Level 1 (monitoring by select) |
Required |
Level 2 (monitoring by update/select) |
Optional |
Create a monitor table using either of the following methods:
(In the following example, the monitor table is named PSQLWATCH):
sql> create table PSQLWATCH (num int not null primary key);
sql> insert into PSQLWATCH values(0);
sql> commit;
5.20.2. Monitoring by PostgreSQL monitor resources
PostgreSQL monitor resources perform monitoring according to the specified monitor level.
- Level 1 (monitoring by select)Monitoring with only reference to the monitor table. SQL statements issued to the monitor table are of (select) type.An error is recognized if:
A database connection could not be established
An error message is sent in response to an SQL statement
- Level 2 (monitoring by update/select)Monitoring with reference to and update of the monitoring table. One SQL statement can read/write numerical data of up to 10 digits. At monitoring start/end, the monitor table is created/deleted. SQL statements issued to the monitor table are of ( create / update / select / reindex / drop / vacuum ) type.An error is recognized if:
A database connection could not be established
An error message is sent in response to an SQL statement
The written data is not the same as the read data
5.20.3. Monitor (special) tab
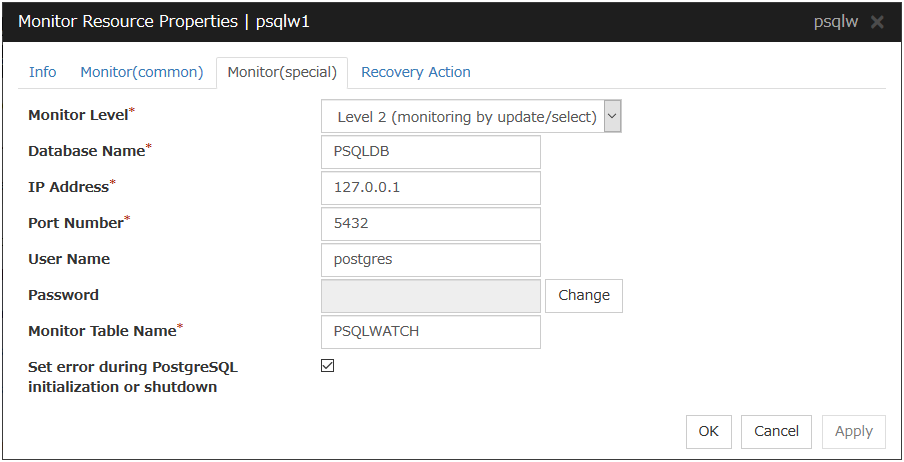
Monitor Level
Select one of the following levels. You cannot omit this level setting.
Default value: Level 2 (monitoring by update/select)
Database Name (within 255 bytes)
Specify the database name to be monitored. Specifying this item cannot be omitted.
Default value: None
IP Address:
Specify the IP address of the database server to be monitored. Specifying this item cannot be omitted.Usually, specify the loopback address (127.0.0.1) to connect to the PostgreSQL server that runs on the local server. To monitor a PostgreSQL database that runs in the guest OS on a virtual machine controlled by a VM resource, specify the IP address of the virtual machine.Default value: 127.0.0.1
Port Number
Specify the PostgreSQL port number to be monitored. Specifying this item cannot be omitted.
Default value: 5432
User Name (within 255 bytes)
Specify the user name to log on to the database.
Default value: postgres
Password (within 255 bytes)
Specify the password to log on to the database. Click Change and enter the password in the dialog box.
Default value: None
Monitor Table Name (within 255 bytes)
Specify the name of a monitor table created on the database. Specifying this item cannot be omitted. Make sure not to specify the same name as the table used for operation because a monitor table will be created and deleted. Be sure to set the name different from the reserved word in SQL statements.Some characters cannot be used to specify a monitor table name according to the database specifications. For details, refer to the database specifications.Default value: PSQLWATCH
Set error during PostgreSQL initialization or shutdown
When this function is enabled, a monitor error occurs immediately upon the detection of PostgreSQL initialization or shutdown in progress.When this function is disabled, monitoring becomes normal even during PostgreSQL initialization or shutdown.However, a monitor error occurs if PostgreSQL initialization or shutdown continues for one hour or more.Default value: Enabled
5.21. Setting up SMTP monitor resources
SMTP monitor resources monitor SMTP services that run on the server. SMTP monitor resources monitor SMTP protocol but they are not intended for monitoring specific applications. SMTP monitor resources monitor various applications that use SMTP protocol.
5.21.1. Notes on SMTP monitor resources
5.21.2. Monitoring by SMTP monitor resources
When connection to the SMTP server fails.
When an error is notified as a response to the command.
5.21.3. Monitor (special) tab
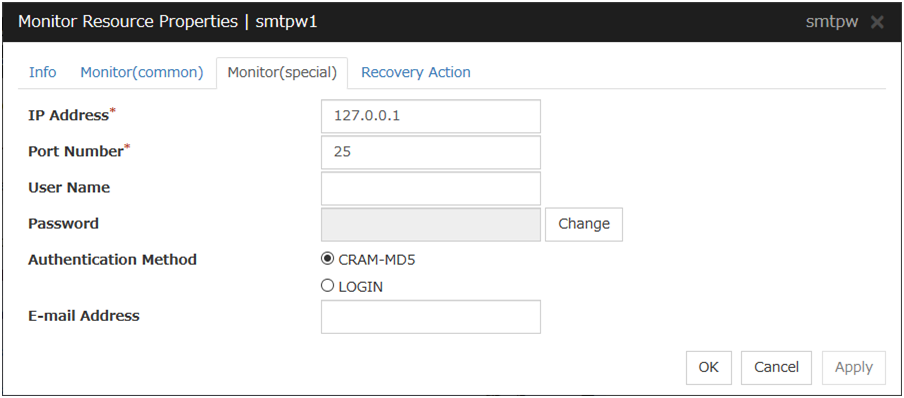
IP Address
Specify the IP address of the SMTP server to be monitored. Specifying this item cannot be omitted.Usually, specify the loopback address (127.0.0.1) to connect to the SMTP server that runs on the local server. To monitor an SMTP server that runs in the guest OS on a virtual machine controlled by a VM resource, specify the IP address of the virtual machine.Default value: 127.0.0.1
Port Number
Specify the port number of the SMTP to be monitored. Specifying this item cannot be omitted.
Default value: 25
User Name (within 255 bytes)
Specify the user name to log on to SMTP. If no user name is specified, SMTP authentication is not performed.
Default value: None
Password (within 255 bytes)
Specify the password to log on to SMTP. Click Change and enter the password in the dialog box.
Default value: None
Authentication Method
Select the authentication method to log on to the SMTP. It must follow the settings of SMTP being used:
E-mail Address (within 255 bytes)
Specify the email address used for monitoring. If nothing is specified, monitoring is performed using the command to verify the operation. The command that uses a dummy e-mail address is executed internally. If an email address is specified, monitoring is performed by running SMTP command to the specified e-mail address and verifying the result of it. It is recommended to have an e-mail address dedicated to monitoring.
Default value: None
5.22. Setting up SQL Server monitor resources
SQL Server monitor resources monitor SQL Server database that runs on the server.
5.22.1. Notes on SQL Server monitor resources
For the supported SQL Server version, see " 5.1.2. Applications supported by monitoring options " in "5. Monitor resource details".
For target monitoring resource, specify a service resource that can start SQL Server. Monitoring starts after the target resource is activated; however, if the database cannot be started right after the target resource is activated, adjust the time by using Wait Time to Start Monitoring.
To monitor an SQL Server database that runs in the guest OS on a virtual machine controlled by a VM resource, specify the VM resource as the monitor target and specify enough wait time for the SQL Server database to become accessible after the VM resource is activated for Wait Time to Start Monitoring. Also, set up the SQL Server client on the host OS side, where monitor resources run, and specify the name of the virtual machine server as the instance name of the monitor target.
A monitor table is created when monitoring starts. When monitoring is stopped due to the group stopping, the monitor table is deleted. When monitoring is temporarily stopped or when server fails before the failover group stops due to system error, the monitor table will not be deleted. Note that, if the server is shut down due to a system failure or other cause before the group is stopped, the monitor table will not be deleted. In this case, an alert message saying that "a monitor table exists" might be displayed next time monitoring is started. This is not an error.
SQL Server may output operation logs for each monitoring. Configure the SQL Server settings if this needs to be adjusted.
Selectable monitor level |
Prior creation of a monitor table |
|---|---|
Level 0 (database status) |
Optional |
Level 1 (monitoring by select) |
Required |
Level 2 (monitoring by update/select) |
Optional |
Create a monitor table using either of the following methods:
(In the following example, the monitor table is named SQLWATCH)
When SET IMPLICIT_TRANSACTIONS is OFF:
sql> create table SQLWATCH (num int not null primary key)
sql> go
sql> insert into SQLWATCH values(0)
sql> go
When SET IMPLICIT_TRANSACTIONS is ON:
sql> create table SQLWATCH (num int not null primary key)
sql> go
sql> insert into SQLWATCH values(0)
sql> go
sql> commit
sql> go
5.22.2. Monitoring by SQL Server monitor resources
SQL Server monitor resources perform monitoring according to the specified monitor level.
- Level 0 (database status)The SQL Server management table is referenced to check the DB status. This level corresponds to simplified monitoring without SQL statements being executed for the monitor table.An error is recognized if:
The database status is not online
- Level 1 (monitoring by select)Monitoring with only reference to the monitor table. SQL statements issued to the monitor table are of (select) type.An error is recognized if:
A database connection could not be established
An error message is sent in response to an SQL statement
- Level 2 (monitoring by update/select)Monitoring with reference to and update of the monitoring table. One SQL statement can read/write numerical data of up to 10 digits. At monitoring start/end, the monitor table is created/deleted. SQL statements issued to the monitor table are of (create / update / select / drop) type.An error is recognized if:
A database connection could not be established
An error message is sent in response to an SQL statement
The written data is not the same as the read data
5.22.3. Monitor (special) tab
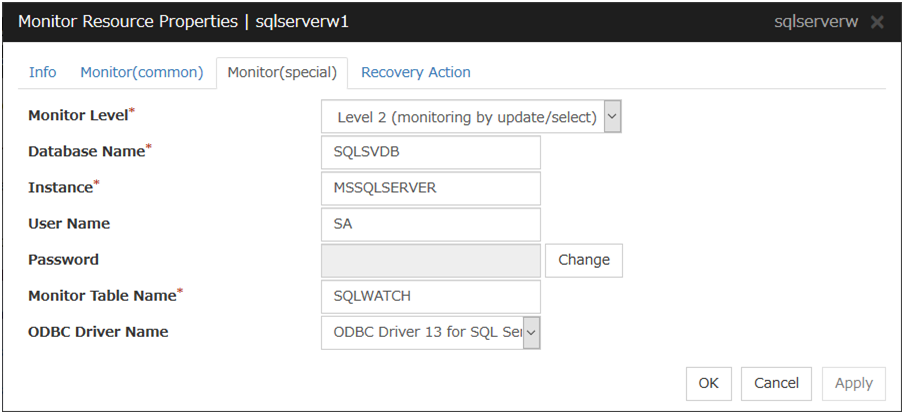
Monitor Level
Select one of the following levels. You cannot omit this level setting.
Default value: Level 2 (monitoring by update/select)
Database Name (within 255 bytes)
Specify the database name to be monitored. Specifying this item cannot be omitted.
Default value: None
Instance Name (within 255bytes)
Specify the database instance name. Specifying this item cannot be omitted.Also, when monitoring an SQL Server database running on a guest OS of a virtual machine controlled by a VM resource, it is necessary to specify the server name of the virtual machine in the format of "server-name \ instance-name".Default value: MSSQLSERVER
User Name (within 255 bytes)
Specify the user name to log on to the database. If the user name is not specified, Windows authentication is used.
Default value: SA
Password (within 255 bytes)
Specify the password to log on to the database. Click Change and enter the password in the dialog box.
Default value: None
Monitor Table Name (within 255 bytes)
Specify the name of a monitor table created on the database. Specifying this item cannot be omitted. Make sure not to specify the same name as the table used for operation because a monitor table will be created and deleted. Be sure to set the name different from the reserved word in SQL statements.Some characters cannot be used to specify a monitor table name according to the database specifications. For details, refer to the database specifications.Default value: SQLWATCH
ODBC Driver Name (within 255 bytes)
Select the driver name of the target database shown in the ODBC tab when you click Start -> Administrative Tools -> Data Sources (ODBC).Select SQL Server Native Client 11.0 in SQL Server 2014.Select ODBC Driver 13 for SQL Server in SQL Server 2016, SQL Server 2017.Select ODBC Driver 17 for SQL Server in SQL Server 2019.Default value: ODBC Driver 13 for SQL Server
5.23. Setting up Tuxedo monitor resources
Tuxedo monitor resources monitor Tuxedo that runs on the server.
5.23.1. Notes on Tuxedo monitor resources
5.23.2. Monitoring by Tuxedo monitor resources
When an error is reported during the connection to the application server and/or the acquisition of the status.
5.23.3. Monitor (special) tab
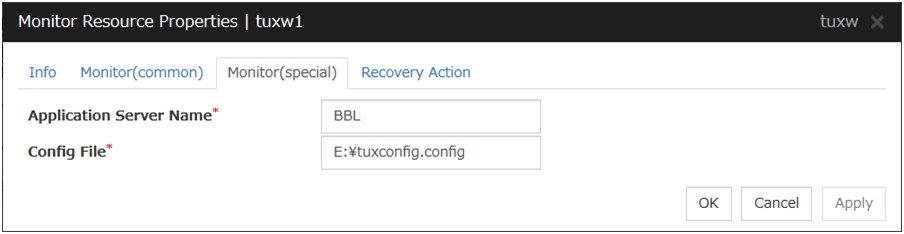
Application Server Name (within 255 bytes)
Specify the application server name to be monitored. Specifying this item cannot be omitted.
Default value: BBL
Config File (within 1,023 bytes)
Specify the placement file name of Tuxedo. Specifying this item cannot be omitted.
Default value: None
5.24. Setting up Weblogic monitor resources
Weblogic monitor resources monitor WebLogic that runs on the server.
5.24.1. Notes on Weblogic monitor resources
5.24.2. Monitoring by Weblogic monitor resources
When an error is reported as the response to the Ping.
The operations are as follows, based on Authority Method.
DemoTrust: SSL authentication method using authentication files for demonstration of Weblogic
CustomTrust: SSL authentication method using user-created authentication files
Not Use SSL: SSL authentication method is not used.
5.24.3. Monitor (special) tab
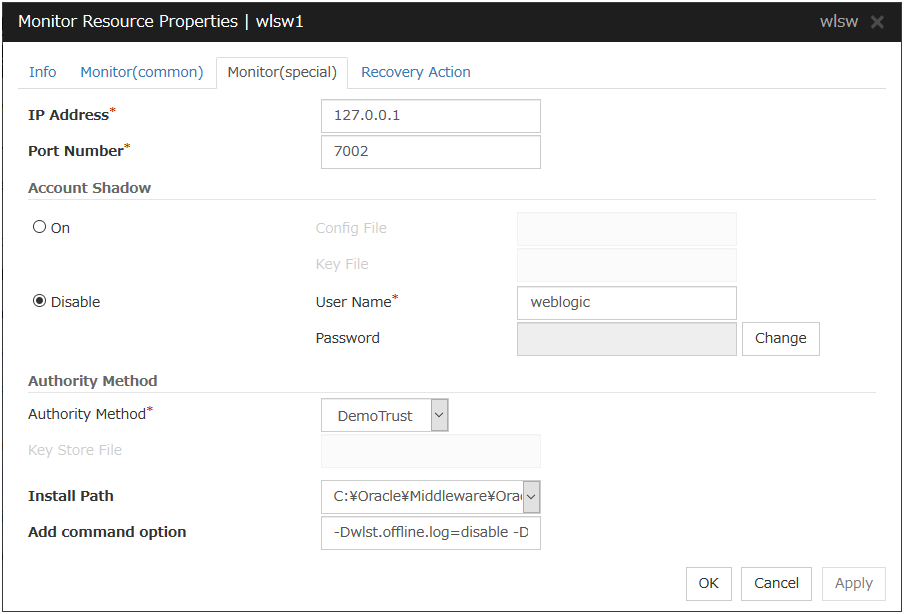
IP Address (within 80 bytes)
Specify the IP address of the server to be monitored. Specifying this item cannot be omitted.
Default value: 127.0.0.1
Port (1 to 65535)
Specify the port number used to connect to the server. Specifying this item cannot be omitted.
Default value: 7002
Account Shadow
When you specify a user name and a password directly, select Off. If not, select On. Specifying this item cannot be omitted.
Default value: Off
Config File (within 1023 bytes)
Specify the file in which the user information is saved. Specifying this item cannot be omitted if Account Shadow is On.
Default value: None
Key File (within 1023 bytes)
Specify the file in which the password required to access to a config file path is saved. Specify the full path of the file. Specifying this item cannot be omitted if Account Shadow is On.
Default value: None
User Name (within 255 bytes)
Specify the user name of WebLogic. Specifying this item cannot be omitted if Account Shadow is Off.
Default value: weblogic
Password (within 255 bytes)
Specify the password of WebLogic.
Default value: weblogic
Authority Method
Specify the authentication method when connecting to an application server. Specifying this item cannot be omitted.Specify DemoTrust or Custom Trust for Authority Method, in order to execute monitoring by using the SSL communication.It is determined whether to use DemoTrust or CustomTrust, according to the setting of Weblogic Administration Console.When Keystores of Weblogic Administration Console is set to Demo Identity and Demo Trust, specify Demo Trust. In this case, you do not need to make settings for Key Store File.When Keystores of Weblogic Administration Console is set to Custom Identity and Custom Trust, specify Custom Trust. In this case, you need to make settings for Key Store File.Default value: DemoTrust
Key Store File (within 1023 bytes)
Specify the authentication file when authenticating SSL. You must specify this when the Authority Method is CustomTrust. Set the file specified in Custom Identity Key Store File on Weblogic Administration Console.
Default value: None
Installation Path (within 1023 bytes)
Specify the installation path of WebLogic. Specifying this item cannot be omitted.
Default value:
C:\Oracle\Middleware\Oracle_Home\wlserver
Additional command option (within 1023 bytes)
Set this value when changing the option to be passed to the webLogic.WLST command.
Default value: -Dwlst.offline.log=disable -Duser.language=en_US
5.25. Setting up WebOTX monitor resources
WebOTX monitor resources monitor WebOTX that runs on the server.
5.25.1. Notes on WebOTX monitor resources
${AS_INSTALL}\bin where the otxadmin.bat command is arranged is not included in environment variable PATH any more in WebOTX V10.1. When monitoring WebOTX V10.1, configure either of the following settings.Add the path where otxadmin.bat command is located to the system environment variable, PATH.
Set the install path of WebOTX Application Server to Install Path. (e.g.
C:\WebOTX)
5.25.2. Monitoring by WebOTX monitor resources
When an error is reported with the state of the acquired application server.
5.25.3. Monitor (special) tab
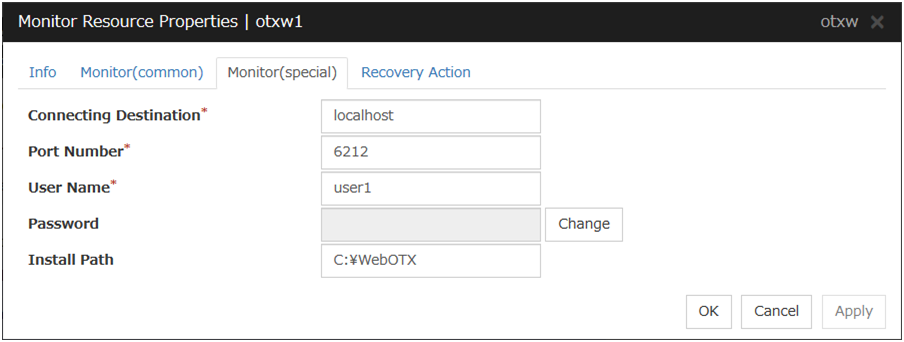
Connecting Destination (Within 255 bytes)
Specify the server name of the server to be monitored. Specifying this item cannot be omitted.
Default value: localhost
Port Number (1 to 65535)
Specify the port number used to connect to the server. Specifying this item cannot be omitted.When monitoring a WebOTX user domain, specify the management port number for the WebOTX domain. The management port number is the number which was set for "domain.admin.port" of <domain_name>.properties when the domain was created. Refer to the WebOTX documents for details of <domain_name>.propertiesDefault value: 6212
User Name (Within 255 bytes)
Specify the user name of WebOTX. Specifying this item cannot be omitted.When monitoring a WebOTX user domain, specify the login user name for the WebOTX domain.Default value:None
Password (Within 255 bytes)
Specify the password of WebOTX.
Default value: None
Install Path (Within 1023 bytes)
Specify the install path of WebOTX Application Server. You must configure this setting when monitoring WebOTX Application Server V10.1 or later.
Default value: None
5.26. Setting up Websphere monitor resources
Websphere monitor resources monitor WebSphere that runs on the server.
5.26.1. Notes on Websphere monitor resources
5.26.2. Monitoring by Websphere monitor resources
When an error is reported with the state of the acquired application server.
5.26.3. Monitor (special) tab
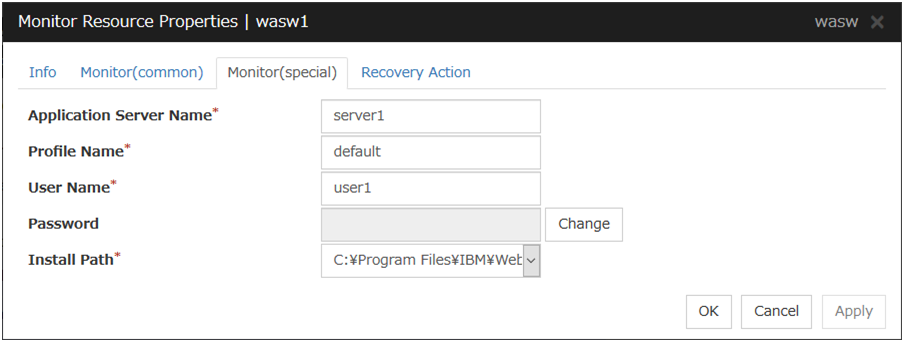
Application Server Name (within 255 bytes)
Specify the application server name to be monitored. Specifying this item cannot be omitted.
Default value: server1
Profile Name (within 1023 bytes)
Specify the profile name of WebSphere. Specifying this item cannot be omitted.
Default value: default
User Name (within 255 bytes)
Specify the user name of WebSphere. Specifying this item cannot be omitted.
Default value:None
Password (within 255 bytes)
Specify the password of WebSphere.
Default value: None
Installation Path (within 1023 bytes)
Specify the installation path of WebSphere. Specifying this item cannot be omitted.
Default value:
C:\Program Files\IBM\WebSphere\AppServer
5.27. Setting up JVM monitor resources
JVM monitor resources monitor information about the utilization of resources that are used by Java VM or an application server running on a server.
5.27.1. Note on JVM monitor resources
5.27.2. Monitoring by JVM monitor resources
The monitor resource determines the following results as errors:
Target Java VM or application server cannot be connected.
The value of the used amount of resources obtained for the Java VM or application server exceeds the user-specified threshold a specified number of times (error decision threshold) consecutively.
As a result of monitoring, an error is regarded as having been solved if:
The value falls below the threshold when restarting the monitoring after the recovery action.
Note
Collect Cluster Logs in the Cluster WebUI does not handle the configuration file and log files of the target (WebLogic or WebOTX).
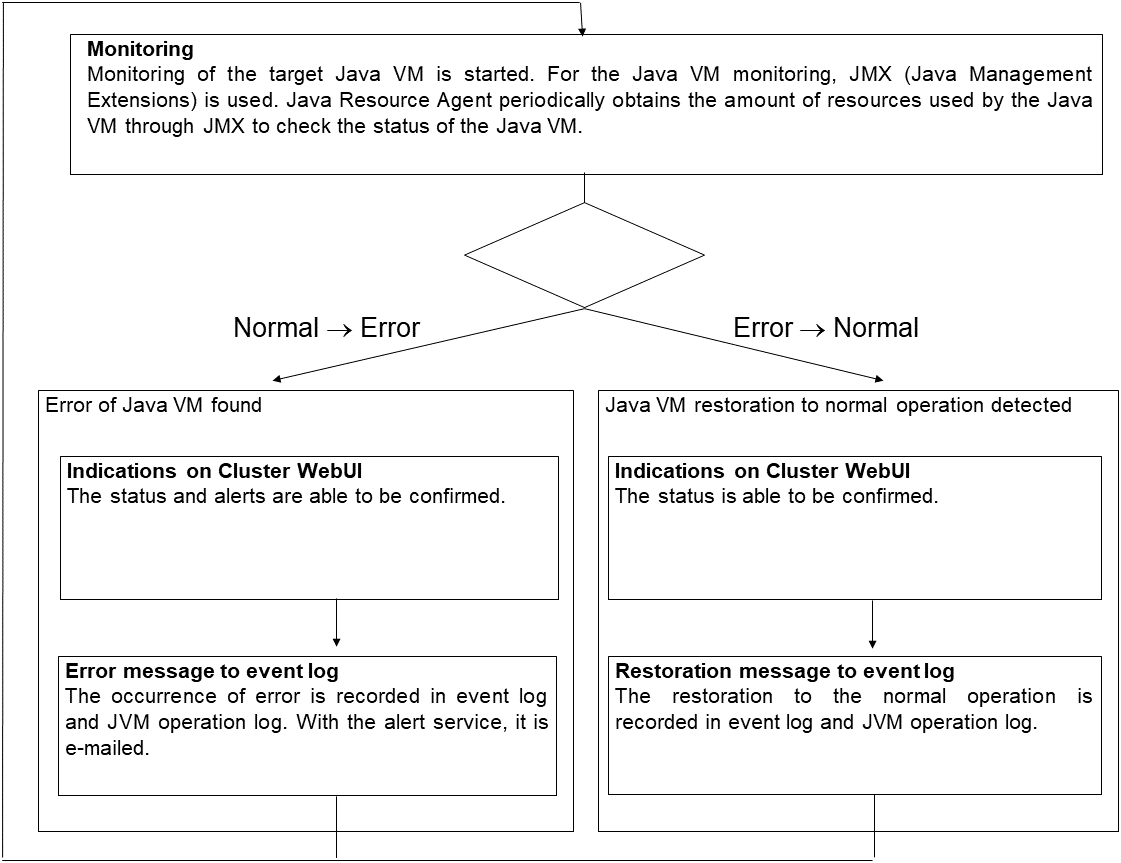
The standard operations when the threshold is exceeded are as described below.
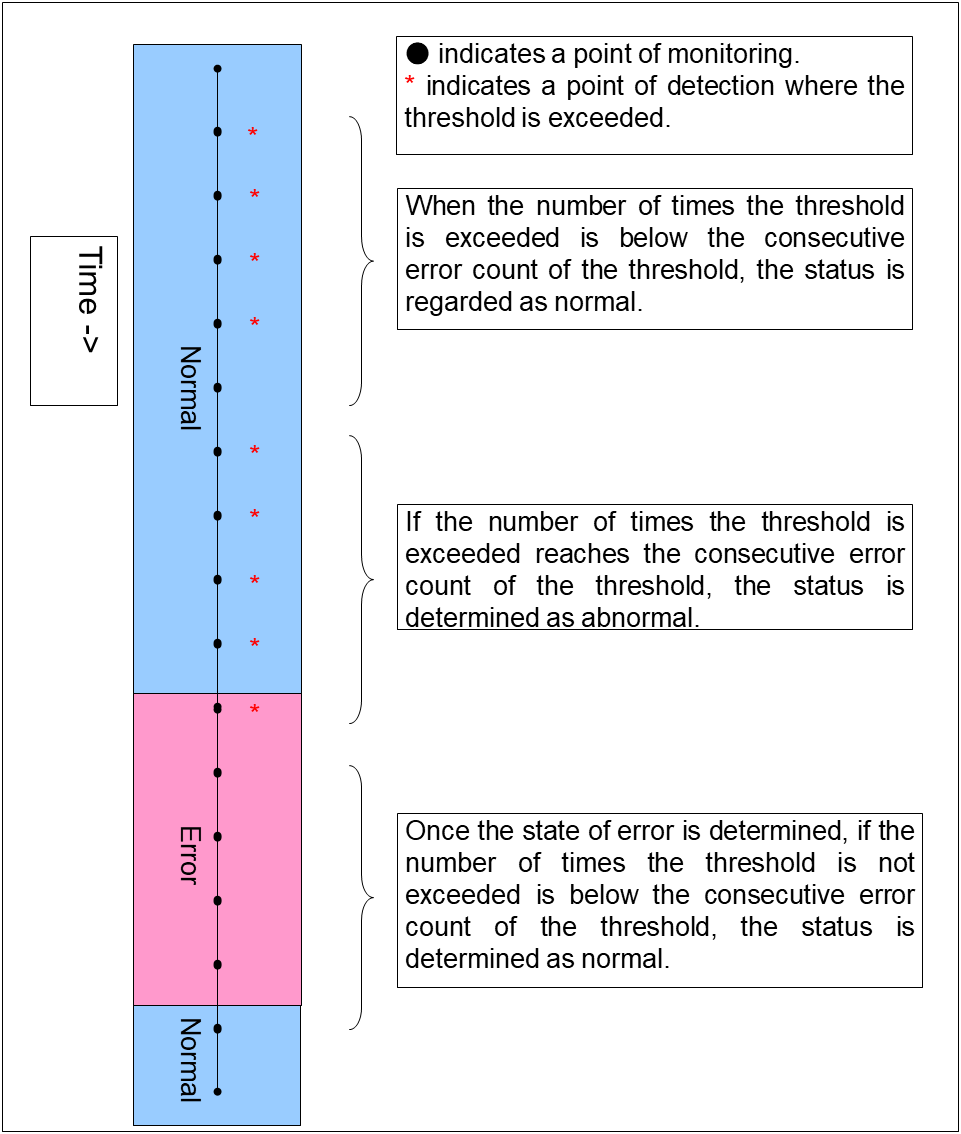
The operations performed if an error persists are as described below.
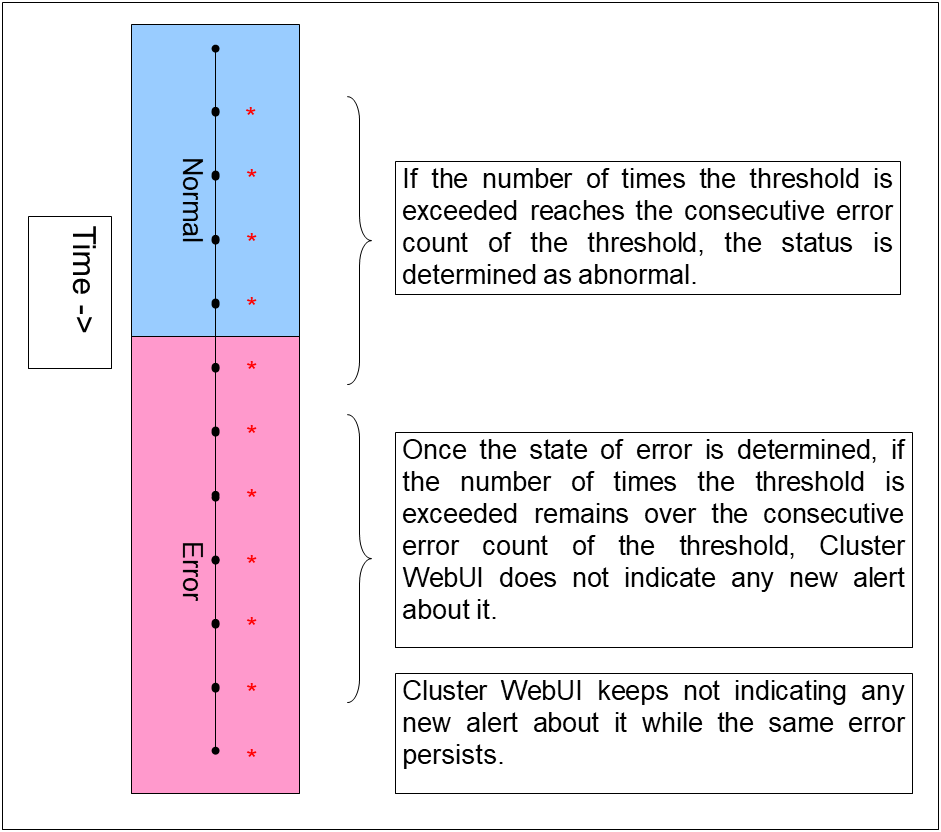
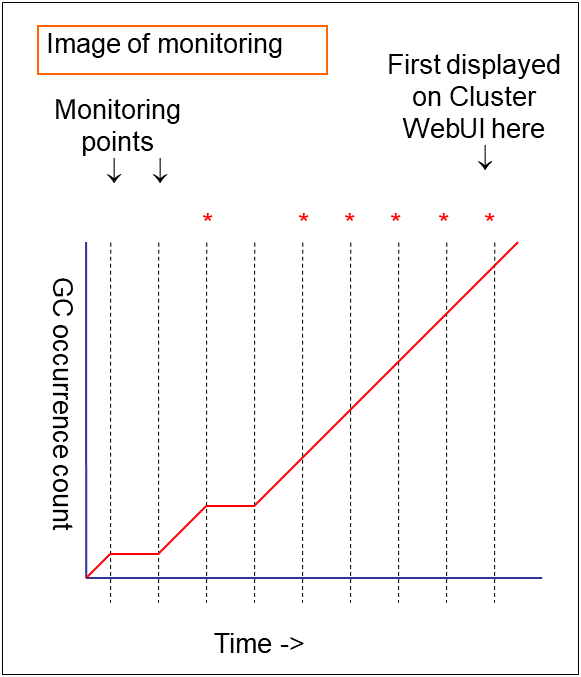
5.27.3. Linking with the load balancer (JVM monitor health check function)
Target load balancer: Load balancer with health check function for HTML files
JVM monitor resources can link with the load balancer. This section describes an example of linking when WebOTX is used as the application to be monitored. The load balancer linkage provides a JVM monitor health check function and target Java VM load calculation function. To link with the BIG-IP Local Traffic Manager, see " 5.27.5. Linking with the BIG-IP Local Traffic Manager ".
Distributed nodes are servers that are subject to load balancing, while the distributed node module is installed in the distributed nodes. The distributed node module is included in InterSec/LB400*.
To use the function, configure the settings through the Cluster WebUI Cluster Properties -> JVM Monitor tab -> Load Balancer Linkage Settings dialog box.
When a load balancing system is configured with the load balancer on the server, the JVM monitoring renames the HTML file specified by HTML File Name to the name specified by HTML Renamed File Name upon the detection of a WebOTX error (for example, exceeding the threshold for collected information).
The JVM monitoring halts for the wait time, or 20 seconds, after renaming the HTML file. The wait time is intended to prevent WebOTX from being restarted before the load balancer finishes disconnecting the distributed node.
Once the JVM monitoring detects the normality of WebOTX (e.g., the threshold specified for the collected information is not exceeded after reconnection) after WebOTX rebooting, the HTML file name set with HTML Renamed File Name is restored to that specified by HTML File Name.
The load balancer periodically health-checks the HTML file, and if a health check fails, the distributed node is determined to be not alive, so that the load balancer disconnects that distributed node. In the case of InterSec/LB400*, configure the health check interval, health check timeout, and retry count to determine the node down state by the health check with the health check (distributed node) interval parameter, HTTP health check timeout parameter, and health check (distributed node) count parameter, that are accessible from ManagementConsole for the load balancer -> LoadBalancer -> System Information.
Configure the parameters using the following as a reference.
20-second wait time >= (health check (distributed node) interval + HTTP health check timeout) x health check (distributed node) count
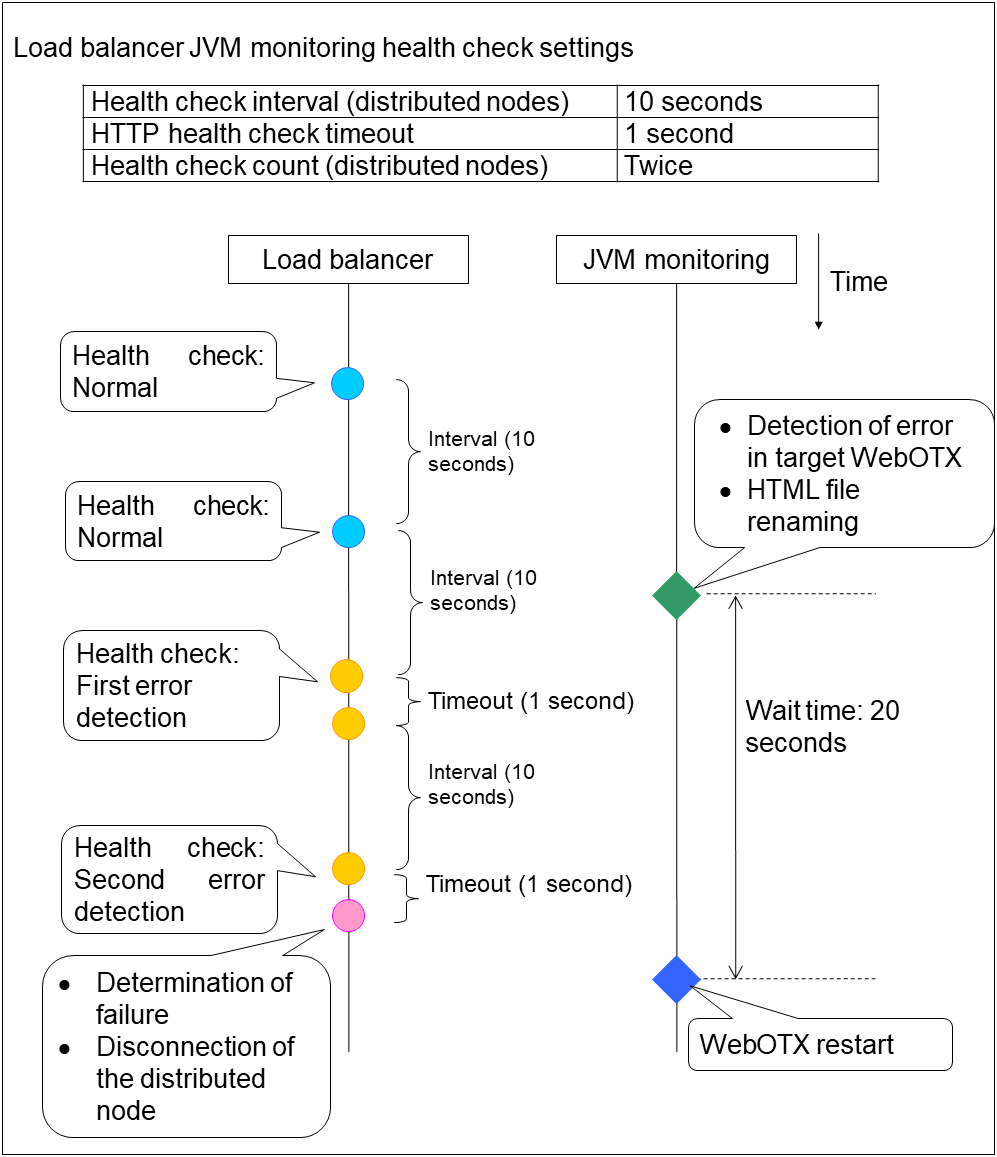
5.27.4. Linking with the load balancer (target Java VM load calculation function)
Target load balancer: InterSec/LB400*
To use the function, configure the settings through the Monitor(Special) tab. The CPU load-dependent weighting function of the load balancer is linked.
Properties - Monitor(special) tab -> Tuning Properties - Memory dialog box - Monitor Heap Memory Rate - Total Usage
Properties - Monitor(special) tab -> Tuning Properties - Load Balancer Linkage dialog box - Memory Pool Monitor
According to the following steps, first install the distributed node module on each server.
Note
Execute the command from an account having the Administrator privilege.
By using a registry editor, Please set the following registry key value Execute
x86_64 version
Registry key:
HKEY_LOCAL_MACHINE\SOFTWARE\Wow6432Node\NEC\IPLB4\Parameter\JVMSaver\ ... |
Description |
Value |
Default |
|---|---|---|---|
Enabled |
Enables or disables the function. |
0 or 1
0: Disable
1: Enable
|
0 |
JVMSaverCheckInterval |
Specify the execution interval for the target Java VM load calculation command, in seconds. |
1 to 2147483646 |
120 (seconds) |
ActionTimeout |
Specify the timeout for the target Java VM load calculation command, in seconds. |
1 to 2147483646 |
1800 (seconds) |
CommandPath |
Specify the path for the target Java VM load calculation command. |
Please specify below.
<EXPRESSCLUSTER install path> \ha\jra\bin\clpjra_lbadmin.bat weight
|
none |
Java VM load (%) = current memory usage (MB) x 100/threshold (MB)
For the distributed node module installed on a server on which JVM monitoring is running, commands are periodically executed to compare the obtained target Java VM load with the CPU load obtained separately, and to notify the load balancer of the higher load value as a CPU load. The load balancer distributes the traffic (requests) to the appropriate servers according to the CPU load of the distributed node.
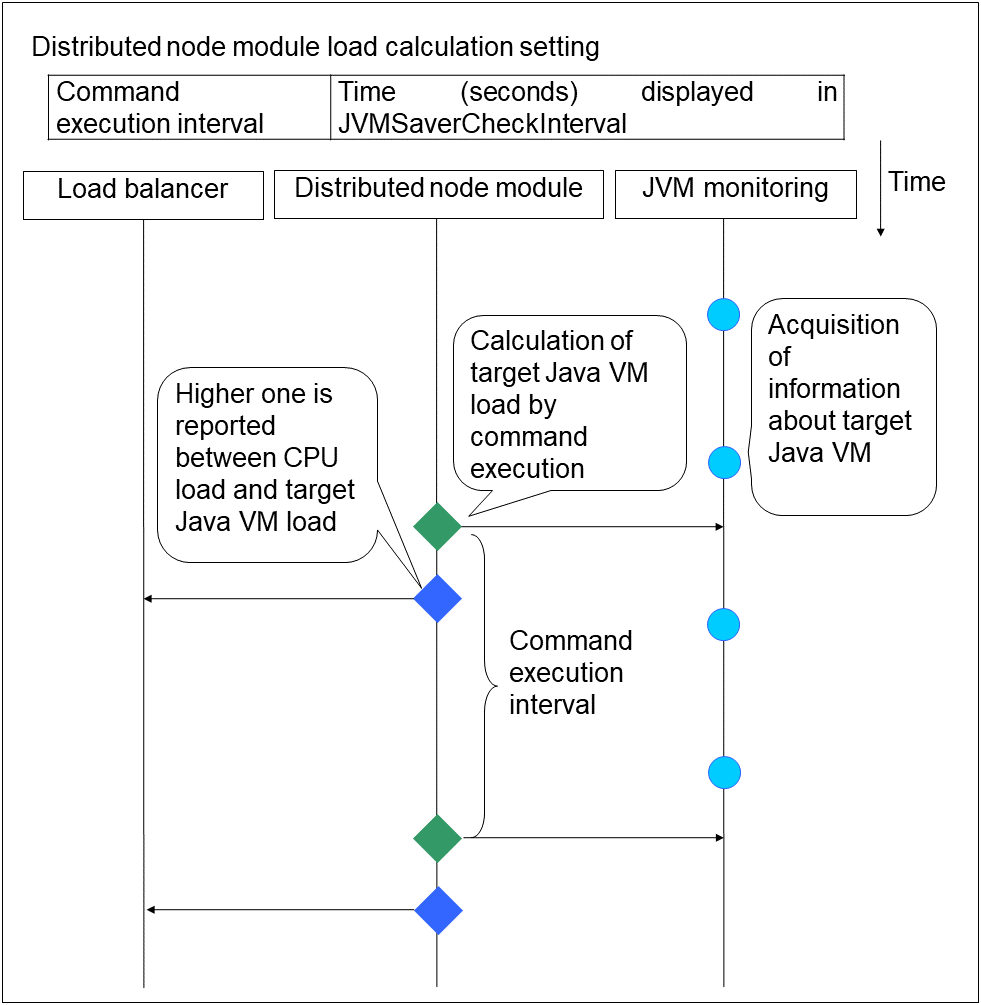
If you are using Windows, restart the iplb4 service by clicking Start -> Control Panel -> Administrative Tools -> Services.
5.27.5. Linking with the BIG-IP Local Traffic Manager
Target load balancer: BIG-IP Local Traffic Manager
The JVM monitor resource can link with BIG-IP LTM. Hereafter, the explanation assumes the use of Tomcat as the application server to be monitored. Linkage with BIG-IP LTM offers the distributed node control function and the target Java VM load calculation function.
The linkage between BIG-IP LTM and the JVM monitor resource is realized with the BIG-IP series API (iControl).
The distributed node is the load distribution server, and the linkage module is that which is installed in each distributed node. The linkage module is contained in Java Resource Agent.
To use the distributed node control function, specify the setting with Cluster WebUI Cluster Properties -> JVM monitor tab -> Load Balancer Linkage Settings dialog box, JVM monitor resource Properties - Monitor(special) tab - Tuning Properties - Load Balancer Linkage tab.
To use the target Java VM load calculation function, specify the setting with Cluster WebUI cluster properties -> JVM monitor tab -> Load Balancer Linkage Settings dialog box.
The following BIG-IP LTM linkage error message is output to the JVM operation log. For details, see "JVM monitor resource log output messages" in "Error messages" in the "Reference Guide" for EXPRESSCLUSER.
Error: Failed to operate clpjra_bigip.[error code]
If the relevant server configures the BIG-IP LTM load distribution system, when the JVM monitor detects a Tomcat failure (for example: the amount of collection information exceeds the specified threshold), iControl is used to update the BIG-IP LTM distributed node status from "enable" to "disable".
After updating the status of the distributed node of BIG-IP LTM, the JVM monitor waits until the number of connections of the distributed node falls to 0. After waiting, it executes Restart Command specified on the JVM monitor resource Properties - Monitor(special) tab -> Tuning Properties - Load Balancer Linkage tab. It does not execute the action specified by Restart Command if the number of connections of the distributed node does not fall to 0, even if Timeout elapses, as specified on the JVM monitor resource Properties - Monitor(special) tab -> Tuning Properties - Load Balancer Linkage tab.
When the JVM monitor detects a Tomcat failure recovery, it uses iControl to update the status of the BIG-IP LTM distributed node from "disable" to "enable." In this case, it does not execute the action specified by Restart Command specified on the JVM monitor resource Properties - Monitor(special) tab -> Tuning Properties - Load Balancer Linkage tab.
If the distributed node status is "disable", BIG-IP LTM determines the distributed node to be down and therefore disconnects it. Use of the distributed node control function requires no related setting for BIG-IP LTM.
The distributed node status is updated by BIG-IP LTM when the JVM monitor detects a failure or failure recovery. Therefore, after the failover generated by an operation other than JVM monitoring, the distributed node status of BIG-IP LTM may be "enable".
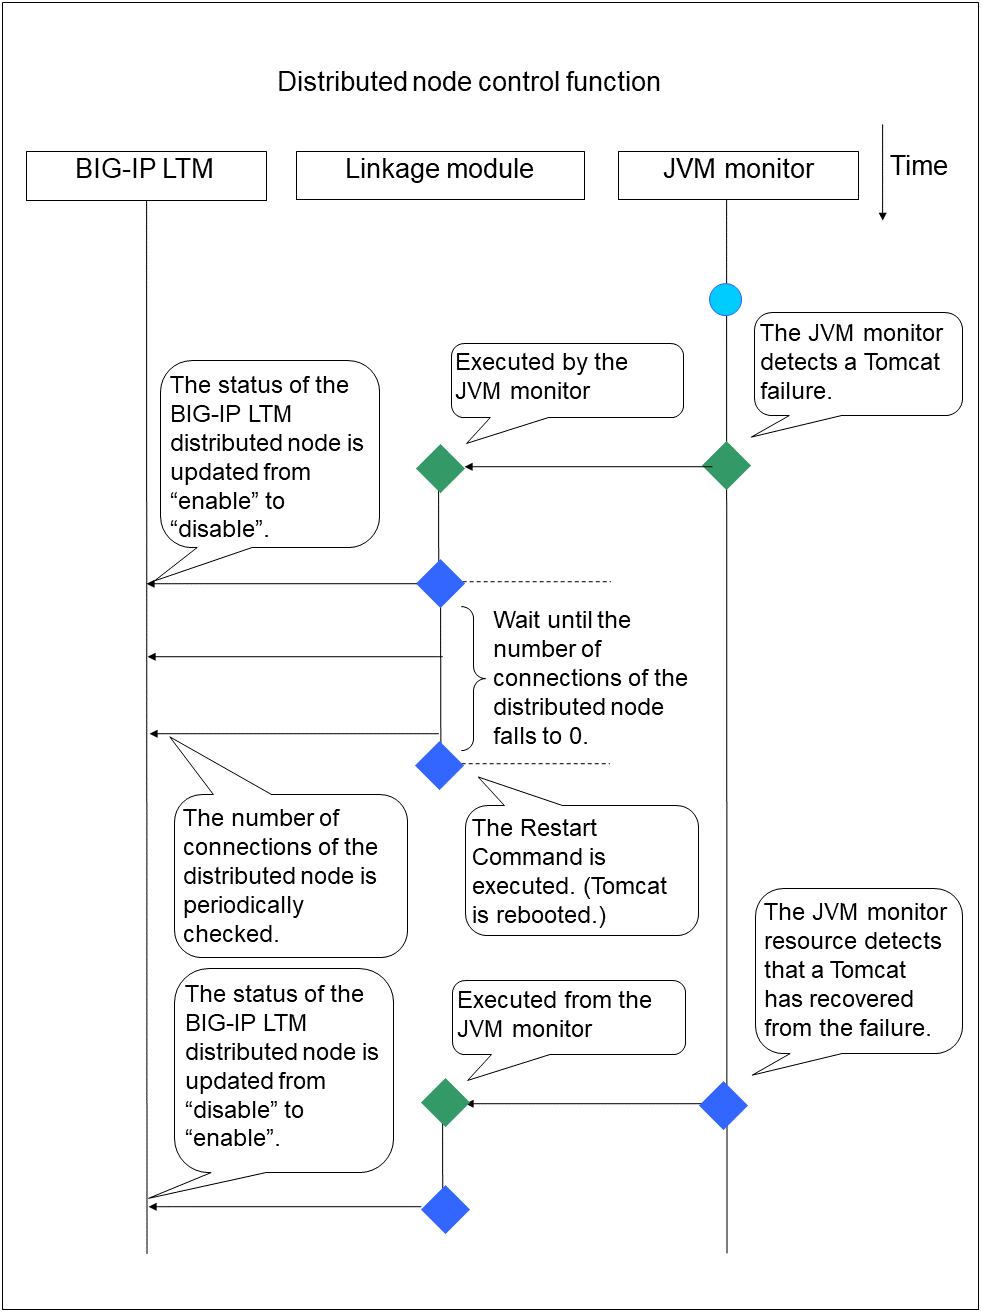
Java VM load (%) = current memory usage (MB) x 100/threshold (MB)
The linkage module installed on the server on which the JVM monitor runs executes a command at regular intervals, and reports the load collected on the target Java VM to BIG-IP LTM. BIG-IP LTM distributes the traffic (request) to the optimal server according to the load status of Java VM of the distributed node.
Set the following EXPRESSCLUSTER settings with the Cluster WebUI.
- JVM monitor resource
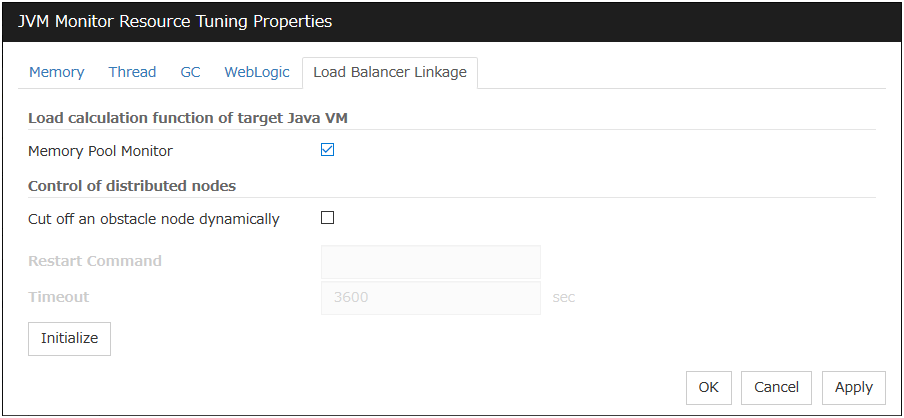 Properties - Monitor(special) tab -> Tuning Properties- Load Balancer Linkage tab
Select the Memory Pool Monitor check box.
- Custom monitor resource
Properties - Monitor(common) tab
Select the Monitor Timing - Always radio button.
Properties - Monitor(special) tab
Select Script created by this product(W). Select File - Edit and then add the following boldfaced section.
rem ***************************************
rem *           genw.bat                  *
rem ***************************************
echo START
"<Installation Path of EXPRESSCLUSTER >\ha\jra\bin\clpjra_bigip.exe" weight
echo EXIT
Select the Monitor Type - Synchronous radio button.
In the BIG-IP LTM setting, specify Ratio(node) in LocalTrafic - Pools:PoolList - Relevant pool - Members - LoadBalancing - Load Balancing Method of BIG-IP Configuration Utility
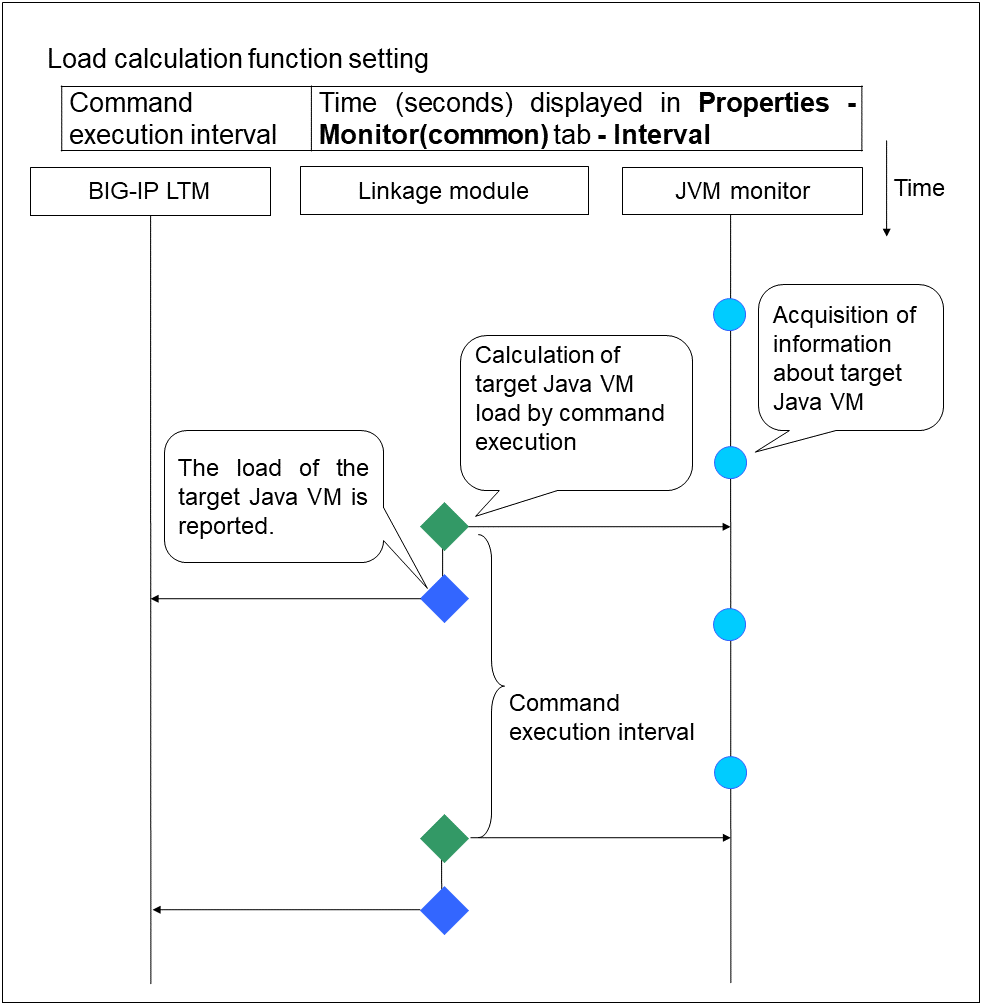
5.27.6. JVM statistical log
JVM monitor resources collect statistical information on the monitor target Java VM. The information is stored on CSV-format files, JVM statistical logs. The file is created in the following location:
<EXPRESSCLUSTER install path>\log\ha\jra\*.stat
The following table lists monitor items and their corresponding JVM statistical logs.
Monitor items |
Corresponding JVM statistical log |
|---|---|
[Memory] tab - [Monitor Heap Memory Rate]
[Memory] tab - [Monitor Non-Heap Memory Rate]
[Memory] tab-[Monitor Heap Memory Usage]
[Memory] tab -[Monitor Non-Heap Memory Usage]
|
jramemory.stat |
[Thread] tab - [Monitor the number of Active Threads] |
jrathread.stat |
[GC] tab - [Monitor the time in Full GC]
[GC] tab - [Monitor the count of Full GC execution]
|
jragc.stat |
[WebLogic] tab - [Monitor the requests in Work Manager]
[WebLogic] tab - [Monitor the requests in Thread Pool]
When either of the above monitor items is checked, both of the logs, such as wlworkmanager.stat and wlthreadpool.stat, are output. No functions to output only one of the two logs are provided.
|
wlworkmanager.stat
wlthreadpool.stat
|
5.27.7. Java memory area usage check on monitor target Java VM (jramemory.stat)
The jramemory.stat log file records the size of the Java memory area used by the monitor target Java VM. Its file name becomes either of the following two depending on the Rotation Type selected on the Log Output Setting dialog box.
When [Cluster Properties] - [JVM monitor] tab - [Log Output Setting] - [Rotation Type] - [File Capacity] is checked: jramemory<integer starting with 0>.stat
When [Cluster Properties] - [JVM monitor] tab - [Log Output Setting] - [Rotation Type] - [Period] is checked:
jramemory<YYYYMMDDhhmm>.stat
Its data formats are as follows.
No |
Format |
Description |
|---|---|---|
1 |
yyyy/mm/dd hh:mm:ss.SSS |
Date and time of log recording |
2 |
Half-size alphanumeric characters and symbols |
Name of the monitor target Java VM; it has been specified in [Properties] - [Monitor(special)] tab - [Identification name] in JVM monitor resources. |
3 |
Half-size alphanumeric characters and symbols |
Name of the Java memory pool; for details, refer to " 5.27.12. Java memory pool name". |
4 |
Half-size alphanumeric characters and symbols |
Type of the Java memory pool
Heap, Non-Heap
|
5 |
Half-size numeric characters |
Memory size that the Java VM requests from the OS at startup; it is expressed in bytes. (init)
At the startup of the monitor target Java VM, the size can be specified by the following Java VM startup options.
- HEAP:-Xms
- NON_HEAP permanent area (Perm Gen): -XX:PermSize
- NON_HEAP code cache area (Code Cache): -XX:InitialCodeCacheSize
|
6 |
Half-size numeric characters |
Memory size currently used by the Java VM; it is expressed in bytes. (used) |
7 |
Half-size numeric characters |
Memory size guaranteed for current use in operation of the Java VM; it is expressed in bytes. (committed)
This size varies depending on memory use; it is always equal to the value of "used" or larger but equal to the value of "max" or smaller.
|
8 |
Half-size numeric characters |
Maximum memory size that the Java VM can use; it is expressed in bytes. (max)
The size can be specified by the following Java VM startup options.
- HEAP:-Xmx
- NON_HEAP permanent area (Perm Gen): -XX:MaxPermSize
- NON_HEAP code cache area (Code Cache): -XX:ReservedCodeCacheSize
Example)
java -XX:MaxPermSize=128m -XX:ReservedCodeCacheSize=128m javaAP
In this example, max of NON_HEAP becomes 128 m + 128 m = 256 m.
(Note)
When the same value is specified for -Xms and -Xmx, "ini" may become larger than "max". This is because "max" of HEAP is determined by subtracting half the size of Survivor Space from the area size ensured by specification of -Xmx.
|
9 |
Half-size numeric characters |
Peak size of the memory used after startup of the measurement target Java VM; when the name of the Java memory pool is HEAP or NON_HEAP, this size becomes equal to that of the memory currently used by the Java VM (used). It is expressed in bytes. |
10 |
Half-size numeric characters |
Ignore this value when Oracle Java(usage monitoring) is selected for JVM Type.
When the item other than Oracle Java(usage monitoring) for JVM Type, memory size equal to "max" (No. 8 field) * the threshold (%) when the Java memory pool type (No. 4 field) is HEAP; it is expresed in bytes.
When the Java memory pool type is not HEAP, it is 0.
|
5.27.8. Thread operation status check on monitor target Java VM (jrathread.stat)
The jrathread.stat log file records the thread operation status of the monitor target Java VM. Its file name becomes either of the following two depending on the Rotation Type selected on the Log Output Setting dialog box.
When [Cluster Properties] - [JVM monitor] tab - [Log Output Setting] - [Rotation Type] - [File Capacity] is checked: jrathread<integer starting with 0>.stat
When [Cluster Properties] - [JVM monitor] tab - [Log Output Setting] - [Rotation Type] - [Period] is checked:
jrathread<YYYYMMDDhhmm>.stat
Its data formats are as follows.
No |
Format |
Description |
|---|---|---|
1 |
yyyy/mm/dd hh:mm:ss.SSS |
Date and time of log recording |
2 |
Half-size alphanumeric characters and symbols |
Name of the monitor target Java VM; it has been specified in [Properties] - [Monitor(special)] tab - [Identification name] in JVM monitor resources. |
3 |
Half-size alphanumeric characters and symbols |
The number of active threads in the monitor target Java VM |
4 |
[Half-size numeric characters: half-size numeric characters:...] |
Deadlocked thread ID in the monitor target Java VM; it contains the IDs of all deadlocked threads successively. |
5 |
Half-size alphanumeric characters and symbols |
Detailed information on deadlocked threads in the monitor target Java VM; it contains information on all deadlocked threads successively in the following format.
ThreadName, ThreadID, ThreadStatus, UserTime, CpuTime, WaitedCount, WaitedTime, isInNative, isSuspended <line feed>
stacktrace<line feed>
:
stacktrace<line feed>
stacktrace=ClassName, FileName, LineNumber, MethodName, isNativeMethod
|
5.27.9. GC operation status check on monitor target Java VM (jragc.stat)
The jragc.stat log file records the GC operation status of the monitor target Java VM. Its file name becomes either of the following two depending on the Rotation Type selected on the Log Output Setting dialog box.
When [Cluster Properties] - [JVM monitor] tab - [Log Output Setting] - [Rotation Type]-[File Capacity] is checked: jragc< integer starting with 0>.stat
When [Cluster Properties] - [JVM monitor] tab - [Log Output Setting] - [Rotation Type] - [Period] is checked:
jragc<YYYYMMDDhhmm>.stat
MarksweepCompact
MarkSweepCompact
PS Marksweep
ConcurrentMarkSweep
Its data formats are as follows.
No |
Format |
Description |
|---|---|---|
1 |
yyyy/mm/dd hh:mm:ss.SSS |
Date and time of log recording |
2 |
Half-size alphanumeric characters and symbols |
Name of the monitor target Java VM; it has been specified in [Properties] - [Monitor(special)] tab - [Identification name] in JVM monitor resources. |
3 |
Half-size alphanumeric characters and symbols |
GC name of the monitor target Java VM
When the monitor target Java VM is Oracle Java
The GC name to be indicated is one of the following.
Copy
MarksweepCompact
MarkSweepCompact
PS Scavenge
PS Marksweep
ParNew
ConcurrentMarkSweep
|
4 |
Half-size numeric characters |
Count of GC execution during the period from startup of the monitor target Java VM to measurement; the count includes GC executed before the JVM monitor resources starts monitoring. |
5 |
Half-size numeric characters |
Total time in GC during the period from startup of the monitor target Java VM to measurement; it is expressed in milliseconds. It includes time taken for GC executed before the JVM monitor resources starts monitoring. |
5.27.10. Operation status check on Work Manager of WebLogic Server (wlworkmanager.stat)
The wlworkmanager.stat log file records the operation status of the Work Manager of the WebLogic Server. Its file name becomes either of the following two depending on the Rotation Type selected on the Log Output Setting dialog box.
When [Cluster Properties] - [JVM monitor] tab - [Log Output Setting] - [Rotation Type] - [File Capacity] is checked: wlworkmanager<integer starting with 0>.stat
When [Cluster Properties] - [JVM monitor] tab - [Log Output Setting] - [Rotation Type] - [Period] is checked:
wlworkmanager<YYYYMMDDhhmm>.stat
Its data formats are as follows.
No |
Format |
Description |
|---|---|---|
1 |
yyyy/mm/dd hh:mm:ss.SSS |
Date and time of log recording |
2 |
Half-size alphanumeric characters and symbols |
Name of the monitor target Java VM; it has been specified in [Properties] - [Monitor(special)] tab - [Identification name] in JVM monitor resources. |
3 |
Half-size alphanumeric characters and symbols |
Application name |
4 |
Half-size alphanumeric characters and symbols |
Work Manager name |
5 |
Half-size numeric characters |
Count of request execution |
6 |
Half-size numeric characters |
The number of wait requests |
5.27.11. Operation status check on Thread Pool of WebLogic Server (wlthreadpool.stat)
The wlthreadpool.stat log file records the operation status of the thread pool of the WebLogic Server. Its file name becomes either of the following two depending on the Rotation Type selected on the Log Output Setting dialog box.
When [Cluster Properties] - [JVM monitor] tab - [Log Output Setting] - [Rotation Type] - [File Capacity] is checked:wlthreadpool< integer starting with 0>.stat
When [Cluster Properties] - [JVM monitor] tab - [Log Output Setting] - [Rotation Type] - [Period] is checked: wlthreadpool<YYYYMMDDhhmm>.stat
Its data formats are as follows.
No |
Format |
Description |
|---|---|---|
1 |
yyyy/mm/dd hh:mm:ss.SSS |
Date and time of log recording |
2 |
Half-size alphanumeric characters and symbols |
Name of the monitor target Java VM; it has been specified in [Properties] - [Monitor(special)] tab - [Identification name] in JVM monitor resources. |
3 |
Half-size numeric characters |
Total count of request execution |
4 |
Half-size numeric characters |
The number of requests queued in the WebLogic Server |
5 |
Half-size numeric characters |
Count of request execution per unit time (second) |
6 |
Half-size numeric characters |
The total number of threads for executing the application |
7 |
Half-size numeric characters |
The number of threads in an idle state |
8 |
Half-size numeric characters |
The number of executing threads |
9 |
Half-size numeric characters |
The number of threads in a stand-by state |
5.27.12. Java memory pool name
This section describes the Java memory pool name outputted as memory_name in messages to the JVM operation log file. It also describes the Java memory pool name outputted to a JVM statistical log file, jramemory.stat log file.
The character strings of Java memory pool names are not determined by JVM monitor resources. Character strings received from the monitor target Java VM are output as Java memory pool names.
Their specifications are not open for Java VM, and accordingly, are subject to change without notice in a version upgrade of Java VM.
Therefore, we do not recommend monitoring Java memory pool names contained in messages.
The following monitor items refer to parameters in the [Memory] tab of the [Monitor(special)] tab in the [Properties] of the JVM monitor resources.
The following memory pool names have been confirmed on actual machines operating on Oracle Java.
When Oracle Java is selected for JVM Type and "-XX:+UseSerialGC" is specified as a startup option of the monitor target Java VM, the No. 3 Java memory pool name in the jramemory.stat log file appears as follows.
Monitor item |
Character string outputted as memory_name |
|---|---|
[Monitor Heap Memory Rate] - [Total Usage] |
HEAP |
[Monitor Heap Memory Rate] - [Eden Space] |
Eden Space |
[Monitor Heap Memory Rate] - [Survivor Space] |
Survivor Space |
[Monitor Heap Memory Rate] - [Tenured Gen] |
Tenured Gen |
[Monitor Non-Heap Memory Rate] - [ Total Usage] |
NON_HEAP |
[Monitor Non-Heap Memory Rate] - [Code Cache] |
Code Cache |
[Monitor Non-Heap Memory Rate] - [Perm Gen] |
Perm Gen |
[Monitor Non-Heap Memory Rate] - [Perm Gen[shared-ro]] |
Perm Gen [shared-ro] |
[Monitor Non-Heap Memory Rate] - [Perm Gen[shared-rw]] |
Perm Gen [shared-rw] |
When Oracle Java is selected for JVM Type and "-XX:+UseParallelGC" and "-XX:+UseParallelOldGC" are specified as startup options of the monitor target Java VM, the No. 3 Java memory pool name in the jramemory.stat log file appears as follows.
Monitor item |
Character string outputted as memory_name |
|---|---|
[Monitor Heap Memory Rate] - [Total Usage] |
HEAP |
[Monitor Heap Memory Rate] - [Eden Space] |
PS Eden Space |
[Monitor Heap Memory Rate] - [Survivor Space] |
PS Survivor Space |
[Monitor Heap Memory Rate] - [Tenured Gen] |
PS Old Gen |
[Monitor Non-Heap Memory Rate] - [Total Usage] |
NON_HEAP |
[Monitor Non-Heap Memory Rate] - [Code Cache] |
Code Cache |
[Monitor Non-Heap Memory Rate] - [Perm Gen] |
PS Perm Gen |
[Monitor Non-Heap Memory Rate] - [Perm Gen[shared-ro]] |
Perm Gen [shared-ro] |
[Monitor Non-Heap Memory Rate] - [Perm Gen[shared-rw]] |
Perm Gen [shared-rw] |
When Oracle Java is selected for JVM Type and "-XX:+UseConcMarkSweepGC" is specified as a startup option of the monitor target Java VM, the No. 3 Java memory pool name in the jramemory.stat log file appears as follows.
Monitor item |
Character string outputted as memory_name |
|---|---|
[Monitor Heap Memory Rate] - [Total Usage] |
HEAP |
[Monitor Heap Memory Rate] - [Eden Space] |
Par Eden Space |
[Monitor Heap Memory Rate] - [Survivor Space] |
Par Survivor Space |
[Monitor Heap Memory Rate] - [Tenured Gen] |
CMS Old Gen |
[Monitor Non-Heap Memory Rate] - [Total Usage] |
NON_HEAP |
[Monitor Non-Heap Memory Rate] - [Code Cache] |
Code Cache |
[Monitor Non-Heap Memory Rate] - [Perm Gen] |
CMS Perm Gen |
[Monitor Non-Heap Memory Rate] - [Perm Gen[shared-ro]] |
Perm Gen [shared-ro] |
[Monitor Non-Heap Memory Rate] - [Perm Gen[shared-rw]] |
Perm Gen [shared-rw] |
When [Oracle Java(usage monitoring)] is selected for [JVM Type] and "-XX:+UseSerialGC" is specified as a startup option for the monitor target Java VM, the No. 3 Java memory pool name in the jramemory.stat file will be as follows.
Monitor item |
Character string output as memory_name |
|---|---|
[Monitor Heap Memory Usage]-[Total Usage] |
HEAP |
[Monitor Heap Memory Usage]-[Eden Space] |
Eden Space |
[Monitor Heap Memory Usage]-[Survivor Space] |
Survivor Space |
[Monitor Heap Memory Usage]-[Tenured Gen] |
Tenured Gen |
[Monitor Non-Heap Memory Usage]-[Total Usage] |
NON_HEAP |
[Monitor Non-Heap Memory Usage]-[Code Cache] |
Code Cache (For Java 9, no output) |
[Monitor Non-Heap Memory Usage]-[Metaspace] |
Metaspace |
[Monitor Non-Heap Memory Usage]-[CodeHeap non-nmethods] |
CodeHeap non-nmethods |
[Monitor Non-Heap Memory Usage]-[CodeHeap profiled] |
CodeHeap profiled nmethods |
[Monitor Non-Heap Memory Usage]-[CodeHeap non-profiled] |
CodeHeap non-profiled nmethods |
[Monitor Non-Heap Memory Usage]-[Compressed Class Space] |
Compressed Class Space |
When [Oracle Java(usage monitoring)] is selected for [JVM Type] and "-XX:+UseParallelGC" and "-XX:+UseParallelOldGC" are specified as startup options for the monitor target Java VM, the No. 3 Java memory pool name in the jramemory.stat file will be as follows.
Monitor item |
Character string output as memory_name |
|---|---|
[Monitor Heap Memory Usage]-[Total Usage] |
HEAP |
[Monitor Heap Memory Usage]-[Eden Space] |
PS Eden Space |
[Monitor Heap Memory Usage]-[Survivor Space] |
PS Survivor Space |
[Monitor Heap Memory Usage]- [Tenured Gen] |
PS Old Gen |
[Monitor Non-Heap Memory Usage]-[Total Usage] |
NON_HEAP |
[Monitor Non-Heap Memory Usage]-[Code Cache] |
Code Cache (For Java 9, no output) |
[Monitor Non-Heap Memory Usage]- [Metaspace] |
Metaspace |
[Monitor Non-Heap Memory Usage]-[CodeHeap non-nmethods] |
CodeHeap non-nmethods |
[Monitor Non-Heap Memory Usage]-[CodeHeap profiled] |
CodeHeap profiled nmethods |
[Monitor Non-Heap Memory Usage]-[CodeHeap non-profiled] |
CodeHeap non-profiled nmethods |
[Monitor Non-Heap Memory Usage]-[Compressed Class Space] |
Compressed Class Space |
When [Oracle Java(usage monitoring)] is selected for [JVM Type] and "-XX:+UseConcMarkSweepGC" is specified as a startup option for the monitor target Java VM, the No. 3 Java memory pool name in the jramemory.stat file will be as follows.
Monitor item |
Character string output as memory_name |
|---|---|
[Monitor Heap Memory Usage]-[Total Usage] |
HEAP |
[Monitor Heap Memory Usage]-[Eden Space] |
Par Eden Space |
[Monitor Heap Memory Usage]-[Survivor Space] |
Par Survivor Space |
[Monitor Heap Memory Usage]-[Tenured Gen] |
CMS Old Gen |
[Monitor Non-Heap Memory Usage]-[Total Usage] |
NON_HEAP |
[Monitor Non-Heap Memory Usage]-[Code Cache] |
Code Cache (For Java 9, no output) |
[Monitor Non-Heap Memory Usage]- [Metaspace] |
Metaspace |
[Monitor Non-Heap Memory Usage]-[CodeHeap non-nmethods] |
CodeHeap non-nmethods |
[Monitor Non-Heap Memory Usage]-[CodeHeap profiled] |
CodeHeap profiled nmethods |
[Monitor Non-Heap Memory Usage]-[CodeHeap non-profiled] |
CodeHeap non-profiled nmethods |
[Monitor Non-Heap Memory Usage]-[Compressed Class Space] |
Compressed Class Space |
When [Oracle Java(usage monitoring)] is selected for [JVM Type] and "-XX:+UseParNewGC" is added as a startup option of the target Java VM, the No. 3 Java memory pool name in the jramemory.stat file will be as follows. For Java 9, if -XX:+UseParNewGC is specified, the monitor target Java VM does not start.
Monitor item |
Character string output as memory_name |
|---|---|
[Monitor Heap Memory Usage]-[Total Usage] |
HEAP |
[Monitor Heap Memory Usage]-[Eden Space] |
Par Eden Space |
[Monitor Heap Memory Usage]-[Survivor Space] |
Par Survivor Space |
[Monitor Heap Memory Usage]-[Tenured Gen] |
Tenured Gen |
[Monitor Non-Heap Memory Usage]-[Total Usage] |
NON_HEAP |
[Monitor Non-Heap Memory Usage]-[Code Cache] |
Code Cache |
[Monitor Non-Heap Memory Usage]-[ Metaspace] |
Metaspace |
[Monitor Non-Heap Memory Usage]-[CodeHeap non-nmethods] |
CodeHeap non-nmethods |
[Monitor Non-Heap Memory Usage]-[CodeHeap profiled] |
CodeHeap profiled nmethods |
[Monitor Non-Heap Memory Usage]-[CodeHeap non-profiled] |
CodeHeap non-profiled nmethods |
[Monitor Non-Heap Memory Usage]-[Compressed Class Space] |
Compressed Class Space |
When [Oracle Java(usage monitoring)] is selected for [JVM Type] and "-XX::+UseG1GC" is specified as a startup option for the monitor target Java VM the No. 3 Java memory pool name in the jramemory.stat file will be as follows.
Monitor item |
Character string output as memory_name |
|---|---|
[Monitor Heap Memory Usage]-[Total Usage] |
HEAP |
[Monitor Heap Memory Usage]-[Eden Space] |
G1 Eden Space |
[Monitor Heap Memory Usage]-[Survivor Space] |
G1 Survivor Space |
[Monitor Heap Memory Usage]-[ Tenured Gen(Old Gen)] |
G1 Old Gen |
[Monitor Non-Heap Memory Usage]-[Total Usage] |
NON_HEAP |
[Monitor Non-Heap Memory Usage]-[Code Cache] |
Code Cache (For Java 9, no output) |
[Monitor Non-Heap Memory Usage]-[ Metaspace] |
Metaspace |
[Monitor Non-Heap Memory Usage]-[CodeHeap non-nmethods] |
CodeHeap non-nmethods |
[Monitor Non-Heap Memory Usage]-[CodeHeap profiled] |
CodeHeap profiled nmethods |
[Monitor Non-Heap Memory Usage]-[CodeHeap non-profiled] |
CodeHeap non-profiled nmethods |
[Monitor Non-Heap Memory Usage]-[Compressed Class Space] |
Compressed Class Space |
Java memory pool names appearing in the jramemory.stat log file, a JVM statistical log file, correspond to the Java VM memory space as follows.
For Oracle Java 7
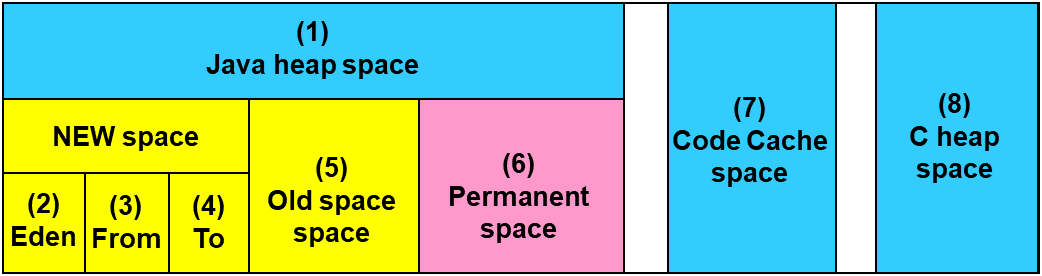
Number in diagram
Monitor item
Java memory pool name in jramemory.stat log file
(1)
[Monitor Heap Memory Rate] - [Total Usage]
HEAP
(2)
[Monitor Heap Memory Rate] - [Eden Space]
EdenSpacePS Eden SpacePar Eden Space(3)+(4)
[Monitor Heap Memory Rate] - [Survivor Space]
Survivor SpacePS Survivor SpacePar Survivor Space(5)
[Monitor Heap Memory Rate]-[Tenured Gen]
Tenured GenPS Old GenCMS Old Gen(6)
[Monitor Non-Heap Memory Rate]-[Perm Gen][Monitor Non-Heap Memory Rate]-[Perm Gen[shared-ro]][Monitor Non-Heap Memory Rate]-[Perm Gen[shared-rw]]Perm GenPerm Gen [shared-ro]Perm Gen [shared-rw]PS Perm GenCMS Perm Gen(7)
[Monitor Non-Heap Memory Rate]-[Code Cache]
Code Cache
(8)
(6)+(7)
[Monitor Non-Heap Memory Rate]-[Total Usage]
NON_HEAP* No stack trace is included.For Oracle Java 8/Oracle Java 9
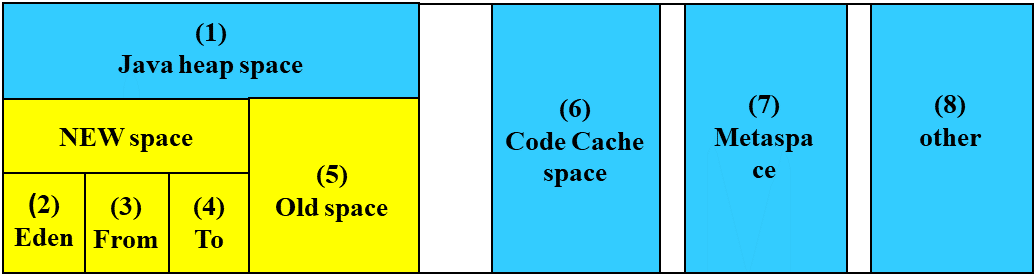
Number in diagram
Monitor item
Java memory pool name in jramemory.stat log file
(1)
[Monitor Heap Memory Usage] - [Total Usage]
HEAP
(2)[Monitor Heap Memory Usage] - [Eden Space]EdenSpacePS Eden SpacePar Eden SpaceG1 Eden Space(3)+(4)[Monitor Heap Memory Usage] - [Survivor Space]Survivor SpacePS Survivor SpacePar Survivor SpaceG1 Survivor Space(5)[Monitor Heap Memory Usage] - [Tenured Gen]Tenured GenPS Old GenCMS Old GenG1 Old Gen(6)
[Monitor Non-Heap Memory Usage] - [Code Cache]
Code Cache
(6)
[Monitor Non-Heap Memory Usage]-[CodeHeap non-nmethods]
CodeHeap non-nmethods (Only for Java 9, it is output.)
(6)
[Monitor Non-Heap Memory Usage]-[CodeHeap profiled]
CodeHeap profiled nmethods (Only for Java 9, it is output.)
(6)
[Monitor Non-Heap Memory Usage]-[CodeHeap non-profiled]
CodeHeap non-profiled nmethods (Only for Java 9, it is output.)
(7)
[Monitor Non-Heap Memory Usage] - [Metaspace]
Metaspace
(8)
[Monitor Non-Heap Memory Usage]-[Compressed Class Space]
Compressed Class Space.
(6)+(7)+(8)
[Monitor Non-Heap Memory Usage] - [Total Usage]
NON_HEAP
5.27.13. Executing command corresponding to cause of each detected error
Error cause |
Setting item |
|---|---|
- Failure in connection to the monitor target Java VM
- Failure in resource measurement
|
[Monitor(special)] tab - [Command]
|
- Heap memory rate
- Non-heap memory rate
- Heap memory usage
- Non-heap memory usage
|
[Monitor(special)] tab - [Tuning] properties - [Memory] tab - [Command]
|
|
[Monitor(special)] tab - [Tuning] properties - [Thread] tab - [Command] |
- Time in Full GC
- Count of Full GC execution
|
[Monitor(special)] tab - [Tuning] properties - [GC] tab - [Command]
|
- Requests in Work Manager of WebLogic
- Requests in Thread Pool of WebLogic
|
[Monitor(special)] tab - [Tuning] properties - [WebLogic] tab - [Command]
|
Details of error causes |
Character string for argument |
|---|---|
- Failure in connection to the monitor target Java VM
- Failure in resource measurement
|
No character string defined
|
[Monitor(special)] tab - [Tuning] properties - [Memory] tab - [Monitor Memory Heap Rate] - [Total Usage]
(For Oracle Java)
|
HEAP
|
[Memory] tab - [Monitor Memory Heap Rate] - [Eden Space]
(For Oracle Java)
|
EdenSpace
PSEdenSpace
ParEdenSpace
|
[Memory] tab - [Monitor Memory Heap Rate] - [Survivor Space]
(For Oracle Java)
|
SurvivorSpace
PSSurvivorSpace
ParSurvivorSpace
|
[Memory] tab - [Monitor Memory Heap Rate] - [Tenured Gen]
(For Oracle Java)
|
TenuredGen
PSOldGen
CMSOldGen
|
[Memory] tab - [Monitor Non-Heap Memory Rate] - [ Total Usage]
(For Oracle Java)
|
NON_HEAP
|
[Memory] tab - [Monitor Memory Non-Heap Rate] - [Code Cache]
(For Oracle Java)
|
CodeCache
|
[Memory] tab - [Monitor Memory Non-Heap Rate] - [Perm Gen]
(For Oracle Java)
|
PermGen
PSPermGen
CMSPermGen
|
[Memory] tab - [Monitor Memory Non-Heap Rate] - [Perm Gen[shared-ro]]
(For Oracle Java)
|
PermGen[shared-ro]
|
[Memory] tab - [Monitor Memory Non-Heap Rate] - [Perm Gen[shared-rw]]
(For Oracle Java)
|
PermGen[shared-rw]
|
[Memory] tab - [Monitor Heap Memory Usage]-[Total Usage]
(Oracle Java(usage monitoring))
|
HEAP
|
[Memory] tab - [Monitor Heap Memory Usage]-[Eden Space]
(Oracle Java(usage monitoring))
|
EdenSpace
PSEdenSpace
ParEdenSpace
G1EdenSpace
|
[Memory] tab - [Monitor Heap Memory Usage]-[Survivor Space]
(Oracle Java(usage monitoring))
|
SurvivorSpace
PSSurvivorSpace
ParSurvivorSpace
G1SurvivorSpace
|
[Memory] tab - [Monitor Heap Memory Usage]-[Tenured Gen]
(Oracle Java(usage monitoring))
|
TenuredGen
PSOldGen
CMSOldGen
G1OldGen
|
[Memory] tab - [Monitor Non-Heap Memory Usage]-[Total Usage]
(Oracle Java(usage monitoring))
|
NON_HEAP
|
[Memory] tab - [Monitor Non-Heap Memory Usage]-[Code Cache]
(Oracle Java(usage monitoring))
|
CodeCache
|
[Memory] tab - [Monitor Non-Heap Memory Usage]-[Metaspace]
(Oracle Java(usage monitoring))
|
Metaspace
|
[Thread] tab - [Monitor the number of Active Threads] |
Count |
[GC] tab - [Monitor the time in Full GC] |
Time |
[GC] tab - [Monitor the count of Full GC execution] |
Count |
[WebLogic] tab - [Monitor the requests in Work Manager] - [Waiting Requests, The number] |
WorkManager_PendingRequests |
[WebLogic] tab - [Monitor the requests in Thread Pool] - [ Waiting Requests, The number] |
ThreadPool_PendingUserRequestCount |
[WebLogic] tab - [ Monitor the requests in Thread Pool] - [Executing Requests, The number] |
ThreadPool_Throughput |
The following are examples of execution.
Example 1)
Setting item |
Setting information |
|---|---|
[Monitor(special)] tab - [Tuning] properties - [GC] tab - [Command] |
\Program Files\bin\command.bat |
[Monitor(special)] tab - [Tuning] properties - [GC] tab - [Monitor the count of Full GC execution] |
1 |
[Cluster] properties - [JVM monitor] tab - [Resource Measurement Setting] - [Common] tab - [Error Threshold] |
3 |
If Full GC is executed successively as many times as specified by the Error Threshold (three times), JVM monitor resources will detect a monitor error and execute a command corresponding to \Program Files\bin\command.bat Count.
Example 2)
Setting item |
Setting information |
|---|---|
[Monitor(special)] tab - [Tuning] properties - [GC] tab - [Command] |
\Program Files\bin\command.bat GC |
[Monitor(special)] tab - [Tuning] properties - [GC] tab - [ Monitor the time in Full GC] |
65536 |
[Cluster] properties - [JVM monitor] tab - [Resource Measurement Setting] - [Common] tab - [Error Threshold] |
3 |
If the time in Full GC exceeds 65535 milliseconds successively as many times as specified by the Error Threshold (three times), JVM monitor resources will detect a monitor error and execute a command corresponding to "\Program Files\bin\command.bat GC Time".
Example 3)
Setting item |
Setting information |
|---|---|
[Monitor(special)] tab - [Tuning] properties - [Memory] tab - [Command] |
\Program Files\bin\command.bat memory |
[Monitor(special)] tab - [Tuning] properties - [Memory] tab - [Monitor Heap Memory Rate] |
On |
[Monitor(special)] tab - [Tuning] properties - [Memory] tab - [Eden Space] |
80 |
[Monitor(special)] tab - [Tuning] properties - [Memory] tab - [Survivor Space] |
80 |
[Cluster] properties - [JVM monitor] tab - [Resource Measurement Setting] - [Common] tab - [Error Threshold] |
3 |
"\Program Files\bin\command.bat memory EdenSpace SurvivorSpace".action thread execution did not finish. action is alive = <command>
Note the following cautions.
No [Command] is executed when restoration of the Java VM to normal operation (error -> normal operation) is detected.
A [Command] is executed upon detection of an error of the Java VM (when threshold crossing occurs successively as many times as specified by the error threshold). It is not executed at each threshold crossing.
Note that specifying a [Command] on multiple tabs allows multiple commands to be executed if multiple errors occur simultaneously, causing a large system load.
A [Command] may be executed twice simultaneously when the following two items are monitored: [Monitor(special)] tab - [Tuning] properties - [WebLogic] tab - [Monitor the requests in Work Manager] - [Waiting Requests, The Number]; [Monitor(special)] tab - [Tuning] properties - [WebLogic] tab - [Monitor the requests in Work Manager] - [Waiting Requests, Average].
This is because errors may be detected simultaneously on the following two items: [Cluster] properties - [JVM monitor] tab - [Resource Measurement Setting] - [WebLogic] tab - [Interval, The number of request]; [Cluster] properties - [JVM monitor] tab - [Resource Measurement Setting] - [WebLogic] tab - [Interval, The average number of the request]. To avoid this phenomenon, specify only one of the two items as a monitor target. This applies to the following combinations of monitor items.
[Monitor(special)] tab - [Tuning] properties - [WebLogic] tab - [Monitor the requests in Thread Pool] - [Waiting Requests, The Number] and [Monitor(special)] tab - [Tuning] properties - [WebLogic] tab - [Monitor the requests in Thread Pool] - [Waiting Requests, Average]
[Monitor(special)] tab - [Tuning] properties - [WebLogic] tab - [Monitor the requests in Thread Pool] - [Executing Requests, The Number] and [Monitor(special)] tab - [Tuning] properties - [WebLogic] tab - [Monitor the requests in Thread Pool] - [Executing Requests, Average]
5.27.14. Monitoring WebLogic Server
For how to start the operation of the configured target WebLogic Server as an application server, see the manual for WebLogic Server.
This section describes only the settings required for monitoring by the JVM monitor resource.
- Start WebLogic Server Administration Console.For how to start WebLogic Server Administration Console, refer to "Overview of Administration Console" in the WebLogic Server manual.Select Domain Configuration-Domain-Configuration-General. Make sure that Enable Management Port is unchecked.
Select Domain Configuration-Server, and then select the name of the server to be monitored. Set the selected server name as the identifier on the Monitor(Special) tab from Properties that can be selected in the config mode of Cluster WebUI.
Regarding the target server, select Configuration-General, and then check the port number though which a management connection is established with Listen Port.
Stop WebLogic Server. For how to stop WebLogic Server, refer to "Starting and stopping WebLogic Server" in the WebLogic Server manual.
Open the WebLogic Server startup script.
Write the following instructions in the script.
When the target is the WebLogic Server managing server:
set JAVA_OPTIONS=%JAVA_OPTIONS%
-Dcom.sun.management.jmxremote.port=n
-Dcom.sun.management.jmxremote.ssl=false
-Dcom.sun.management.jmxremote.authenticate=false
-Djavax.management.builder.initial=weblogic.management.jmx.mbeanserver.WLSMBeanServerBuilder
*Write each line of coding on one line.
Note
For n, specify the number of the port used for monitoring. The specified port number must be different from that of the listen port for the target Java VM. If there are other target WebLogic Server entities on the same machine, specify a port number different from those for the listening port and application ports of the other entities.
When the target is a WebLogic Server managed server:
if "%SERVER_NAME%" == "SERVER_NAME"(
    set JAVA_OPTIONS=%JAVA_OPTIONS%
-Dcom.sun.management.jmxremote.port=n
-Dcom.sun.management.jmxremote.ssl=false
-Dcom.sun.management.jmxremote.authenticate=false
-Djavax.management.builder.initial=weblogic.management.jmx.mbeanserver.WLSMBeanServerBuilder
)
*Write all the if statement lines on one line.
Note
For SERVER_NAME, specify the name of the target server confirmed by Select Target Server. If more than one server is targeted, change the server name on the settings (line 1 to 6) for each server.
Note
Place the above addition prior to the following coding:
%JAVA_HOME%\bin\java %JAVA_VM% %MEM_ARGS%
-Dweblogic.Name=%SERVER_NAME%
-Djava.security.policy=%WL_HOME%\server\lib\weblogic.policy %JAVA_OPTIONS
% %PROXY_SETTINGS% %SERVER_CLASS%
*Write the above coding on one line.
- If monitoring a request of work manager and thread pool, configure the following settings:Start WLST (wlst.cmd) of the target WebLogic Server.To do this, select Start menu-Oracle WebLogic-WebLogic Server <version number>-Tools-WebLogic Scripting Tool.On the prompt window displayed, execute the following commands.
> connect('USERNAME','PASSWORD','t3://SERVER_ADDRESS:SERVER_PORT')
> edit()
> startEdit()
> cd('JMX/DOMAIN_NAME')
> set('PlatformMBeanServerUsed','true')
> activate()
> exit()
Replace the USERNAME, PASSWORD, SERVER_ADDRESS, SERVER_PORT, and DOMAIN_NAME with those for the domain environment.
Restart the target WebLogic Server.
5.27.15. Monitoring WebOTX
This section describes how to configure a target WebOTX to enable monitoring by the JVM monitor resource.
Start the WebOTX Administration Console. For how to start the WebOTX Administration Console, refer to "Starting the console" in the "WebOTX Operation (Web Administration Console)".
The settings differ depending on whether a Java process of the JMX agent running on WebOTX or the Java process of a process group is to be monitored. Configure the settings according to the target of monitoring.
5.27.16. Monitoring a Java process of the WebOTX domain agent
There is no need to specify any settings.
5.27.17. Monitoring a Java process of a WebOTX process group
Connect to the domain by using the administration console.
In the tree view, select <domain_name>-TP System-Application Group-<application_group_name>-Process Group-<process_group_name>.
For the Other Arguments attributes on the JVM Options tab on the right, specify the following Java options on one line. For n, specify the port number. If there is more than one Java VM to be monitored on the same machine, specify a unique port number. The port number specified for the settings is specified with Cluster WebUI (Monitor Resource Properties - Monitor(special) tab - Connection Port).
-Dcom.sun.management.jmxremote.port=n
-Dcom.sun.management.jmxremote.ssl=false
-Dcom.sun.management.jmxremote.authenticate=false
-Djavax.management.builder.initial=com.nec.webotx.jmx.mbeanserver.JmxMBeanServerBuilder
* In the case of WebOTX V9.2 or later, it is unnecessary to specify -Djavax.management.builder.initial.
- Then, click Update. After the configuration is completed, restart the process group.These settings can be made by using Java System Properties, accessible from the Java System Properties tab of the WebOTX administration console. When making these settings by using the console, do not designate "-D" and set the strings prior to "=" in "name" and set the strings subsequent to "=" in "value".
Note
If restart upon a process failure is configured as a function of the WebOTX process group, and when the process group is restarted as the recovery processing by EXPRESSCLUSTER, the WebOTX process group may fail to function correctly. For this reason, when monitoring the WebOTX process group, make the following settings for the JVM monitor resource by using the Cluster WebUI.
Tab name for setting |
Item name |
Setting value |
|---|---|---|
Monitor(common) |
Monitor Timing |
Always |
Recovery Action |
Recovery Action |
Execute only the final action |
Recovery Action |
Final Action |
No operation |
Linking with the load balancer is not supported for WebOTX process group monitoring.
5.27.18. Receiving WebOTX notifications
By registering a specific listener class, notification is issued when WebOTX detects a failure. The JVM monitor resource receives the notification and outputs the following message to the JVM operation log.
%1$s:Notification received. %2$s.
%1$s and %2$s each indicates the following:
%1$s: Monitored Java VM
%2$s: Message in the notification (ObjectName=,type=,message=)
At present, the following is the detailed information on MBean on the monitorable resource.
ObjectName
[domainname]:j2eeType=J2EEDomain,name=[domainname],category=runtime
notification type
nec.webotx.monitor.alivecheck.not-alive
Message
failed
5.27.19. Monitoring Tomcat
This section describes how to configure a target Tomcat to be monitored by the JVM monitor resource.
Stop Tomcat, and then open Start -> (Tomcat_Program_folder) -> Configure Tomcat.
In the Java Options of Java of the open window, specify the following settings on one line. For n, specify the port number. If there is more than one Java VM to be monitored on the same machine, specify a unique port number. The port number specified for the settings is specified with Cluster WebUI (Monitor Resource Properties -> Monitor(special) tab -> Connection Port).
-Dcom.sun.management.jmxremote.port=n
-Dcom.sun.management.jmxremote.ssl=false
-Dcom.sun.management.jmxremote.authenticate=false
Save the settings, and then start Tomcat.
With Cluster WebUI (JVM Monitor Resource Name -> Properties -> Monitor(special) tab -> Identifier), specify a unique string that is different from those for the other monitor targets (e.g., tomcat).
5.27.20. Monitoring SVF
This section describes how to configure a target SVF to be monitored by the JVM monitor resource.
Select a monitor target from the following, and then use an editor to open the file.
Monitor target
File to be edited
Report Director EnterpriseServer
<SVF installation path>\launcher\ReportDirectorEnterpriseServer.runReport Director Svf Server
<SVF installation path>\launcher\ReportDirectorSvfServer.runReport Director Spool Balancer
<SVF installation path>\launcher\ReportDirectorSpoolBalancer.runTomcat
%FIT_PRODUCTS_BASE%\SetupUtils\setup_tomcat.bat
- (When the monitor target is Tomcat:)Insert the additional description to --JvmOption of :install within setup_tomcat.bat in the following way. For n, specify the port number. If there is more than one Java VM to be monitored on the same machine, specify a unique port number. The port number specified here is also specified with the Cluster WebUI (Monitor Resource Properties - Monitor(special) tab - Connection Port).
Before the change:
--JvmOptions=...
After the change:
--JvmOptions=...;-Dcom.sun.management.jmxremote.port=n;-Dcom.sun.management.jmxremote.ssl=false;-Dcom.sun.management.jmxremote.authenticate=false
- (When the monitor target is other than Tomcat:)The following contents are inserted in the part where Arguments is designated just after the setting point of "-Xms". For n, specify the port number. If there is more than one Java VM to be monitored on the same machine, specify a unique port number. The port number specified here is also specified with the Cluster WebUI (Monitor Resource Properties -> Monitor (special) tab -> Connection Port).
-Dcom.sun.management.jmxremote.port=n -Dcom.sun.management.jmxremote.ssl=false -Dcom.sun.management.jmxremote.authenticate=false
5.27.21. Monitoring a Java application that you created
-Dcom.sun.management.jmxremote.port=n -Dcom.sun.management.jmxremote.ssl=false -Dcom.sun.management.jmxremote.authenticate=false
Some Java applications require the following to be additionally specified.
-Djavax.management.builder.initial=<Class name of MBeanServerBuilder>
5.27.22. Monitor (special) tab
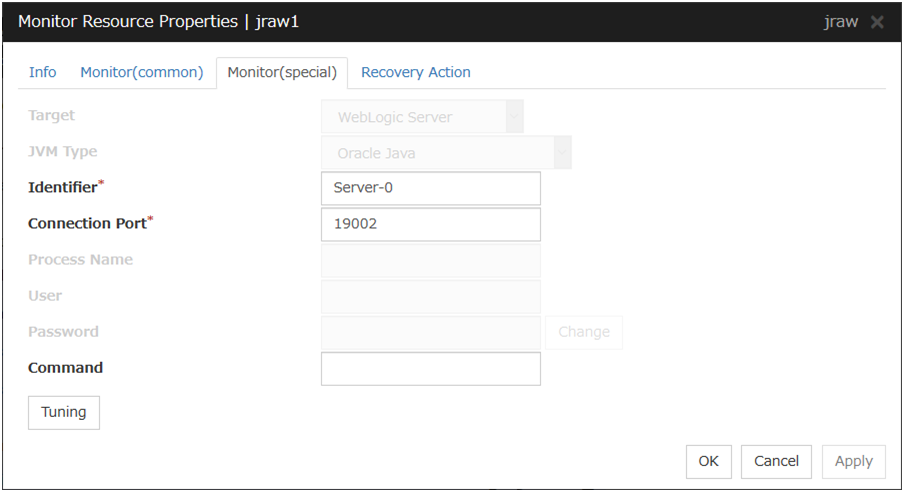
Target
Select the target to be monitored from the list.When monitoring WebSAM SVF for PDF, WebSAM Report Director Enterprise, or WevSAM Universal Connect/X, select WebSAM SVF. When monitoring a Java application that you created, select Java Application.
Default: None
JVM Type
Select the Java VM on which the target application to be monitored is running.For Java 8 or later, select Oracle Java(usage monitoring). For Java 8, the following specification changes have been made.
It has become impossible to acquire the maximum value of each memory in a non-heap area.
Perm Gen has been changed to Metaspace.
Compressed Class Space was added.
For Java 8, therefore, the monitor items on the Memory tab have been changed as below.
Monitoring for the use rate has been changed to monitoring for the amount used.
Perm Gen, Perm Gen[shared-ro], and Perm Gen[shared-rw] cannot be monitored. Clear the check box.
Metaspace and Compressed Class Space can be monitored.
For Java 9, the following specification changes have been made.
Code Cache has been divided.
For Java9, therefore, the monitor items on the Memory tab have been changed as below.
Code Cache cannot be monitored. Clear the check box.
CodeHeap non-nmethods, CodeHeap profiled and CodeHeap non-profiled can be monitored.
Default: None
Identifier (within 255 bytes)
Specify a name to uniquely identify the target Java VM. You must specify the identifier.
Default: None
Connection Port (1024 to 65535)
Specify the number of the port to be used for connection with the target Java VM. You must specify the connection port. A value between 42424 and 61000 is not recommended.
Default: None
Process Name (within 255 bytes)
This does not need to be configured because the monitor target Java VM can be identified by Conncetion Port. The internal version 11.35 or earlier required the process name to be specified since this parameter was used for the identification when the data of virtual memory usage amount was obtained or when the data of the monitor target was output to the JVM operation log. However, in and after the internal version 12.00, Monitor Virtual Memory Usage was deleted. Therefore, it cannot be specified.
Default: None
User (within 255 bytes)
Specify the name of the administrator who will be making a connection with the target Java VM. When WebOTX Domain Agent is selected as the target, specify the "domain.admin.user" value of "(WebOTX_installation_path)\<domain_name>.properties".
Default: None
Password (within 255 bytes)
Specify the password for the administrator who will be making a connection with the target Java VM. When WebOTX Domain Agent is selected as the target, specify the "domain.admin.passwd" value of "(WebOTX_installation_path)\<domain_name>.properties". Click Change and enter the password in the dialog box. The letters of the password are not displayed.
Default: None
Command (within 255 bytes)
Specify the command to execute if an error is detected in the target Java VM. It is possible to specify the command to execute for each error cause, as well as arguments. Specify a full path. Enclose an executable file name with double quotes ("").Example)"\Program Files\bin\command.bat" arg1 arg2Here, specify the commands to execute if it is impossible to connect to the target Java VM and if an error is detected in acquiring the resource amount used.Default: None
When you click Tuning, the following information is displayed in the pop-up dialog box. Make detailed settings according to the descriptions below.
5.27.23. Memory tab (when Oracle Java is selected for JVM Type)
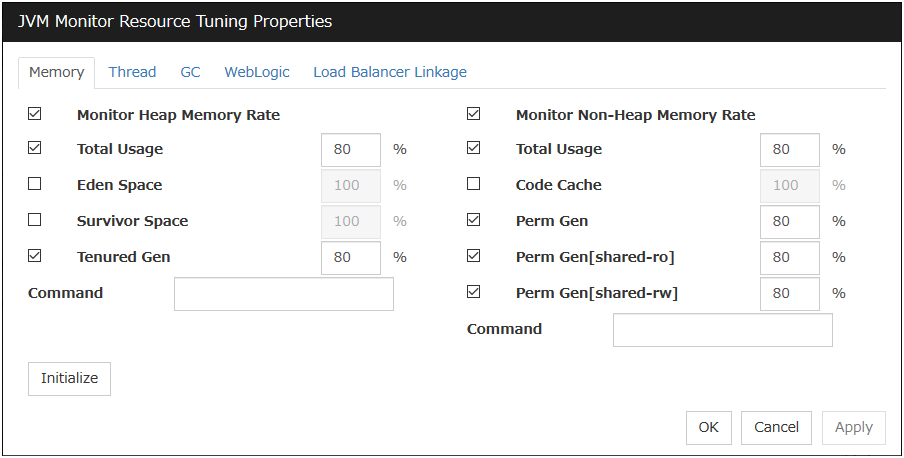
Monitor Heap Memory Rate
Enables the monitoring of the usage rates of the Java heap areas used by the target Java VM.
Total Usage (1 to 100)
Specify the threshold for the usage rate of the Java heap areas used by the target Java VM.
Default: 80[%]
Eden Space (1 to 100)
Specify the threshold for the usage rate of the Java Eden Space used by the target Java VM.If G1 GC is specified as the GC method of the target Java VM, read it as G1 Eden Space.
Default: 100[%]
Survivor Space (1 to 100)
Specify the threshold for the usage rate of the Java Survivor Space used by the target Java VM.If G1 GC is specified as the GC method of the target Java VM, read it as G1 Survivor
Default: 100[%]
Tenured Gen (1 to 100)
Specify the threshold for the usage rate of the Java Tenured(Old) Gen area used by the target Java VM. If G1 GC is specified as the GC method of the target Java VM, read it as G1 Old Gen.
Default: 80[%]
Monitor Non-Heap Memory Rate
Enables the monitoring of the usage rates of the Java non-heap areas used by the target Java VM.
Total Usage (1 to 100)
Specify the threshold for the usage rate of the Java non-heap areas used by the target Java VM.
Default: 80[%]
Code Cache (1 to 100)
Specify the threshold for the usage rate of the Java Code Cache area used by the target Java VM.
Default: 100[%]
Perm Gen (1 to 100)
Specify the threshold for the usage rate of the Java Perm Gen area used by the target Java VM.
Default: 80[%]
Perm Gen[shared-ro] (1 to 100)
Specify the threshold for the usage rate of the Java Perm Gen [shared-ro] area used by the target Java VM.
Default: 80[%]
Perm Gen[shared-rw] (1 to 100)
Specify the threshold for the usage rate of the Java Perm Gen [shared-rw] area used by the target Java VM.
Default: 80[%]
Command (within 255 bytes)
Specify the command to execute if an error is detected in the target Java VM. It is possible to specify the command to execute for each error cause, as well as arguments. Specify a full path. Enclose an executable file name with double quotes ("").Example)"\Program Files\bin\command.bat" arg1 arg2Here, specify the commands to execute if an error is detected in the Java heap area and Java non-heap area of the target Java VM.Default: None
Initialize
Click Initialize to initialize all the items to their default values.
5.27.24. Memory tab (when Oracle Java(usage monitoring) is selected for JVM Type)
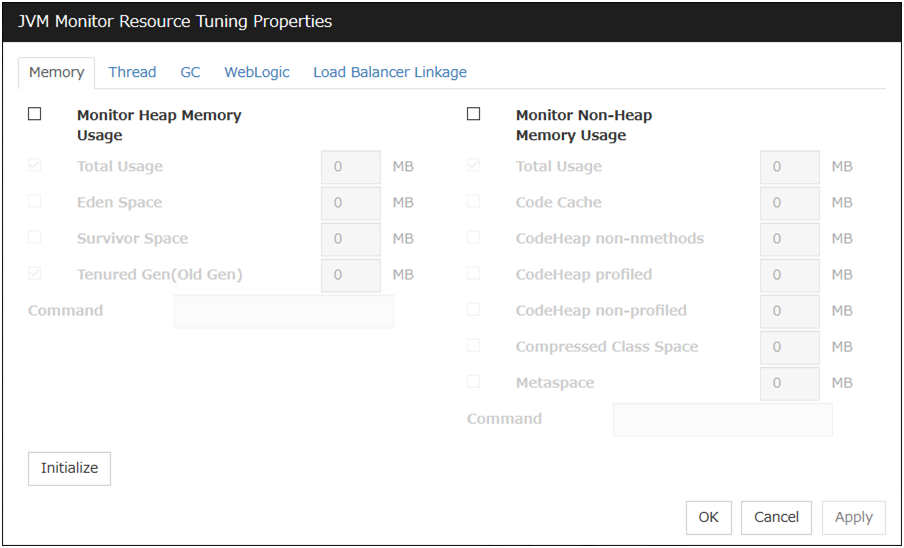
Monitor Heap Memory Usage
Enables the monitoring of the amount of the Java heap areas used by the target Java VM.
Total Usage (0 to 102400)
Specify the threshold for the amount of the Java heap areas used by the target Java VM. If zero is specified, this item is not monitored.
Default: 0[MB]
Eden Space (0 to 102400)
Specify the threshold for the amount of the Java Eden Space used by the target Java VM. If zero is specified, this item is not monitored. If G1 GC is specified as the GC method of the target Java VM, read it as G1 Eden Space.
Default: 0[MB]
Survivor Space (0 to 102400)
Specify the threshold for the amount of the Java Survivor Space used by the target Java VM. If zero is specified, this item is not monitored. If G1 GC is specified as the GC method of the target Java VM, read it as G1 Survivor Space.
Default: 0[MB]
Tenured Gen (0 to 102400)
Specify the threshold for the amount of the Java Tenured(Old) Gen area used by the target Java VM. If zero is specified, this item is not monitored. If G1 GC is specified as the GC method of the target Java VM, read it as G1 Old Gen.
Default: 0[MB]
Monitor Non-Heap Memory Usage
Enables the monitoring of the amounts of the Java non-heap areas used by the target Java VM.
Total Usage (0 to 102400)
Specify the threshold for the usage amount of the Java non-heap areas used by the target Java VM. If zero is specified, this item is not monitored.
Default: 0[MB]
Code Cache (0 to 102400 )
Specify the threshold for the usage amount of the Java Code Cache area used by the target Java VM. If zero is specified, this item is not monitored.
Default: 0[MB]
CodeHeap non-nmethods (0 to 102400)
Specify the threshold for the usage rate of the Java CodeHeap non-nmethods areas used by the target Java VM. If zero is specified, this item is not monitored.
Default: 0[MB]
CodeHeap profiled (0 to 102400)
Specify the threshold for the usage rate of the Java CodeHeap profiled nmethods areas used by the target Java VM. If zero is specified, this item is not monitored.
Default: 0[MB]
CodeHeap non-profiled (0 to 102400)
Specify the threshold for the usage rate of the Java CodeHeap non-profiled nmethods areas used by the target Java VM. If zero is specified, this item is not monitored.
Default: 0[MB]
Compressed Class Space (0 to 102400)
Specify the threshold for the usage rate of the Compressed Class Space areas used by the target Java VM. If zero is specified, this item is not monitored.
Default: 0[MB]
Metaspace (0 to 102400)
Specify the threshold for the usage rate of the Metaspace area used by the target Java VM
Default: 0[MB]
Command (within 255 bytes)
Specify the command to execute if an error is detected in the target Java VM. It is possible to specify the command to execute for each error cause, as well as arguments. Specify a full path. Enclose an executable file name with double quotes ("").Example)"\Program Files\bin\command.bat" arg1 arg2Here, specify the commands to execute if an error is detected in the Java heap area and Java non-heap area of the target Java VM.Default: None
Initialize
Click Initialize to initialize all the items to their default values.
5.27.25. Thread tab
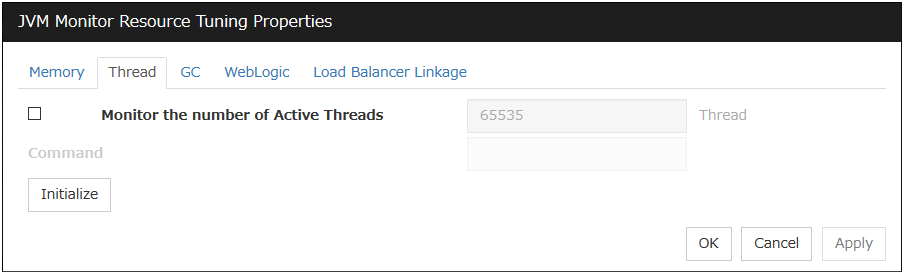
Monitor the number of Active Threads (1 to 65535)
Specify the upper limit threshold for the number of threads running on the monitor target Java VM.
Default: 65535 [threads]
Command (within 255 bytes)
Specify the command to execute if an error is detected in the target Java VM. It is possible to specify the command to execute for each error cause, as well as arguments. Specify a full path. Enclose an executable file name with double quotes ("").Example)"\Program Files\bin\command.bat" arg1 arg2Here, specify the command to execute if an error is detected in the number of threads currently running in the target Java VM.Default: None
Initialize
Click Initialize to initialize all the items to their default values.
5.27.26. GC tab
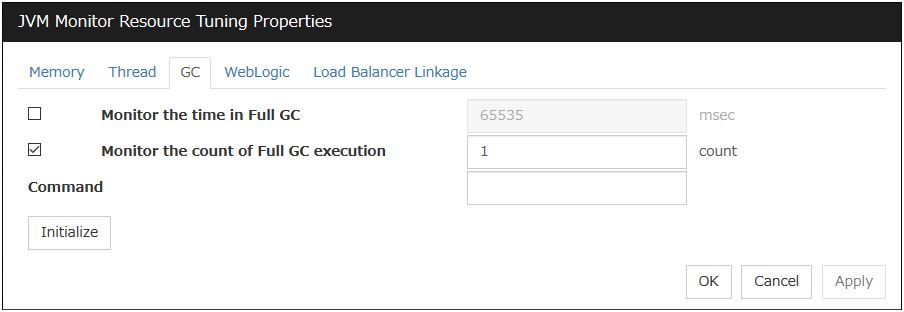
Monitor the time in Full GC (1 to 65535)
Specify the threshold for the Full GC execution time since previous measurement on the target Java VM. The threshold for the Full GC execution time is the average obtained by dividing the Full GC execution time by the number of times Full GC occurs since the previous measurement.To determine the case in which the Full GC execution time since the previous measurement is 3000 milliseconds and Full GC occurs three times as an error, specify 1000 milliseconds or less.Default: 65535 [milliseconds]
Monitor the count of Full GC execution (1 to 65535)
Specify the threshold for the number of times Full GC occurs since previous measurement on the target Java VM.
Default: 1 (time)
Command (within 255 bytes)
Specify the command to execute if an error is detected in the target Java VM. It is possible to specify the command to execute for each error cause, as well as arguments. Specify a full path. Enclose an executable file name with double quotes ("").Example)"\Program Files\bin\command.bat" arg1 arg2Here, specify the commands to execute if an error is detected in the Full GC execution time and Full GC execution count of the target Java VM.Default: None
Initialize
Click Initialize to initialize all the items to their default values.
5.27.27. WebLogic tab
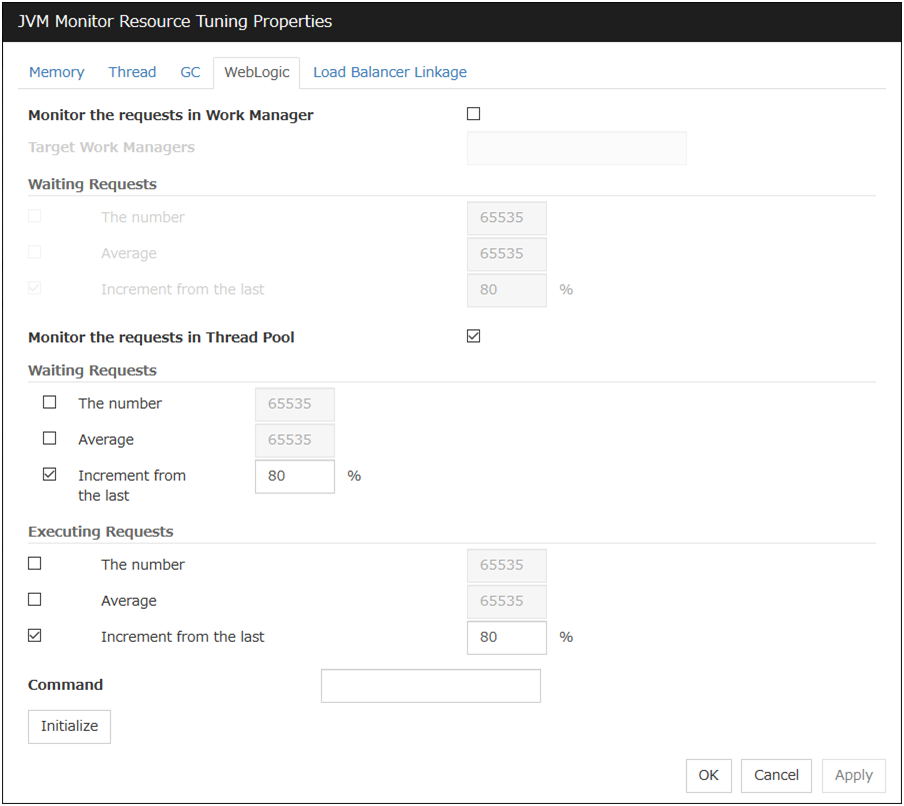
Monitor the requests in Work Manager
Enables the monitoring of the wait requests by Work Managers on the WebLogic Server.
Target Work Managers
Specify the names of the Work Managers for the applications to be monitored on the target WebLogic Server. To monitor Work Managers, you must specify this setting.
App1[WM1,WM2, ...];App2[WM1,WM2, ...]; ...For App and WM, only ASCII characters are valid (except Shift_JIS codes 0x005C and 0x00A1 to 0x00DF).To specify an application that has an application archive version, specify "application_name#version" in App.When the name of the application contains "[" and/or "]", prefix it with \.(Ex.) When the application name is app[2], enter app\[2\].
Default: None
The number (1 to 65535)
Specify the threshold for the wait request count for the target WebLogic Server Work Manager(s).
Default: 65535
Average (1 to 65535)
Specify the threshold for the wait request count average for the target WebLogic Server Work Manager(s).
Default: 65535
Increment from the last (1 to 1024)
Specify the threshold for the wait request count increment since the previous measurement for the target WebLogic Server Work Manager(s).
Default: 80[%]
Monitor the requests in Thread Pool
Enables the monitoring of the number of wait requests (number of HTTP requests queued in the WebLogic Server) and the number of executing requests (number of HTTP requests queued in the WebLogic Server) in the target WebLogic Server thread pool.
Wait Requests The number (1 to 65535)
Specify the threshold for the wait request count.
Default: 65535
Wait Request Average (1 to 65535)
Specify the threshold for the wait request count average.
Default: 65535
Wait Request Increment from the last (1 to 1024)
Specify the threshold for the wait request count increment since the previous measurement.
Default: 80[%]
Executing Requests The number (1 to 65535)
Specify the threshold for the number of requests executed per unit of time.
Default: 65535
Executing Requests Average (1 to 65535)
Specify the threshold for the average count of requests executed per unit of time.
Default: 65535
Executing Requests Increment from the last (1 to 1024)
Specify the threshold for the increment of the number of requests executed per unit of time since the previous measurement.
Default: 80[%]
Command (within 255 bytes)
Specify the command to execute if an error is detected in the target Java VM. It is possible to specify the command to execute for each error cause, as well as arguments. Specify a full path. Enclose an executable file name with double quotes ("").Example)"\Program Files\bin\command.bat" arg1 arg2Here, specify the commands to execute if an error is detected in the requests in the thread pool or in the work manager of the WebLogic Server.Default: None
Initialize
Click Initialize to initialize all the items to their default values.
5.27.28. Load Balancer Linkage tab
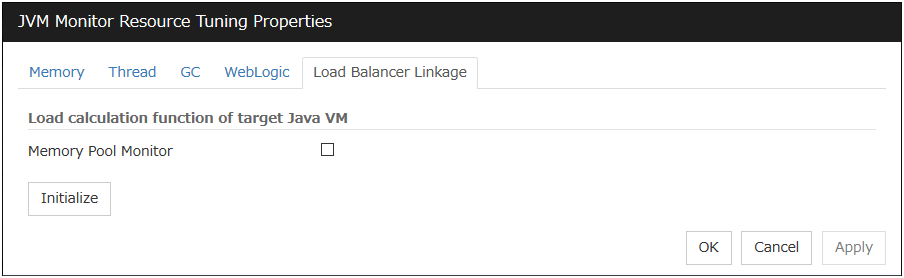
This screen appears when an item other than BIG-IP LTM is selected as the load balancer type.
Memory Pool Monitor
Enables the monitoring of the memory pool when notifying the load balancer of dynamic load information.
Initialize
Click Initialize to initialize all the items to their default values.
5.27.29. Load Balancer Linkage tab(BIG-IP LTM)
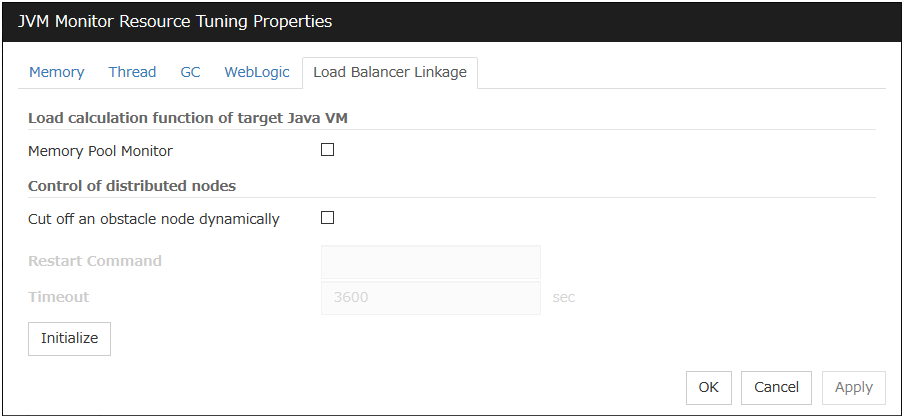
This screen appears when BIG-IP LTM is selected as the load balancer type.
Memory Pool Monitor
Enables the monitoring of the memory pool when notifying the load balancer of dynamic load information.
Cut off an obstacle node dynamically
When the JVM monitor detects a monitor target failure (example: the collection information exceeds the configured threshold), it sets whether to update the status of the BIG-IP LTM distributed node from "enable" to "disable".
Restart Command
Specify the command to be executed after waiting until the number of connections of the distributed node becomes 0. This function is effective when the monitor target is rebooted when resident monitoring is performed and a monitor target failure is detected. For a restart command, specify the common value for every JVM monitor resources.
Timeout (0 to 2592000)
After updating the distributed node status from "enable" to "disable", the JVM monitor sets the timeout used when waiting until the number of connections of the distributed node falls to 0. If the timeout elapses, Restart Command is not executed.
Default: 3600 [sec]
Initialize
Click the Initialize button to set Memory Pool Monitor, Cut off an obstacle node dynamically, and Timeout to their default values.
Note
Linking with the BIG-IP Local Traffic Manager requires an OpenSSL library. However, OpenSSL 1.1.0 or later is not supported.
5.28. Setting up System monitor resources
System monitor resources monitor the system resources. The resources periodically collect statistical information about system resources and analyze the information according to given knowledge data. System monitor resources serve to detect the exhaustion of resources early according to the results of analysis.
5.28.1. Notes on system monitor resource
A system resource value repeatedly exceeds and then falls below a threshold.
In a case like where the system is high loaded, it may take a long time to collect statistical information and the interval of statistical information collection may be unapplied.
If date or time of OS has been changed during System Resource Agent's operation, resource monitoring may operate wrongly as follows since the timing of analyze which is normally done at 10 minute intervals may be changed at first time after changing date or time. In such case, suspend and resume cluster.
Error is not detected after passing specified duration to detect error.
Error is detected before passing specified duration to detect error.
Once the cluster has been suspended and resumed, the collection of information is started from that point of time.
The amount of system resources used is analyzed at 10-minute intervals. Thus, an error may be detected up to 10 minutes after the monitoring session.
The amount of disk resources used is analyzed at 60-minute intervals. Thus, an error may be detected up to 60 minutes after the monitoring session.
Specify a smaller value than the actual disk size when specifying the disk size for free space monitoring of disk resources. If a larger value specified, a lack-of-free-space error will be detected.
If the monitored disk is exchanged, the following information analyzed up to then will be cleared if it differs from the information in the previous disk:
Total disk capacity
File system
When monitoring disk resources, only hard disks can be monitored.
Up to 26 disk units can be simultaneously monitored by the disk resource monitoring function.
If system monitor is not displayed in the Type column on the monitor resource definition screen, select Get License Info and then acquire the license information.
The status of the system monitor resource is Warning from when start of monitoring is enabled to when the monitoring processing is actually performed. In this status, the following message is output to the alert log.
Monitor sraw is in the warning status. (191 : Command succeeded.)
5.28.2. Monitoring by System monitor resources

- The total memory usage remains at the total memory usage threshold or higher as time passes, for at least a certain duration of time.
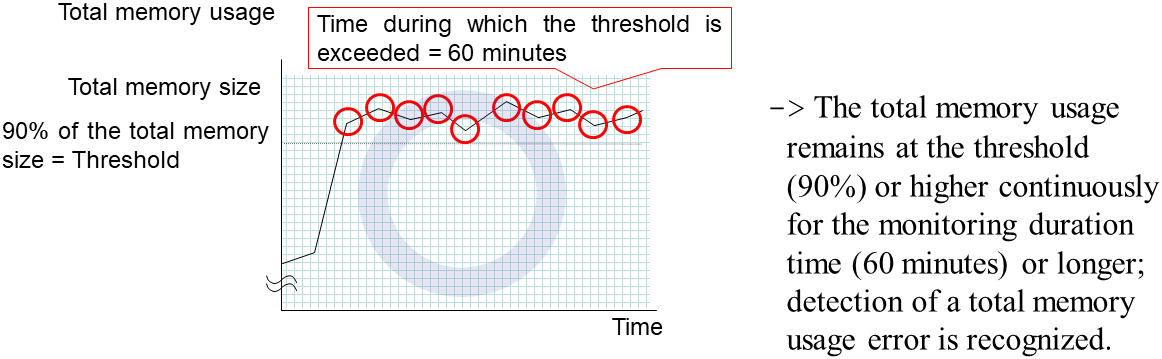
- The total memory usage rises and falls in the vicinity of the total memory usage threshold as time passes, but always remains under that threshold.
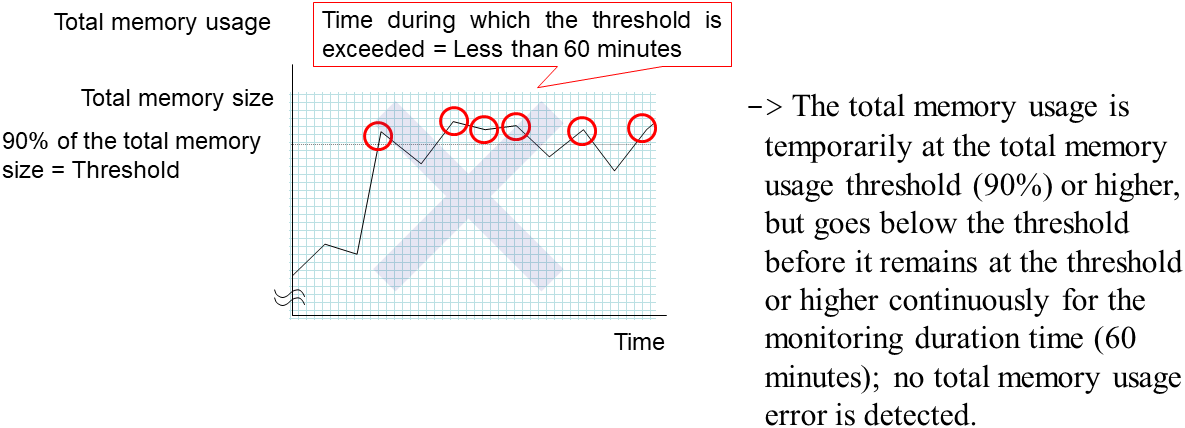
Monitoring disk usage by warning level
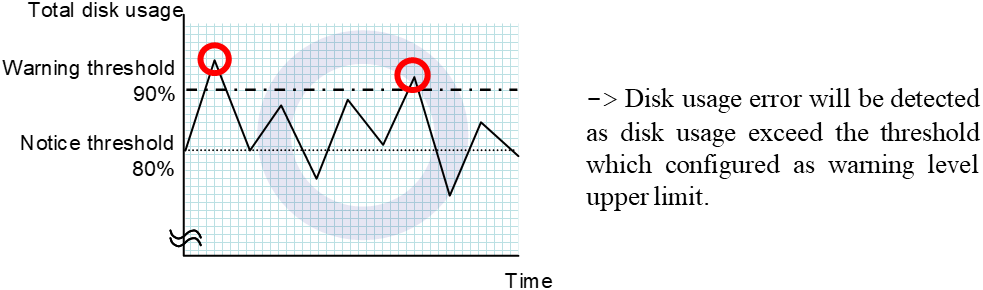
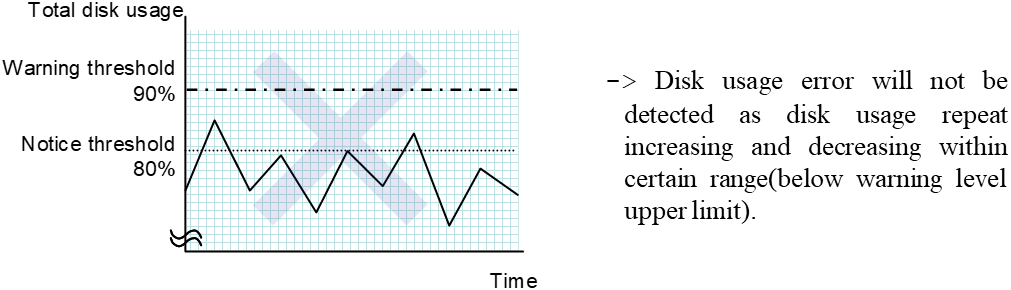
Monitoring disk usage by notice level
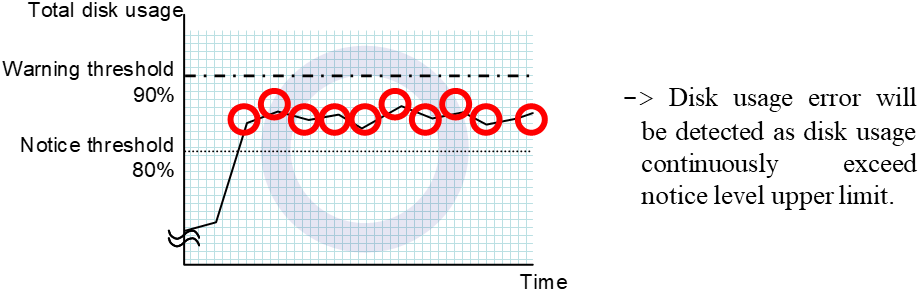
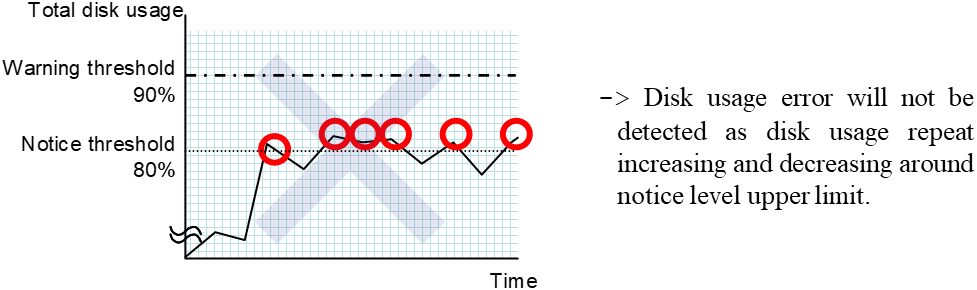
5.28.3. Monitor (special) tab
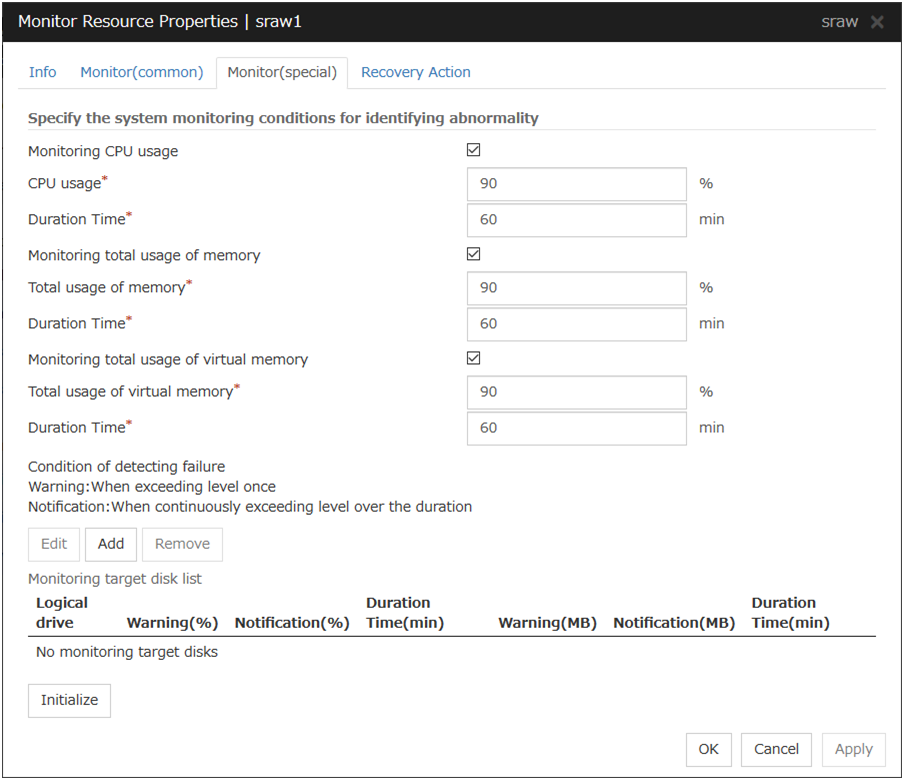
Monitoring CPU usage
Enables CPU usage monitoring.
CPU usage (1 to 100)
Specify the threshold for the detection of the CPU usage.
Duration Time (1 to 1440)
Specify the duration for detecting the CPU usage.If the threshold is continuously exceeded over the specified duration, the detection of an error is recognized.
Monitoring total usage of memory
Enables the monitoring of the total usage of memory.
Total usage of memory (1 to 100)
Specify the threshold for the detection of a memory use amount error (percentage of the memory size implemented on the system).
Duration Time (1 to 1440)
Specify the duration for detecting a total memory usage error.If the threshold is continuously exceeded over the specified duration, the detection of an error is recognized.
Monitoring total usage of virtual memory
Enables the monitoring of the total usage of virtual memory.
Total usage of virtual memory (1 to 100)
Specify the threshold for the detection of a virtual memory usage error.
Duration Time (1 to 1440)
Specify the duration for detecting a total virtual memory usage error.If the threshold is continuously exceeded over the specified duration, the detection of an error is recognized.
Add
Click this to add disks to be monitored. The Input of watch condition dialog box appears.Configure the detailed monitoring conditions for error determination, according to the descriptions given in the Input of watch condition dialog box.
Remove
Click this to remove a disk selected in Disk List so that it will no longer be monitored.
Edit
Click this to display the Input of watch condition dialog box. The dialog box shows the monitoring conditions for the disk selected in Disk List. Edit the conditions and click OK.
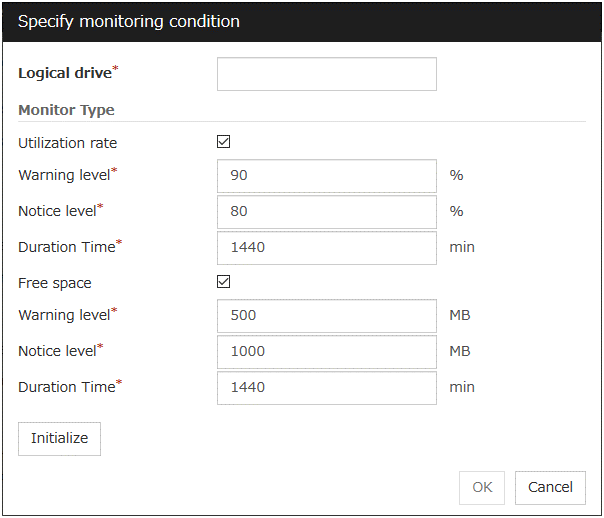
Logical drive
Set the logical drive to be monitored.
Utillization rate
Enables the monitoring of the disk usage.
Warning level (1 to 100)
Specify the threshold for warning level error detection for disk usage.
Notice level (1 to 100)
Specify the threshold for notice level error detection for disk usage.
Duration Time (1 to 43200)
Specify the duration for detecting a notice level error of the disk usage rate.If the threshold is continuously exceeded over the specified duration, the detection of an error is recognized.
Free space
Enables the monitoring of the free disk space.
Warning level (1 to 4294967295)
Specify the amount of disk space (in megabytes) for which the detection of an free disk space error at the warning level is recognized.
Notice level (1 to 4294967295)
Specify the amount of disk space (in megabytes) for which the detection of an free disk space error at the notice level is recognized.
Duration Time (1 to 43200)
Specify the duration for detecting a notice level error related to the free disk space.If the threshold is continuously exceeded over the specified duration, the detection of an error is recognized.
5.29. Setting up Process resource monitor resources
Process resource monitor resources monitor the resources used by processes. The resources periodically collect statistical information about resources used by processes and analyze the information according to given knowledge data. Process resource monitor resources serve to detect the exhaustion of resources early according to the results of analysis.
5.29.1. Notes on Process resource monitor resource
The use of the default process resource monitor resources settings is recommended.
In a case like where the system is high loaded, it may take a long time to collect statistical information and the interval of statistical information collection may be unapplied.
If date or time of OS has been changed during System Resource Agent's operation, resource monitoring may operate wrongly as follows since the timing of analyze which is normally done at 10 minute intervals may be changed at first time after changing date or time. In such case, suspend and resume cluster.
Error is not detected after passing specified duration to detect error.
Error is detected before passing specified duration to detect error.
Monitor psrw is in the warning status. (191 : normal.)
To return the status of the process resource monitor resource from error to normal, perform either of the following:
Suspending and resuming the cluster
Stopping and starting the cluster
5.29.2. Monitoring by Process resource monitor resources
- In the following example, as time progresses, memory usage increases and decreases, the maximum value is updated more times than specified, and increases by more than 10% from its initial value.
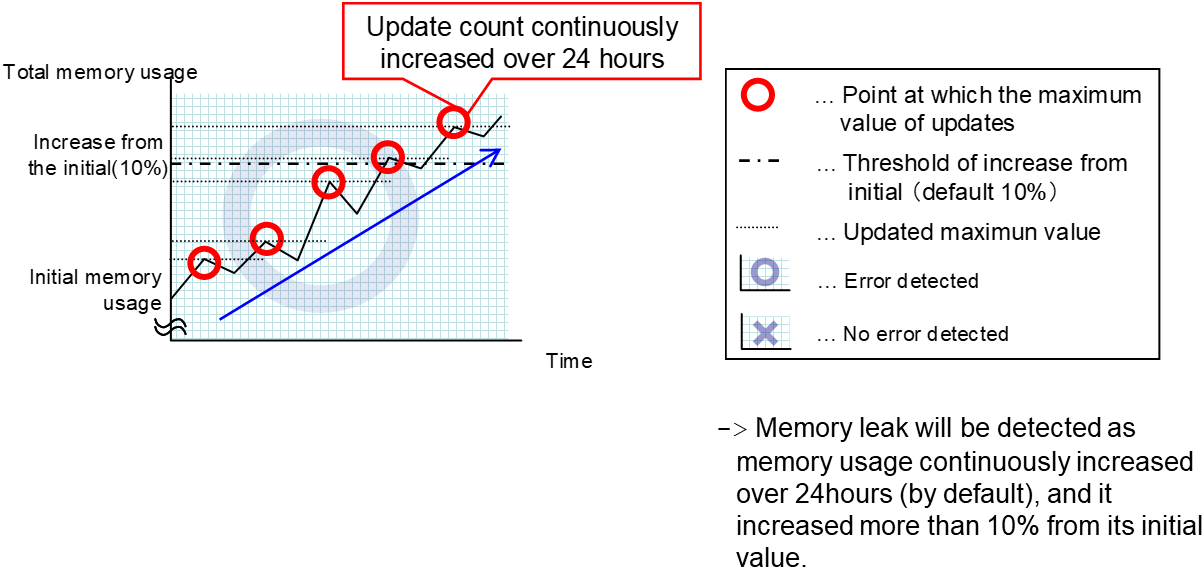
- In the following example, memory usage increases and decreases, but remains within a set range.
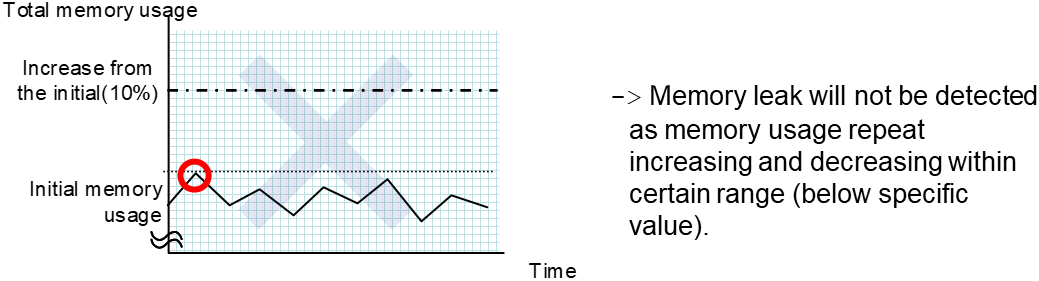
5.29.3. Monitor (special) tab
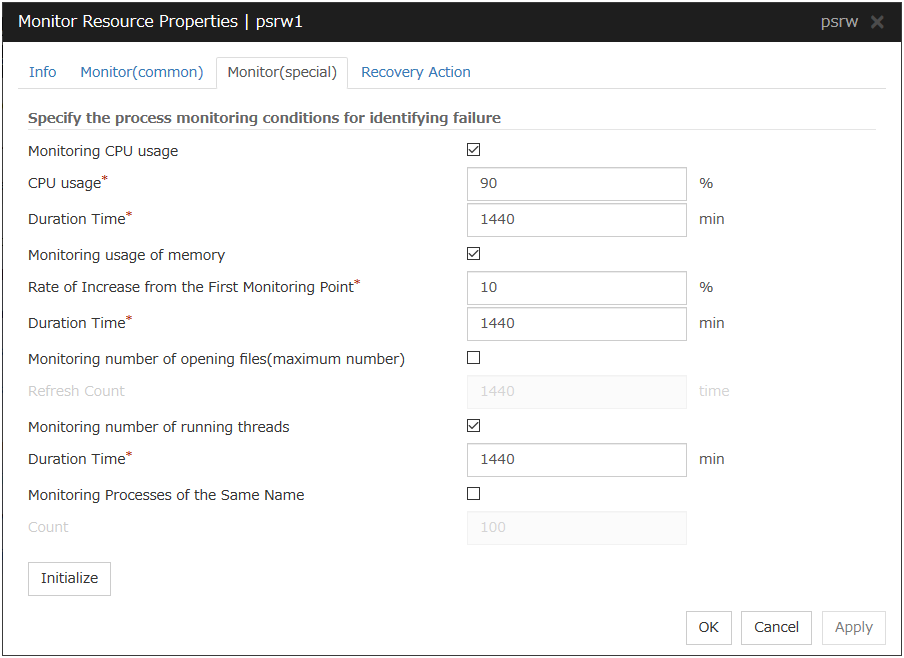
Monitoring CPU usage
Enables CPU usage monitoring.
CPU usage (1 to 100)
Specify the threshold for the detection of the CPU usage.
Duration Time (1 to 4320)
Specify the duration for detecting the CPU usage.If the threshold is continuously exceeded over the specified duration, the detection of an error is recognized.
Monitoring usage of memory
Enables the monitoring of the usage of memory.
Rate of Increase from the First Monitoring Point (1 to 1000)
Specify the threshold for the detection of a memory use amount error.
Duration Time (1 to 4320)
Specify the duration for detecting a memory usage error.If the threshold is continuously exceeded over the specified duration, the detection of an error is recognized.
Monitoring number of opening files (maximum number)
Enables the monitoring of the number of opening files (maximum number).
Refresh Count (1 to 4320)
Specify the refresh count for the detection of the number of opening files error.If the number of opening files maximum value is updated more count than specified, the detection of an error is recognized.
Monitoring number of running threads
Enables the monitoring of the number of running threads.
Duration Time (1 to 4320)
Specify the duration for detecting an error with the number of running threads.If the processes for which the number of running threads is passed more than specified times, the detection of an error is recognized.
Monitoring Processes of the Same Name
Enables the monitoring of the processes of the same name
Count (1 to 10000)
Specify the count for detecting an error with the processes of the same name.If the processes of the same name has been exists more than specified numbers, the detection of an error is recognized.
5.30. Setting up user mode monitor resources
5.30.1. Monitoring by user mode monitor resources
- Overview of processingThe following steps 2 and 3 are repeated.
Set the keepalive timer
Create a dummy thread
Update the keepalive timer
Step 2 is a process for advanced monitor setting. If this is not set, the process is not started.
- Behavior when a timeout does not occur (steps 2 and 3,above, are processed properly)Recovery processing such as reset is not executed.
- Behavior when a timeout occurs (Either of steps 2 or 3, above, is stopped or delayed)According to the action settings, a reset or panic is generated by the clphb driver.
5.30.2. Monitor (special) tab
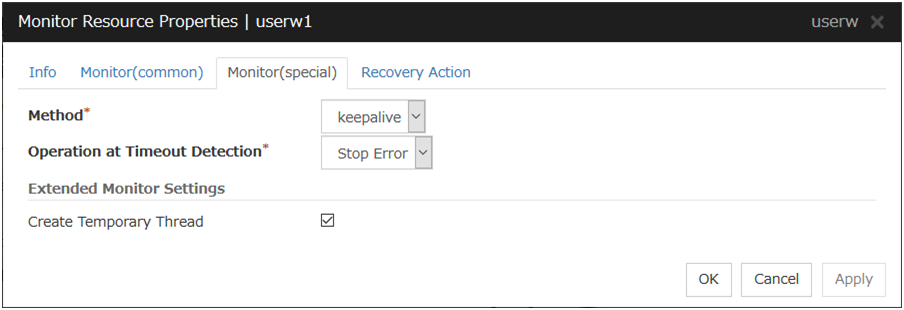
Monitor Method
Specify how the user space is monitored.
Action When Timeout Occurs
Specify the action to take when a timeout occurs.
Note
A dummy failure cannot be triggered by an action when a timeout occurs.
Create a Dummy Thread
Specify whether or not to create a dummy thread when monitoring.
6. Other setting details
6.1. Cluster properties
In the Cluster Properties window, you can view and change the detailed data of EXPRESSCLUSTER X SingleServerSafe.
6.1.1. Info tab
You can display the server name, and register and make a change to a comment on this tab.
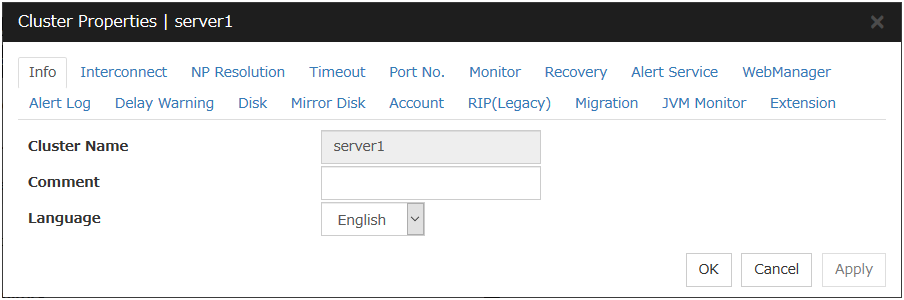
Cluster Name
Displays the server name. You cannot change the name here.
Comment (within 127 bytes)
Enter a new comment. You can only enter one byte English characters.
Language
Choose one of the display languages below. Specify the language (locale) of OS on which the Cluster WebUI runs.
English
Japanese
Chinese
6.1.2. Interconnect tab
Not used.
6.1.3. NP Resolution tab
Not used.
6.1.4. Timeout tab
Specify values such as time-out on this tab.
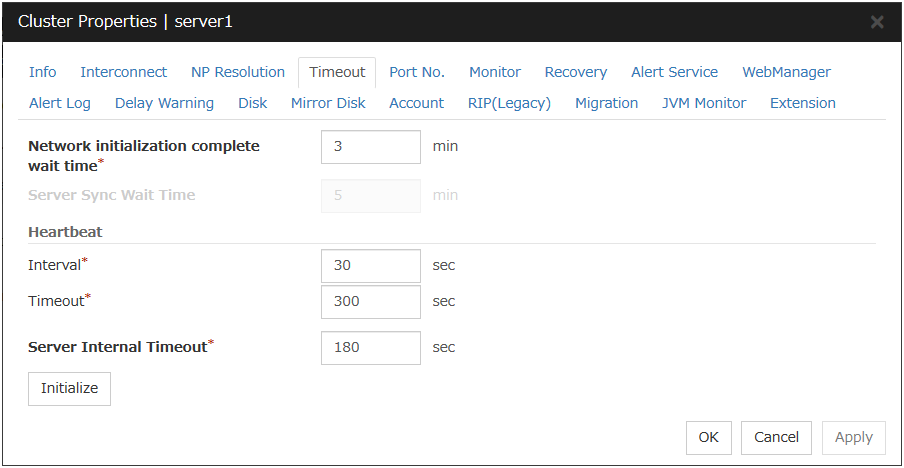
Network initialization complete wait time (0 to 99)
This is the time the server waits until its NIC becomes valid after startup.
Server Sync Wait Time (0 to 99)
Not used.
Heartbeat
Server Internal Timeout (1 to 9999)
The timeout to be used in the EXPRESSCLUSTER Server internal communications that are performed while an EXPRESSCLUSTER command is executed, or an operation is performed or a screen is displayed by Cluster WebUI.
Initialize
Used for initializing the value to the default value. Click Initialize to initialize all the items to their default values.
6.1.5. Port No. tab
Specify TCP port numbers and UDP port numbers.
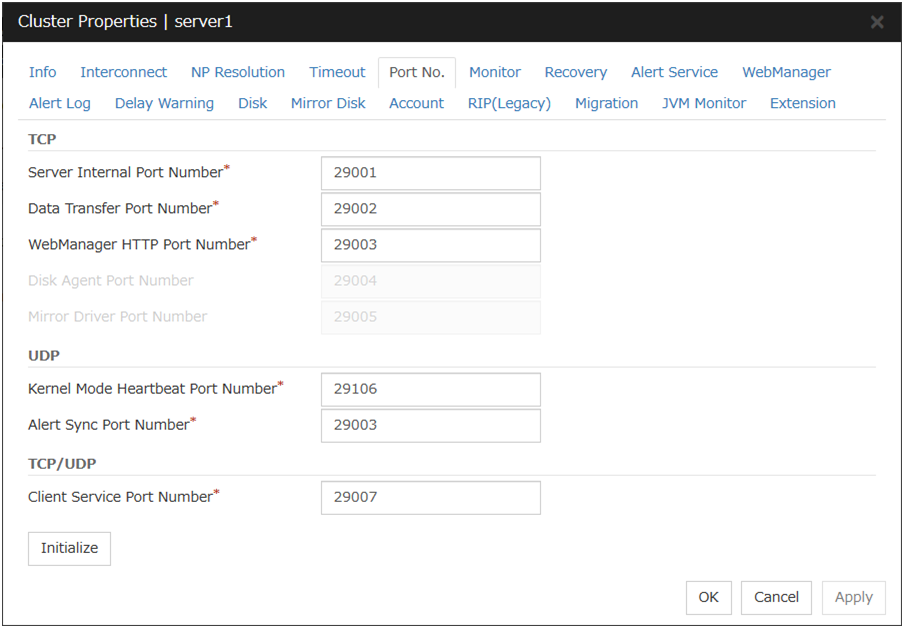
TCP
No TCP port numbers can be overlapped.
UDP
TCP/UDP
Initialize
Used for initializing the value to the default value. Click Initialize to initialize all the items to their default values.
6.1.6. Monitor tab
Specify the settings for monitoring.
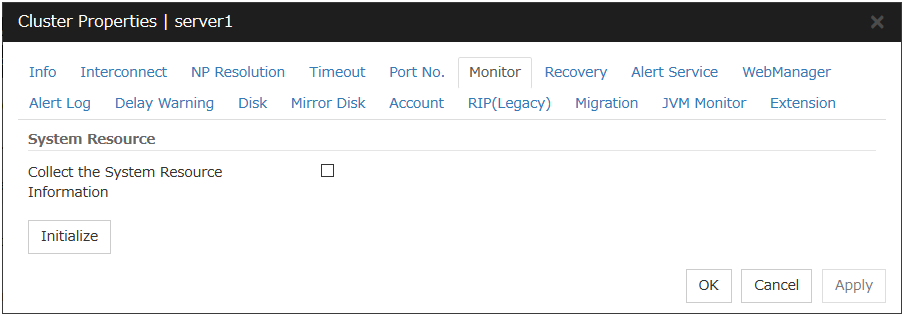
System Resource
Select whether to collect system resource information.System resource information is collected regularly so as to improve system operability. System resource information is useful for investigating the operation status of EXPRESSCLUSTER, and makes it easy to determine the cause of a failure attributable to a shortage of system resources.
6.1.7. Recovery tab
Specify the settings for recovery.
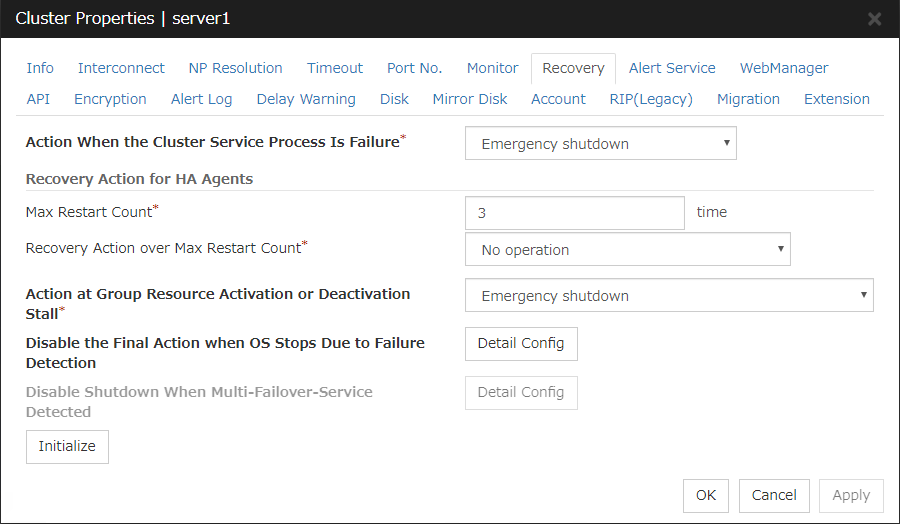
Action When the Cluster Service Process Is Failure
Specify an action at process abnormity of the cluster service.
Recovery Action for HA Agents
No operation
Note
The HA process is used with the system monitor resource, Process resource monitor resource, JVM monitor resource, and system resource information collection function.
Action at Group Resource Activation or Deactivation Stall
Specify the action to apply in the event of an activation/deactivation stall of a group resource.
Note
If a stall occurs with "Nothing (handle a stall as an activation/deactivation failure)" specified, the effect on the group resources is undefined, so we do not recommend changing the setting to "Nothing (handle a stall as an activation/deactivation If you do specify "Nothing (handle a stall as an activation/deactivation failure)", set the recovery operation upon the detection of an activation/deactivation failure of a group resource as described below.
Activation/deactivation retry threshold: 0 (times)
Failover threshold: 0 (times)
Final action: Intentionally causing a stop error
Disable the Final Action when OS Stops Due to Failure Detection
Click Detail Config to set suppression of the final action which accompanies the OS stop caused by error detection.
Note
The message receive monitor resource does not become the target for which the final action caused by error detection is suppressed.
The following situations lead to an OS stop during the final action when an activation/deactivation error is detected in a group resource and during the final action when a monitor resource error is detected.
Cluster service stop and OS shutdown
Cluster service stop and OS restart
Generation of an intentional stop error
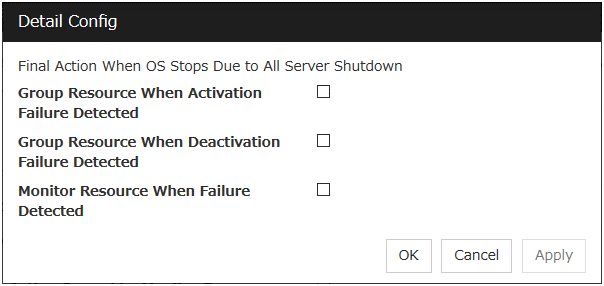
Disable Shutdown When Multi-Failover-Service Detected
Not used.
6.1.8. Alert Service tab
Specify the alert service, chassis identify, and network warning light.
Note
To use the mail alert function, obtain EXPRESSCLUSTER X Alert Service 4.2 for Windows, and register the license.
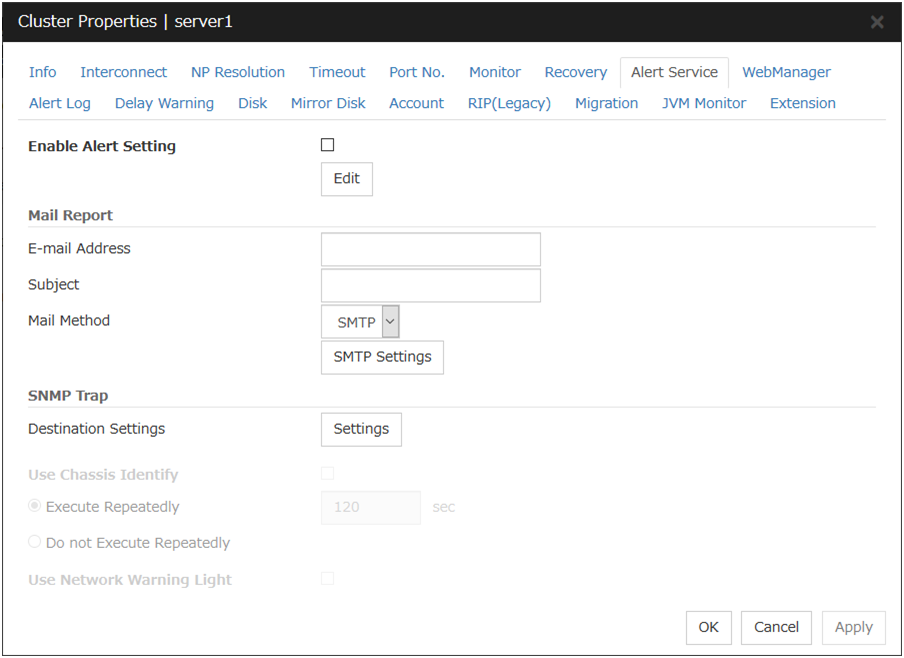
Enable Alert Setting
Configures whether or not to modify the default value of the alert settings. To modify the settings, click Edit to configure the destination address.
If you clear the checkbox, the destination address you have modified returns to the default settings temporarily.
For the default settings of the destination address, see "Messages reported by event log and alert" in "Error messages" in the "EXPRESSCLUSTER X SingleServerSafe Operation Guide".
E-mail Address (within 255 bytes)
Enter the mail address of alert destination. To specify multiple mail addresses, separate each of them by semi-colon ";".
Subject (within 127 bytes)
Enter the mail subject.
Mail Method
Configure the mail method. In this version, SMTP is the only option in this.
Destination Settings
Configure the SNMP trap transmission function. Click Setting to configure the SNMP trap transmission destination.
Use Chassis Identify
Not used.
Execute Repeatedly
Not used.
Do not Execute Repeatedly
Not used.
Use Network Warning Light
Not used.
Change Alert Destination
Clicking Edit displays the Change Alert Destination dialog box.
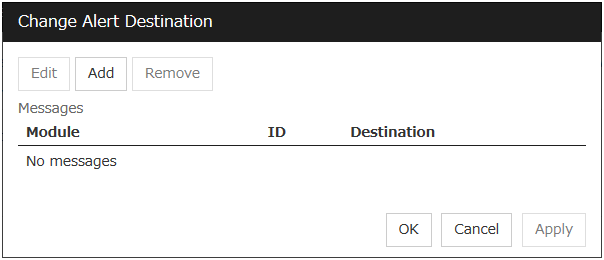
Add
Add the alert ID of the destination which you want to customize. Click Add to open the dialog box for entering the message.
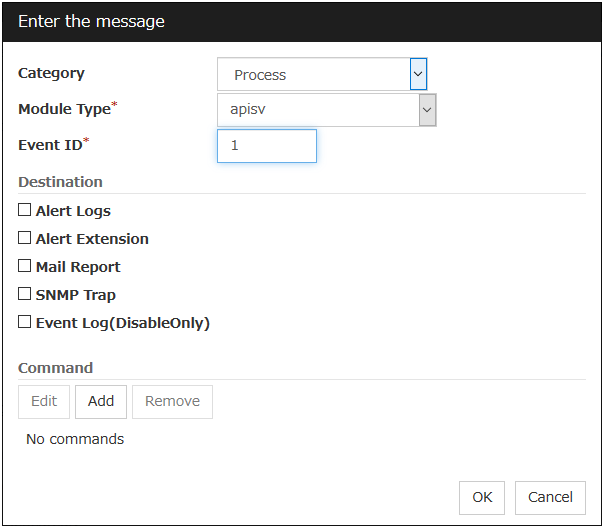
Category
Select a main category of module types.
Module Type (within 31 bytes)
Select the name of the module type for which you want to change the destination address.
Event ID
Enter the message ID of the module type for which you want to change the destination. For the message ID, see "Messages reported by event log and alert" in "Error messages" in the "EXPRESSCLUSTER X SingleServerSafe Operation Guide".
Destination
Select a message destination from the following options.
Add
Add a command of the alert extension function. Click Add button to display the dialog box for entering a command.Command (within 511 bytes)
Enter any command you want to use.
Remove
Click this to remove a command of the alert extension function. Select the command, and then, click Remove.
Edit
Click this to modify a command of the alert extension function. Select the command, and then, click Edit.
SMTP Settings
Click SMTP Settings to display the SMTP Settings dialog box used for the mail alert.Mail Charset (within 127 bytes)
Configure the character set of the e-mails sent for mail report.
Send Mail Timeout (1 to 999)
Configure the timeout value for the communication with SMTP server.
Subject Encode
Configure whether or not to encode the subject of e-mails.
SMTP Server List
Use this button to display a SMTP server that has been configured. Only one SMTP server can be configured in this version.
Add
Use this button to add a SMTP server. Click Add to open the Enter the SMTP Server dialog box.
Remove
Select this to remove the SMTP server.
Edit
Use this button to modify the settings of SMTP server.
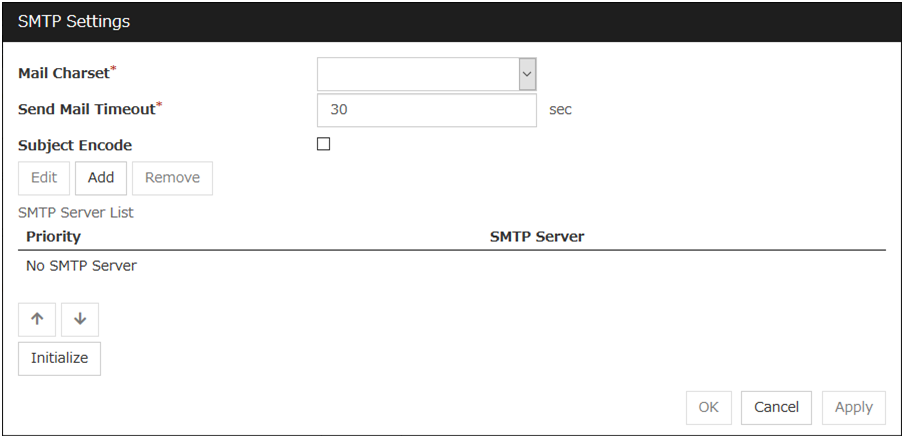
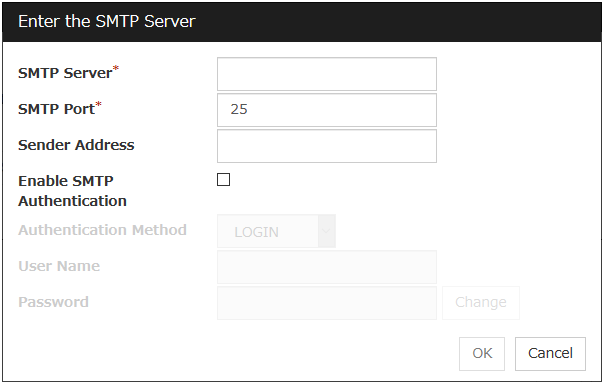
SMTP Server (within 255 bytes)
Configure the IP address or host name of the SMTP server.
SMTP Port (1 to 65,535)
Configure the port number of the SMTP server.
Sender Address (within 255 bytes)
Configure the address from which mail report is sent.
Enable SMTP Authentication
Configure whether or not to enable SMTP authentication.
Method
Select a method of SMTP authentication.
User Name (within 255 bytes)
Configure the user name used for SMTP authentication.
Password (within 255 bytes)
Configure the password used for SMTP authentication.
SNMP Settings
Click this to display the Destination Settings dialog box which is used for the SNMP trap.
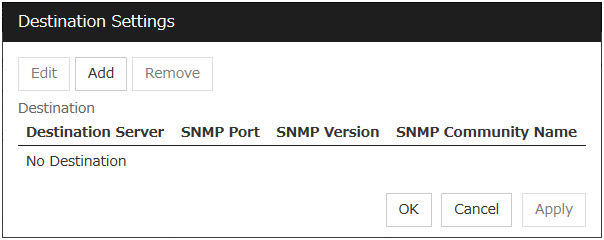
Destination
Displays the set SNMP trap transmission destinations. With this version, up to 32 SNMP trap transmission destinations can be set.
Add
Adds an SNMP trap transmission destination. Click Add to display the Change SNMP Destination dialog box.
Remove
Use Remove to remove the SNMP trap transmission destination settings.
Edit
Use Edit to modify the SNMP trap transmission destination settings.
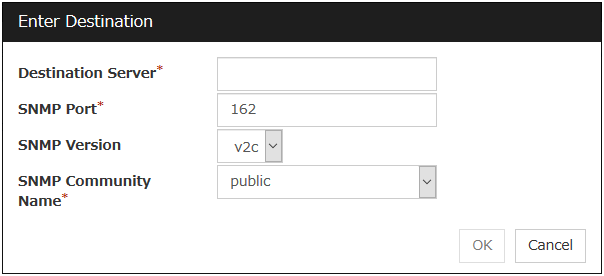
Destination Server (within 255 bytes)
Configure the name of the SNMP trap transmission destination server.
SNMP Port No. (1 to 65535)
Configure the port number of the SNMP trap transmission destination.
SNMP Version
Configure the SNMP version of the SNMP trap transmission destination.
SNMP Community Name (within 255 bytes)
Configure the SNMP community name of the SNMP trap transmission destination.
6.1.9. WebManager tab
Specify the settings for the WebManager Server.
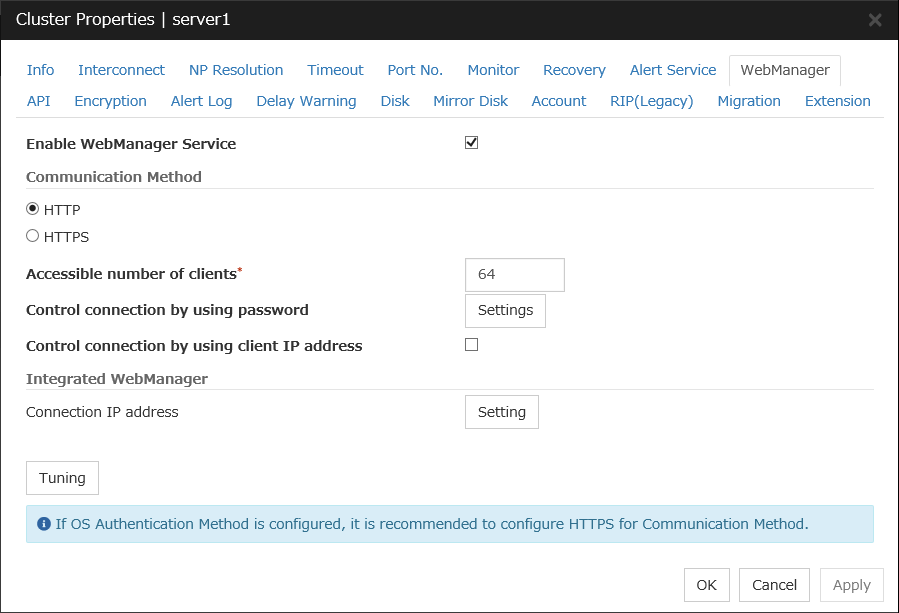
Enable WebManager Service
The WebManager service is enabled.
Communication Method
Accessible number of clients (1 to 999)
Specify the number of client machines that can be connected.
Control connection by using password
Click the Settings button to open the Password dialog box.
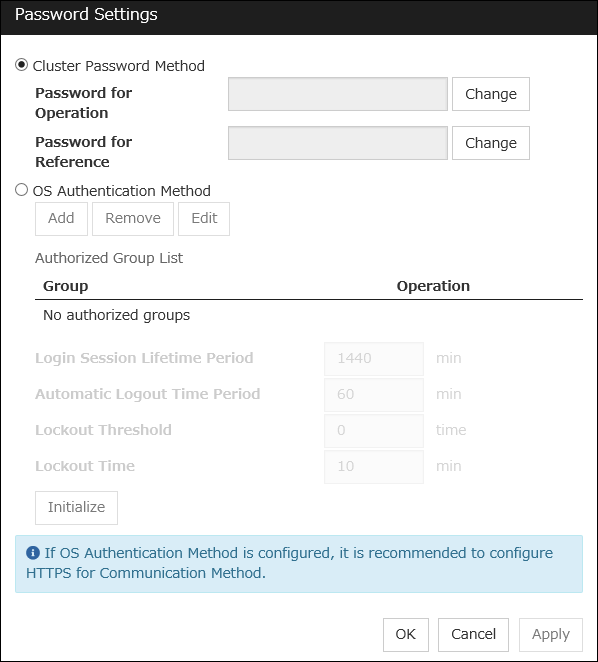
Cluster Password Method / OS Authentication Method
Choose a login method for Cluster WebUI from below.
Cluster Password Method
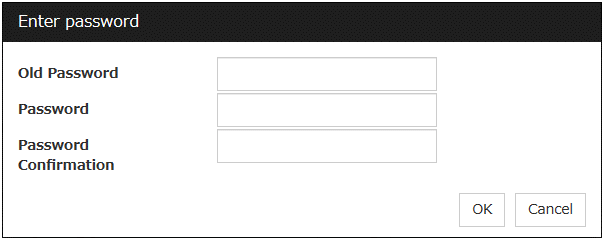
OS Authentication Method
Users must be registered to the server in advance to login to Cluster WebUI. More specifically, a group must be registered to the server and the users must belong to it as the control permission of a cluster is assigned per group,
Add
Used to add a group to Authorized Group List. The Group Name dialog box appears when Add is clicked. To add a group, the Operation checkbox must be selected.
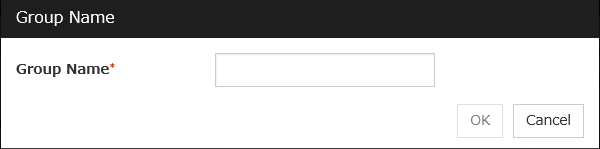
Remove
Used to delete a group from Authorized Group List.From Authorized Group List, select a group to be deleted. Then click Remove.
Edit
Used to edit a group. From Authorized Group List, select a group to be edited. Then click Edit. The Group Name dialog box appears with the selected group entered. The control permission does not change in this procedure.
Operation
Set control permission to a group registered in Authorized Group List.
Login Session Lifetime Period (0 to 52560)
Time frame of login session. If this value is set to zero (0), the period becomes limitless.
Automatic Logout Time Period (0 to 99999)
Sets the logout time for the automatic logout when there is no communication between Cluster WebUI and WebManager server. If this is set to zero (0), no automatic logout occurs.
Lockout Threshold (0 to 999)
Locks out a client IP address which fails to login continuously. The client cannot login until Lockout Time passes once a client is locked out. If this value is set to zero (0), no client IP address is not be locked out.
Lockout Time (1 to 99999)
Sets lockout time for a client IP address. Once the time passes, the lockout is automatically released.
Initialize
Restores the default value. If Initialize is clicked, the values of Login Session Lifetime Period, Automatic Logout Time Period, Lockout Threshold and Lockout Time are restored to the default values.
Control connection by using client IP address
If selected, accesses are controlled by client IP addresses.
Add
Use Add to add an IP address in Connection Permit Client IP Address List. By clicking Add, the IP Address Settings dialog box is displayed to enter an IP address. Newly added IP addresses have the rights for the operation.
IP address: 10.0.0.21
Network address: 10.0.1.0/24
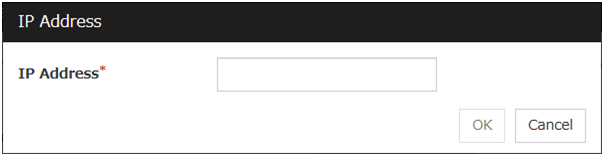
Remove
Use Remove to remove an IP address from Connection Permit Client IP Address List. Select an IP address you want to remove in Connection Permit Client IP Address List and click Remove.
Edit
Use Edit to change an IP address. Select an IP address you want to edit in Connection Permit Client IP Address List and click Edit. A dialog box where the specified IP address is preset is displayed. The rights for operating the edited IP addresses remain the same.
Operation
Specify the operation rights for IP addresses that are registered in Connection Permit Client IP Address List.
IP address for Integrated WebManager
Click the Settings button to open the IP address dialog box for the Integrated WebManager.
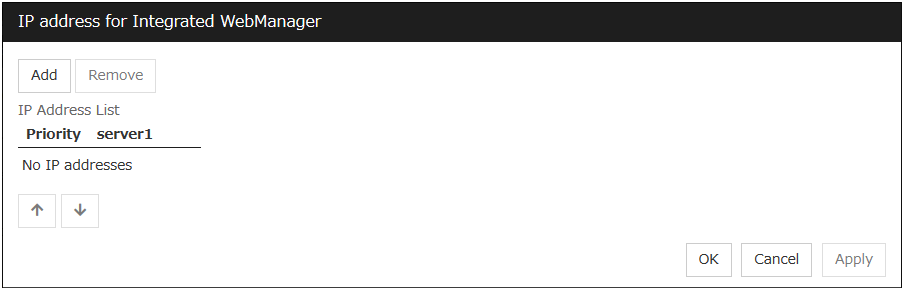
Tuning
Use Tuning to tune the WebManager Server. Click Tuning to open the WebManager Tuning Properties dialog box.
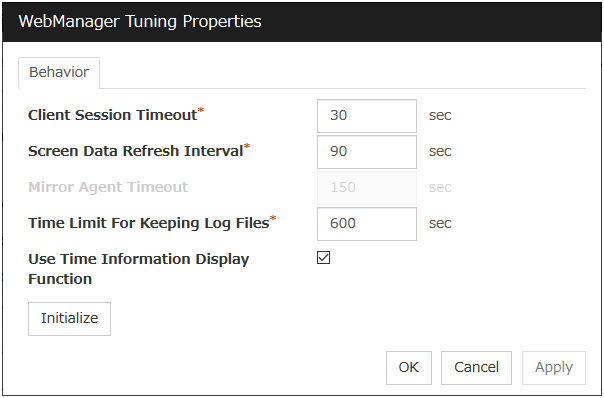
- InitializeUsed for initializing the value to the default value. Click Initialize to initialize all the items to their default values.
6.1.10. API Tab
Specify the settings for the API service.
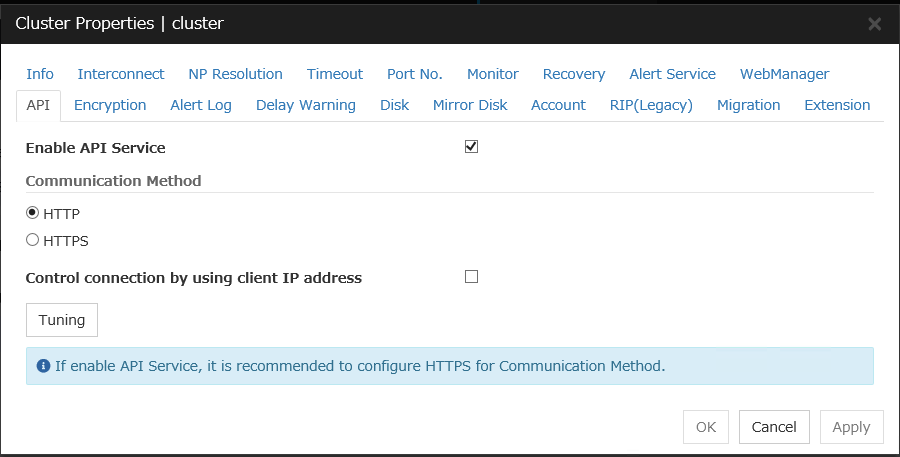
Enable API Service
API services are enabled.
Communication Method
Control connection by using client IP address
The connection is controlled by the client IP address.
Add
Used to add an IP address to Connection Permit Client IP Address List. Click Add to display the IP Address dialog box. Newly added IP addresses have the rights for the operation.
IP Address (Within 80 bytes)
Specify a client IP address allowed for the connection.
Example for IP address: 10.0.0.21
Example for network address: 10.0.1.0/24
Remove
Used to remove an IP address from Connection Permit Client IP Address List. From Connection Permit Client IP Address List, select the IP address to be removed, and click Remove.
Edit
Used to edit an IP address. From Connection Permit Client IP Address List, select the IP address you want to edit, and click Edit. Then the IP address dialog box where the specified IP address is preset is displayed.
Tuning
Used to adjust the API service. Click Tuning to display the API Tuning Properties dialog box.
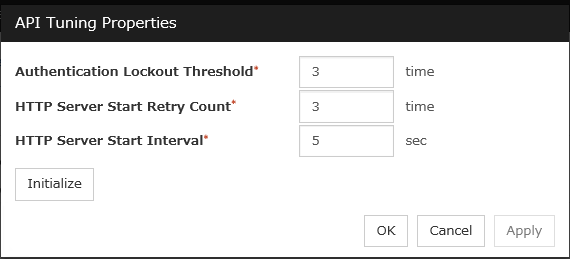
6.1.11. Encryption tab
Specify the settings for a file and a library to be used for the encryption of cluster related services.
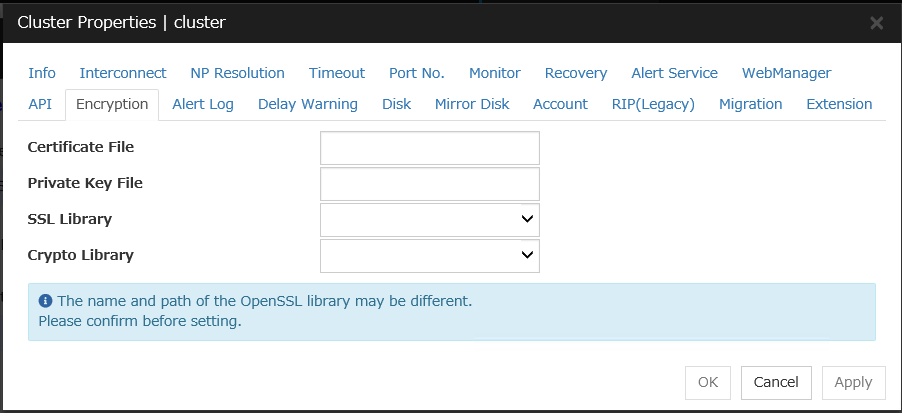
Certificate File
Sets the server credential file used for connecting to a client. Users need to prepare the server credential file.
Private Key File
Sets the private key file used for connecting to a client. Users need to prepare the private key file.
SSL Library
Sets the SSL library file used for encryption and selects the SSL library file included in OpenSSL. Users need to change it based on the environment, such as an installation folder.
Crypto Library
Sets the Crypto library file used for encryption and selects the Crypto library file included in OpenSSL. Users need to change it based on the environment, such as an installation folder.
6.1.12. Alert Log tab
Specify the settings for the alert log.
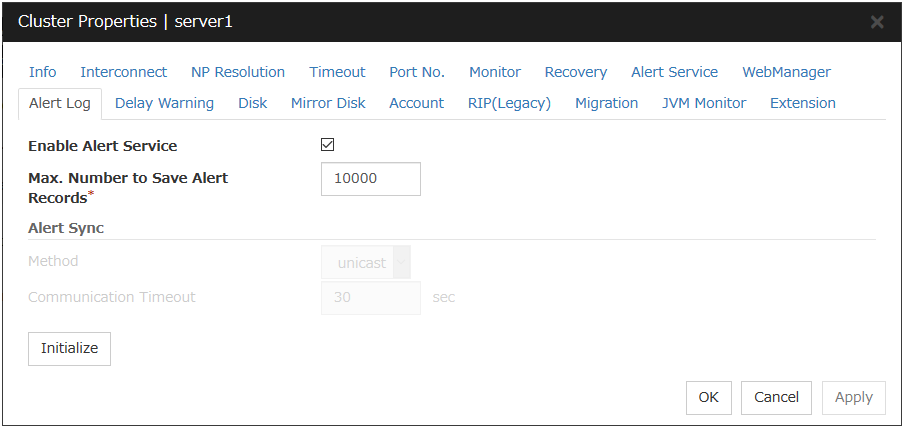
Enable Alert Service
Select this to start EXPRESSCLUSTER Web Alert service for the server.
Max. Number to Save Alert Records (1 to 99,999)
Specify the maximum number of alert records that can be retained. EXPRESSCLUSTER Web Alert service for server can retain alert messages up to this number.
Alert Sync: Method
Not used.
Alert Sync: Communication Timeout (1 to 300)
Not used.
Initialize
Used for initializing the value to the default value. Click Initialize to initialize all the items to their default values.
6.1.13. Delay Warning tab
Specify the settings for Delay Warning on this tab. For details about Delay Warning, see "Delay warning of a monitor resource" in "7. Monitoring details".
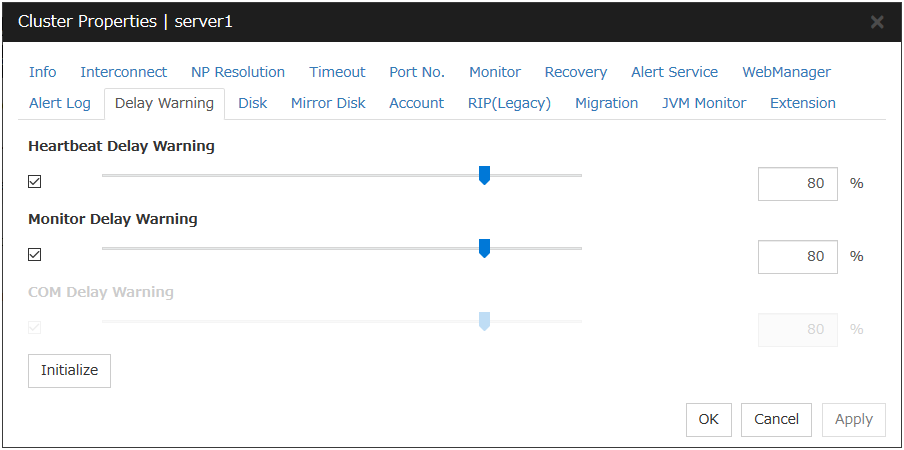
Heartbeat Delay Warning (1 to 99)
Set a percentage of heartbeat timeout at which the heartbeat delay warning is issued. If the time for the percentage passes without any heartbeat response, the warning will be produced in an alert log.
Monitor Delay Warning (1 to 99)
Set a percentage of monitor timeout at which the monitor delay warning is issued. If the time for the percentage passes without any monitor response, the warning will be produced in an alert log.
COM Delay Warning (1 to 99)
Not used.
Initialize
Used for initializing the value to the default value. Click Initialize to initialize all the items to their default values.
6.1.14. Disk tab
Not used.
6.1.15. Mirror Disk tab
Not used.
6.1.16. Account tab
The Account tab is used to register and/or delete the user account that is used in the /U option of the ARMLOAD command (compatible command) or the script executed by the cluster system. You can set up to 16 (sixteen) user accounts.
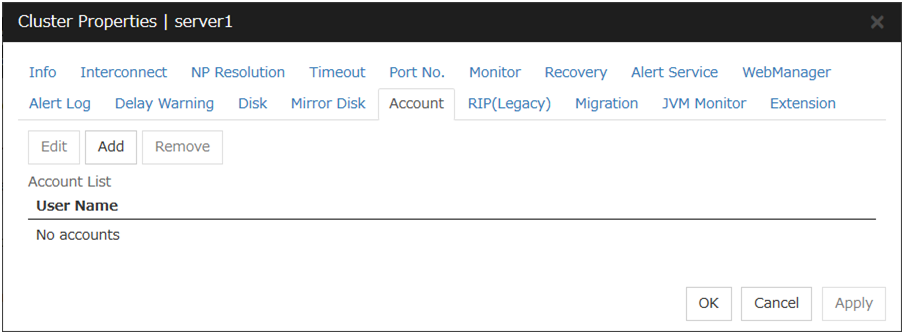
Add
Use Add to add a user account on the Account List. Click Add to display the Enter account dialog box.
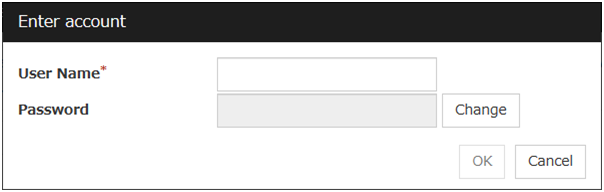
Remove
Use Remove to remove a user account from the Account List. Select the user account you want to remove from Account and then click Remove.
Edit
Use Edit to edit a user account. Select the user account you want to edit from Account and then click Edit. The Enter account dialog box where the selected account was entered is displayed.
6.1.17. RIP (Legacy) tab
Not used.
6.1.18. Migration tab
Not used.
6.1.19. JVM monitor tab
Configure detailed parameters for the JVM monitor.
Note
To display the JVM monitor tab in the config mode of Cluster WebUI, you need to execute Update Server Info after the license for Java Resource Agent is registered.
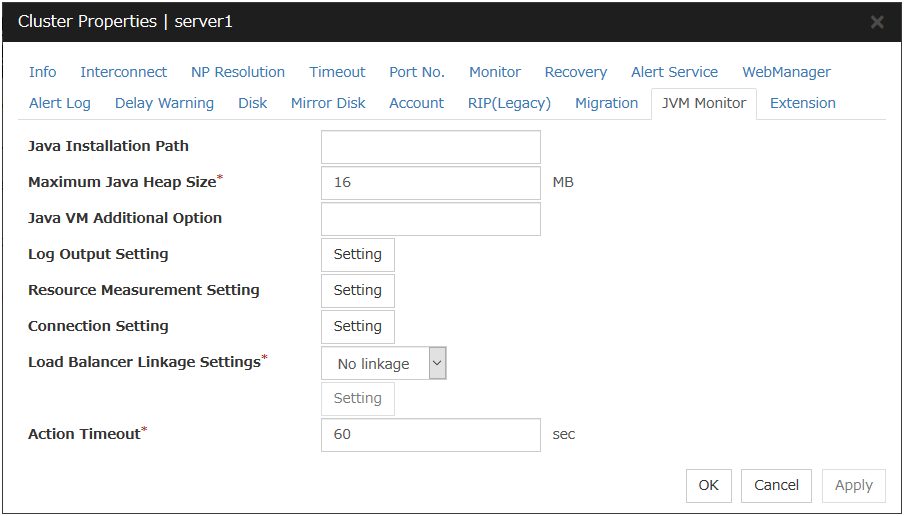
Java Installation Path (Within 255 bytes)
Set the Java VM install path used by the JVM monitor. Specify an absolute path using ASCII characters. Do not add "\" to the end of the path. Specification example:
C:\Program Files\Java\jdk1.8.0_102
Maximum Java Heap Size (7 to 4096)
Set, in megabytes, the maximum Java VM heap size used by the JVM monitor (equivalent to -Xmx of the Java VM startup option).
Java VM Additional Option (Within 1024 bytes)
Set the Java VM startup option used by the JVM monitor. However, specify -Xmx for Maximum Java Heap Size. Specification example: -XX:+UseSerialGC
Log Output Setting
Click the Setting button to open the Log Output Setting dialog box.
Resource measurement Setting
Click the Setting button to open the Resource Measurement Setting dialog box.
Connection Setting
Click the Setting button to open the Connection Setting dialog box.
Load Balancer Linkage Settings
Click the Setting button to open the Load Balancer Linkage Settings dialog box.
Action Timeout (30 to 300)
Set a timeout value for the Command that has been specified on each window of the JVM monitor. This setting becomes common for all of the Commands.
Log Output Setting
Clicking Setting displays the Log Output Setting dialog box.
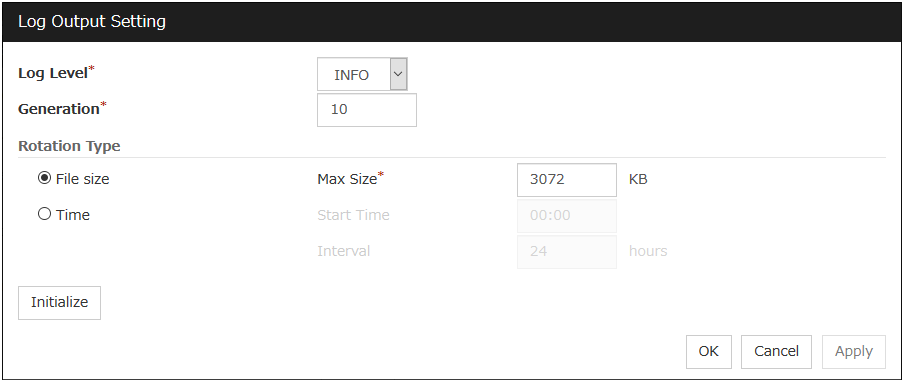
Log Level
Select the log level of the log output by the JVM monitor.
Generation (2 to 100)
Set the number of generations to be retained for the log output by the JVM monitor. When Period is selected for Rotation Type, the rotation count is reset when cluster is suspended. Therefore, note that log files under the
<EXPRESSCLUSTER_install_path>log\ha\jraincrease per cluster suspend.
Rotation Type
Select a rotation type for the log output by the JVM monitor. If you select File Capacity as the rotation type, set the maximum size (200 to 2097151), in kilobytes, for each log file such as the JVM operation log. If you select Period as the rotation type, set the log rotation start time in "hh:mm" format (hh: 0 to 23, mm: 0 to 59) and the rotation interval (1 to 8784) in hours.
Initialize
Clicking Initialize returns the log level, generation, and rotation type items to their default values.
Resource Measurement Setting [Common]
Clicking Setting displays the Resource Measurement Setting dialog box. For details on the scheme for error judgment by the JVM monitor, see "5. Monitor resource details".
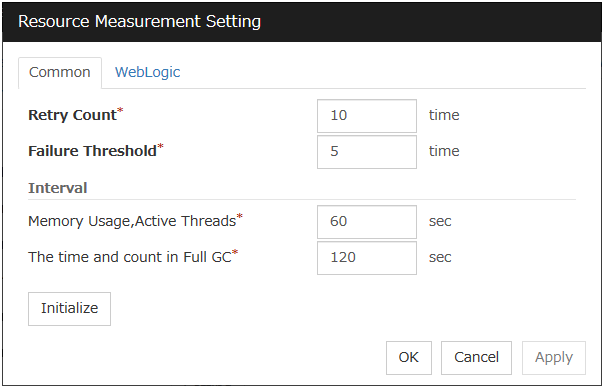
Retry Count (1 to 1440)
Set the resource measurement retry count to be applied if the JVM monitor fails in resource measurement.
Error Threshold (1 to 10)
Set the number of times abnormal judgment is performed when the usage of the Java VM or the application server resources collected by the JVM monitor via resource measurement continuously exceed the customer-defined threshold.
Memory Usage, Active Threads (15 to 600)
Set the interval at which the JVM monitor measures the memory usage and active thread count.
The time and count in Full GC (15 to 600)
Set the interval at which the JVM monitor measures the time and count in Full GC execution.
Initialize
Clicking Initialize returns the retry count, error threshold, and interval items to their default values.
Resource Measurement Setting [WebLogic]
Clicking Setting displays the Resource Measurement Setting dialog box. For details on the scheme for error judgment by the JVM monitor, see "5. Monitor resource details".
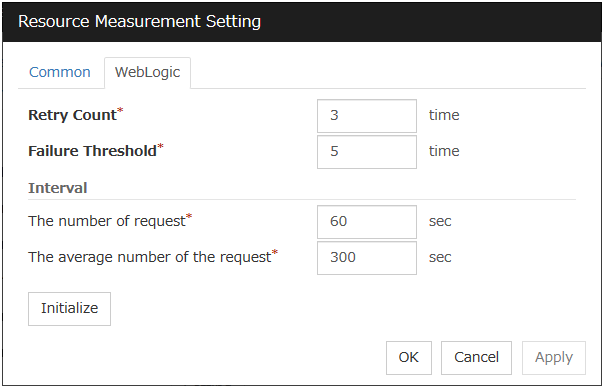
Retry Count (1 to 5)
Set the resource measurement retry count to be applied if the JVM monitor fails in resource measurement.
Error Threshold (1 to 10)
Set the number of times abnormal judgment is performed when the usage of the Java VM or the application server resources collected by the JVM monitor via resource measurement continuously exceed the customer-defined threshold.
The number of request (15 to 600)
Set the interval at which the JVM monitor measures the number of work manager or thread pool requests during WebLogic monitor.
The average number of the request (15 to 600)
Set the interval at which the JVM monitor measures the average number of work manager or thread pool requests during WebLogic monitor. Set a value that is an integer multiple of the value set in Interval: The number of request.
Initialize
Clicking Initialize returns the retry count, error threshold, and interval items to their default values.
Connection Setting
Clicking Setting displays the Connection Settings dialog box.
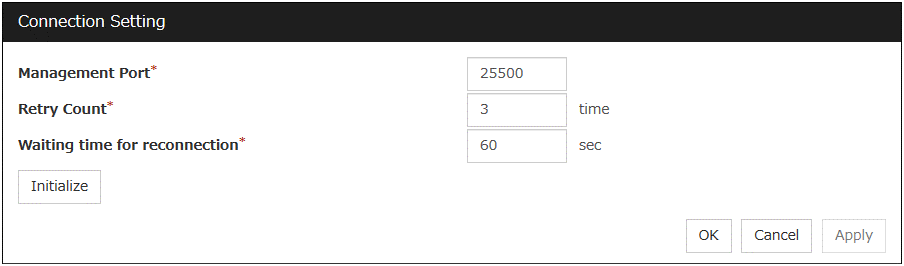
Management Port (1 to 65535)
Sets the port number internally used by the JVM monitor resource. Make sure not to set the port number that has been used by other functions or programs.Set the number of the port connected to the monitor target Java VM. Do not set 42424 to 61000.
Retry Count for (1 to 5)
Set the retry count to be applied if connection to the monitor target Java VM fails.
Waiting time for reconnection (15 to 60)
Set the interval at which the JVM monitor retries connection if it fails in Java VM connection.
Initialize
Clicking Initialize sets the management port, retry count, and waiting time for reconnection items to their default values.
Load Balancer Linkage Settings
Clicking Setting displays the Load Balancer Linkage Settings dialog box.
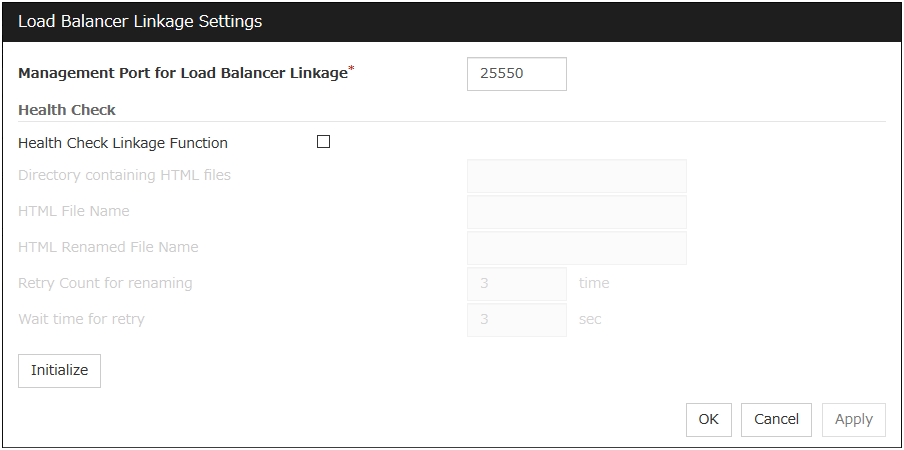
Management Port for Load Balancer Linkage (1 to 65535)
Set the port number used by the load balancer linkage function. Do not set 42424 to 61000.
Health Check Linkage Function
Set whether to use the load balancer health check function if the monitor target Java VM detects a failure.
Directory containing HTML files (up to 255 bytes)
Set the directory in which the HTML file used by the load balancer health check function is stored.
HTML File Name (Within 255 bytes)
Set the HTML file name used by the load balancer health check function.
HTML Renamed File Name (Within 255 bytes)
Set the HTML renamed file name used by the load balancer health check function.
Retry count for renaming (0 to 5)
Set the number of times HTML file renaming is retried if it fails.
Wait time for retry (1 to 60)
Set the interval at which HTML file renaming is retried if it fails.
Initialize
Clicking Initialize returns the management port for load balancer linkage, health check linkage function, directory containing HTML files, HTML file name, HTML renamed file name, retry count for renaming, and wait time for retry retry interval items to their default values.
Load Balancer Linkage Settings
Select BIG-IP LTM as the load balancer type and then click the Settings button. The Load Balancer Linkage Settings dialog box appears.
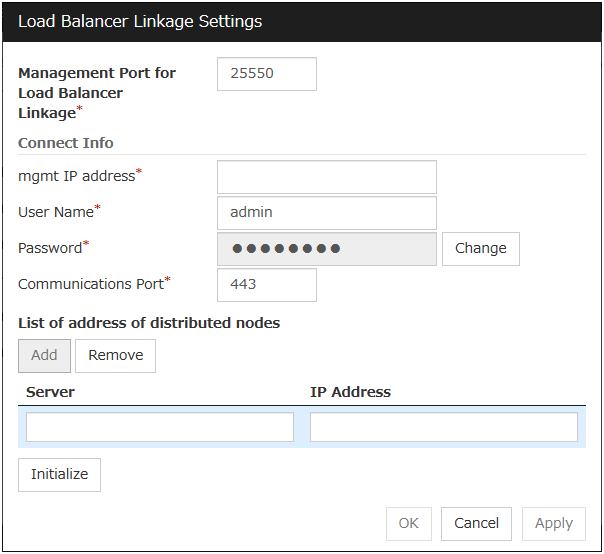
Management Port for Load Balancer Linkage (1 to 65535)
Set the port number used by the load balancer linkage function. Do not set 42424 to 61000.
mgmt IP address
Set the BIG-IP LTM IP address.
User Name (Within 255 bytes)
Set the BIG-IP LTM management user name.
Password (Within 255 bytes)
Set the BIG-IP LTM management user password.
Communications Port (1 to 65535)
Set the communication port number for BIG-IP LTM.
Add
Add the server name and IP address for the distributed node. For the server name, specify the computer name. For the IP address, specify the value set to Members in LocalTrafic - Pools:PoolList - Relevant pool - Members of BIG-IP Configuration Utility.To change the value, select the line and directly edit the description.
Remove
Remove the server name and IP address for the distributed node. Select the line to be removed and then click Remove. The selected server is removed.
Initialize
Clicking Initialize returns the management port for load balancer linkage, management user name, and communication port number to the default settings.
6.1.20. Extension tab
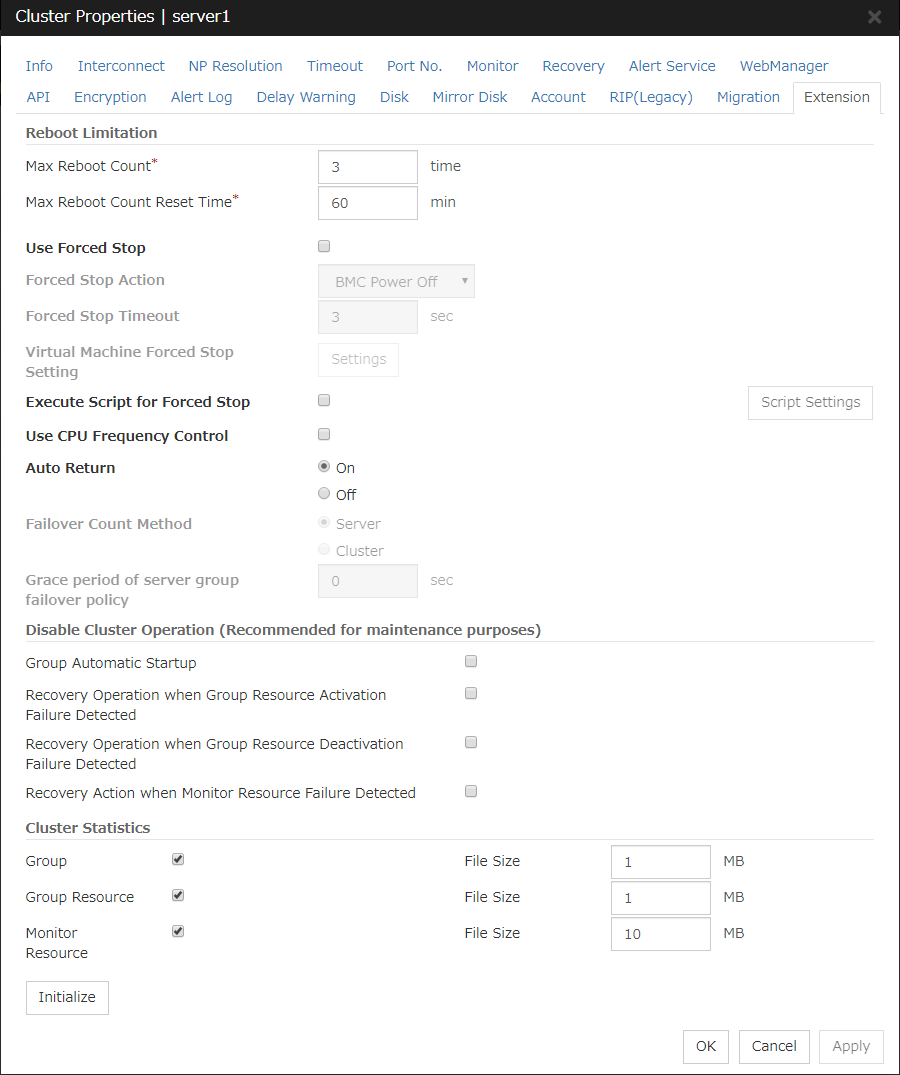
Reboot Limitation
You can specify the Reboot OS or Shut down OS as the final action at abnormality detection for group resources and monitor resources. If either of them is selected, reboot may be repeated infinitely. By setting the reboot limit, you can prevent repeated reboots.
- Max Reboot Count (0 to 99)Specify how many times the operating system can reboot. The number specified here is separately counted for group resource and monitor resource.
- Max Reboot Count Reset Time (0 to 999)When the max reboot count is specified, if the operation from the cluster startup keeps running normally for the time specified here, the reboot count is reset. The time specified here is separately counted for group resource and monitor resource.
Note
If Max Reboot Count is set to 1 or greater, set Max Reboot Count Reset Time also to 1 or greater. If the time to reset the maximum reboot count is set to zero (0), the number of reboot will be unavailable, thus, shutdown/reboot are executed every time at failure detection regardless of the maximum reboot count.
Use Forced Stop
Not used.
Forced Stop Action
Not used.
Forced Stop Timeout (0 to 99)
Not used.
Virtual Machine Forced Stop Setting
Not used.
Execute Script for Forced Stop
Not used.
Script Settings
Not used.
Use CPU Frequency Control
Select the checkbox when you use CPU frequency control. If you uncheck the checkbox, CPU frequency control is disabled.
See also
Note
For using CPU frequency control, it is required that the frequency is changeable in BIOS settings and the CPU supports the frequency control by Windows OS power management function.
Note
If you disable CPU frequency control function with CPU frequency changed, the CPU frequency does not return to the state before changing. In this case, return the CPU frequency to the defined value by the following way.
Auto Return
Failover Count Method
Not used.
Grace period of server group failover policy (0 to 999)
Not used.
Disable cluster operation
Note
Disabling the recovery action when monitor resource failure detected does not affect the following actions.- Action when the stall failure of disk RW monitor resources is detected- Action when the user mode monitor resources timeout occurs- Recovery action of the message receive monitor resource
Cluster Statistics
You can collect and see data on the cluster operation such as the required time of a group failover and that of resource activation.
For more information, see "Cluster statistics information collection function" in "The system maintenance information" in the "EXPRESSCLUSTER X Maintenance Guide".
Initialize
Used for initializing the value to the default value. Click Initialize to initialize all the items to their default values.
6.2. Server properties
In the Server Properties window, you can add, remove, and edit interfaces, such as IP addresses and devices, that are used by the server. From the aspect of network environment, IP addresses have the following restrictions:
One server cannot have two or more IP addresses that belong to the same network address. Likewise, containment is not allowed as follows.
IP address: 10.1.1.10, Subnet mask: 255.255.0.0
IP address: 10.1.2.10, Subnet mask: 255.255.255.0
6.2.1. Info tab
You can display the server name, and register and make a change to a comment on this tab.
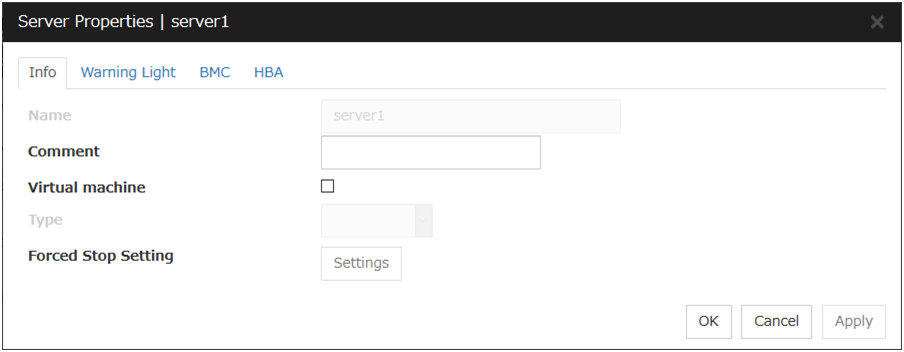
Name:
The selected server name is displayed. You cannot change the name here.
Comment (within 127 bytes)
You can specify a comment for the server. You can only enter one byte English characters.
Virtual Machine
Specify whether this server is a virtual machine (guest OS).
Type
Specify the type of virtual infrastructure.
Forced Stop Setting
Not used.
6.2.2. Warning Light tab
Not used.
6.2.3. BMC tab
Not used.
6.2.4. HBA tab
Not used.
6.3. Upper limits of registration
Version |
You can register up to |
|
|---|---|---|
Server |
4.0.0-1 or later |
1 |
Group |
4.0.0-1 or later |
128 |
Group resource
(Per one group)
|
4.0.0-1 or later |
512 |
Monitor resource |
4.0.0-1 or later |
384 |
System monitor resource |
4.0.0-1 or later |
1 |
Process resource monitor resource |
4.0.0-1 or later |
1 |
7. Monitoring details
This chapter provides details about how several different types of errors are detected, in order to help you find out how to best set up the monitor interval, monitor timeout, and monitor retry count.
This chapter covers:
7.2. Enabling and disabling Dummy failure of monitor resources
7.6. Activation or deactivation error for the recovery target during recovery
7.10. Limiting the reboot count for error detection by a monitor resource
7.1. Always monitor and Monitors while activated
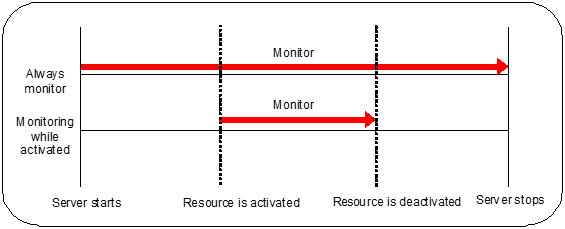
7.2. Enabling and disabling Dummy failure of monitor resources
- Operation on Cluster WebUI (verification mode)On the Cluster WebUI(Verification mode), shortcut menus of the monitor resources which cannot control monitoring are disabled.
- Operation by using the clpmonctrl commandThe clpmonctrl command can control only monitor resources on the server where this command is run. When the clpmonctrl command is executed on monitor resource which cannot be controlled, dummy failure is not enabled even though the command succeeds.
Dummy failure of a monitor resource is disabled if the following operations are performed.
Dummy failure was disabled on Cluster WebUI (verification mode)
"Yes" was selected from the dialog displayed when the Cluster WebUI mode changes from verification mode to a different mode.
-n was specified to enable dummy failure by using the clpmonctrl command
Stop the cluster
Suspend the cluster
7.3. Monitor resource monitor interval
All monitor resources monitor their targets at every monitoring interval.
Following are different timelines illustrating how a monitor resource performs monitoring with or without an error based on the specified monitor interval.
When no error is detected
Examples of behavior when the following values are set.
<Monitor>Monitor Interval 30 secMonitor Timeout 60 secMonitor Retry Count 0 times
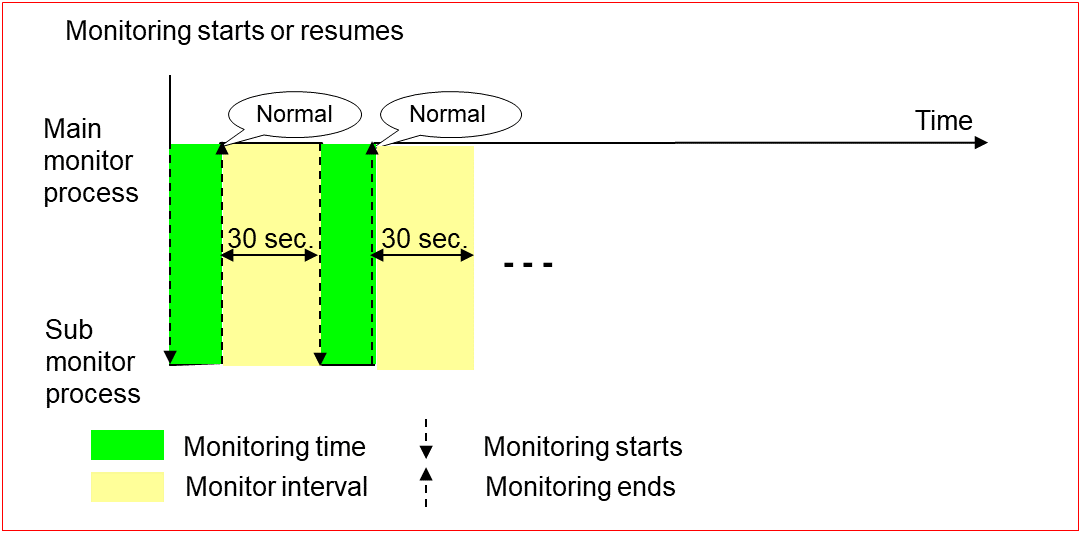
When an error is detected (without monitor retry settings)
Examples of behavior when the following values are set.
<Monitor>Monitor Interval 30 secMonitor Timeout 60 secMonitor Retry Count 0 times<Error Detection>Recovery Action Restart the recovery targetRecovery Target GroupRecovery Script Execution Count 0 timeReactivation Threshold 0 timeFinal Action No Operation
After an error occurs, it is detected next time monitoring is performed, and then the recovery target is reactivated.
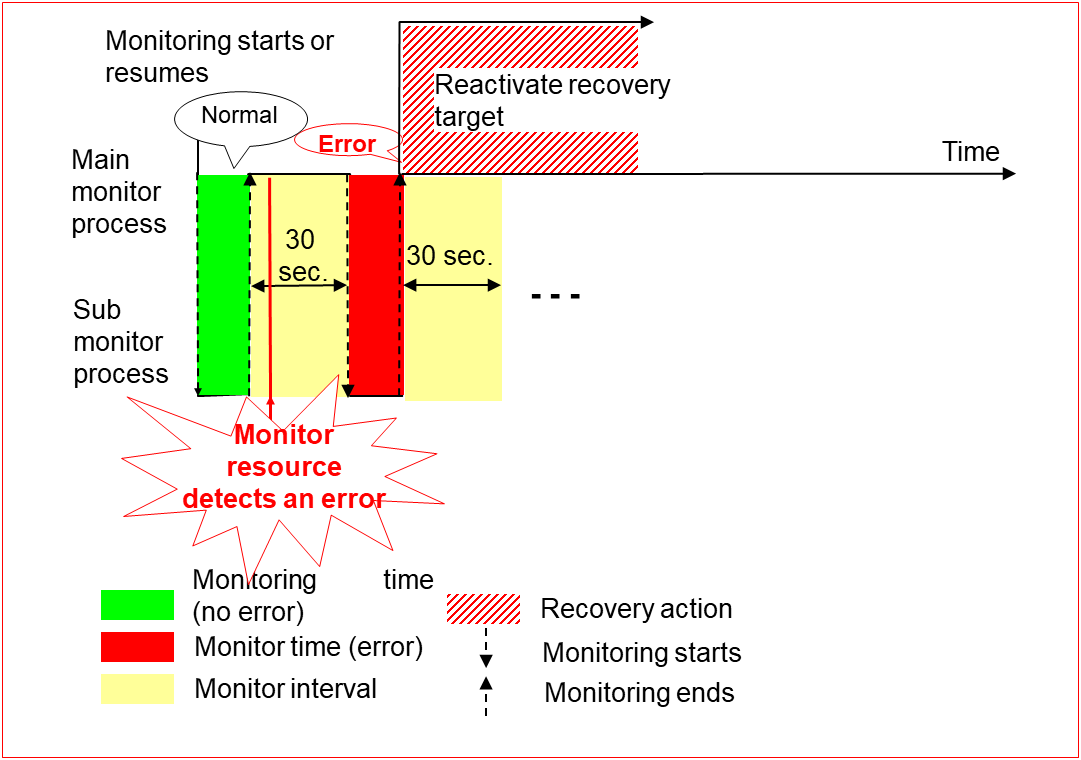
When an error is detected (with monitor retry settings)
Examples of behavior when the following values are set.
<Monitor>Monitor Interval 30 secMonitor Timeout 60 secMonitor Retry Count 2 times<Error Detection>Recovery Action Restart the recovery targetRecovery Target GroupRecovery Script Execution Count 0 timeReactivation Threshold 0 timeFinal Action No Operation
After an error occurs, it is detected next time monitoring is performed, and then, if recovery cannot be achieved before the monitor retry count is reached, the recovery target is reactivated.
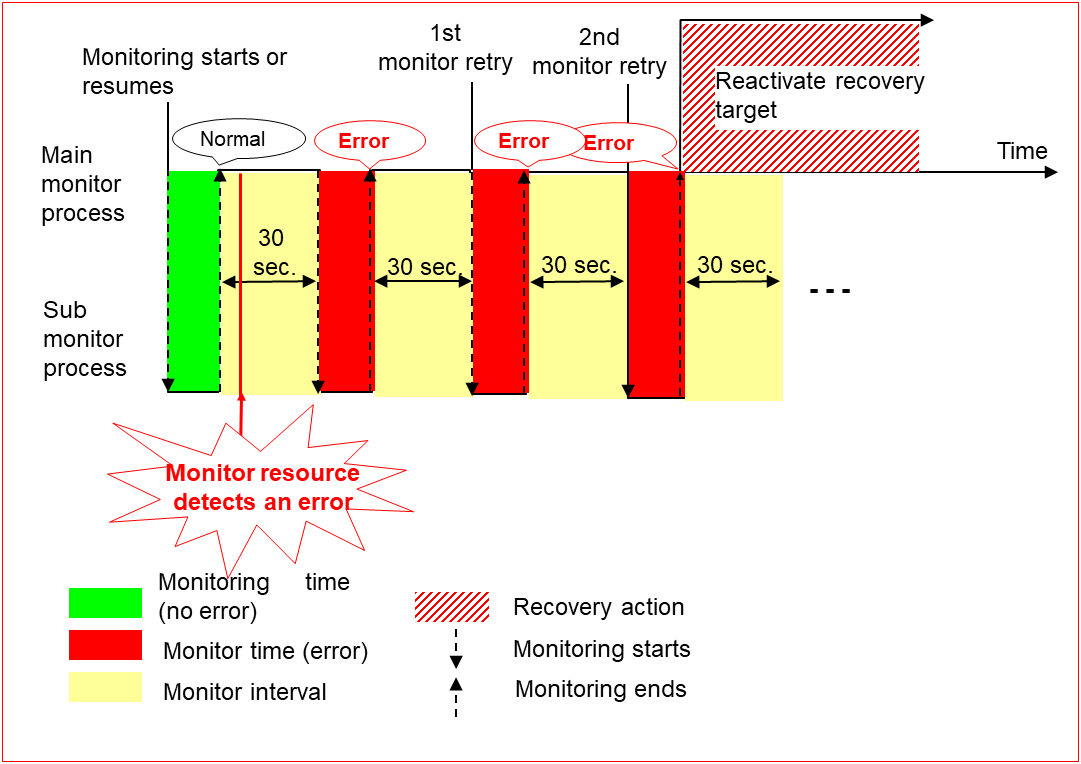
When an error is detected (without monitor retry settings)
Examples of behavior when the following values are set.
<Monitor>Monitor Interval 30 secMonitor Timeout 60 secMonitor Retry Count 0 times<Error Detection>Recovery Action Restart the recovery targetRecovery Target GroupRecovery Script Execution Count 0 timeReactivation Threshold 0 timeFinal Action No Operation
After a monitor timeout occurs, the recovery target is immediately reactivated for the recovery action.
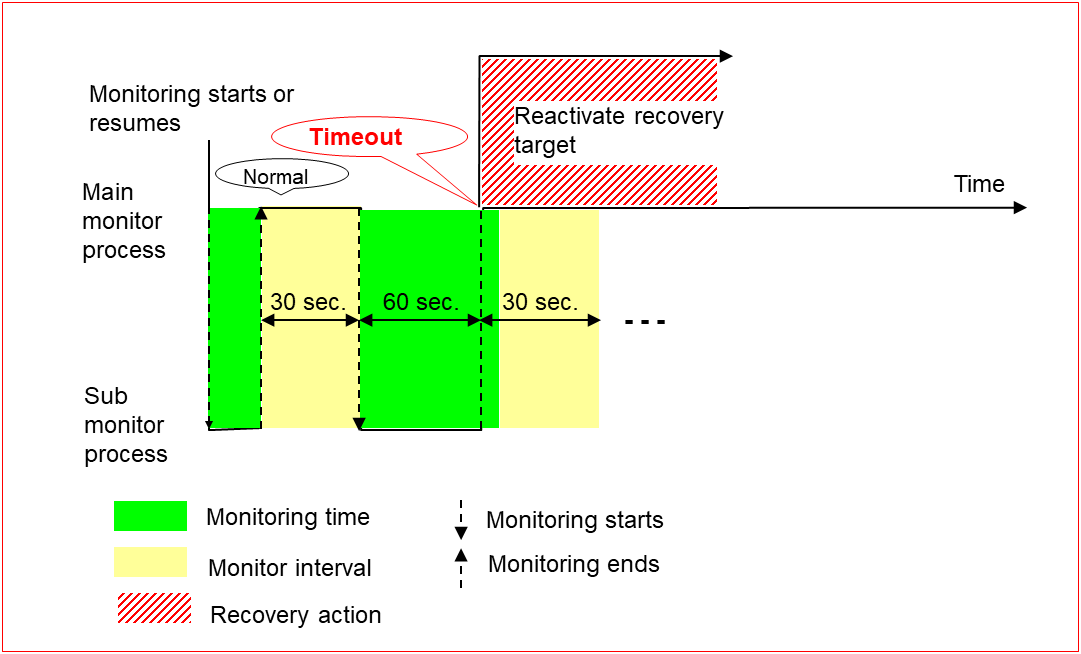
When a monitoring timeout is detected (with monitor retry setting)
Examples of behavior when the following values are set.
<Monitor>Monitor Interval 30 secMonitor Timeout 60 secMonitor Retry Count 1 times<Error Detection>Recovery Action Restart the recovery targetRecovery Target GroupRecovery Script Execution Count 0 timeReactivation Threshold 0 timeFinal Action No Operation
After a monitor timeout occurs, another monitor attempt is made and, if it fails, the recovery target is reactivated.
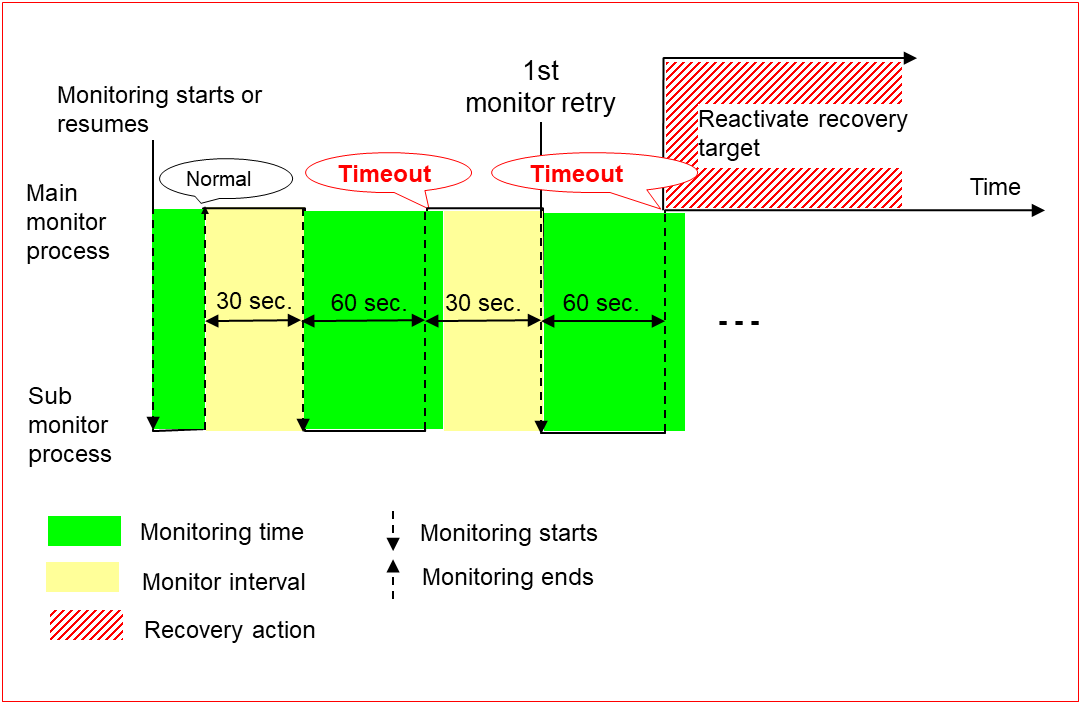
7.4. Action when an error is detected by a monitor resource
When an error is detected, the following recovery actions are taken against the recovery target in sequence:
Execution of the recovery script: this takes place when an error is detected in a monitor target.
Reactivation of the recovery target: this takes place if the recovery script is executed up to the recovery script execution count. When the execution of a pre-reactivation script is specified, reactivation starts after that script has been executed.
When an error is detected in the monitor target, the recovery target is reactivated. (This is not the case if Execute Only Final Action is selected for Recovery Action or if Maximum Reactivation Count is set to 0 in Custom).
If reactivation fails or the error is detected again after reactivation, the final action is performed. (If Maximum Reactivation Count is set to 2 or greater in Custom, reactivation is retried the specified number of times.).
No recovery action is taken if the status of the recovery target is:
Recovery Target |
Status |
Reactivation 2 |
Final Action 3 |
|---|---|---|---|
Group/Group Resource |
Already stopped |
No |
No |
Being activated/stopped |
No |
No |
|
Already activated |
Yes |
Yes |
|
Error |
Yes |
Yes |
|
Local Server |
- |
- |
Yes |
- 2
Effective only when the value for the reactivation threshold is set to 1 (one) or greater.
- 3
Effective only when an option other than No Operation is selected.
Note
Do not perform the following operations by using the Cluster WebUI or command line while recovery processing is changing (reactivation -> last operation), if a group resource (an application resource, service resource, or other resource) is specified as a recovery target and when a monitor resource detects an error.
Stopping/suspending the cluster
Starting/stopping/moving a group
7.5. Recovering from a monitor error (normal)
7.6. Activation or deactivation error for the recovery target during recovery
When the monitoring target of the monitor resource is the device used for the group resource of the recovery target, an activation/deactivation error of the group resource may be detected during recovery when a monitoring error is detected.
7.7. Recovery/pre-recovery action script
Environment variables used in the recovery/pre-recovery action script
EXPRESSCLUSTER sets status information (the recovery action type) in the environment variables upon the execution of the script.The script allows you to specify the following environment variables as branch conditions according to the operation of the system.
Environment variable
Value of the environment variable
Description
Example: C:\Program Files\EXPRESSCLUSTER SSSRECOVERY
Execution as a recovery script.
RESTART
Execution before reactivation.
FAILOVER
Not used.
FINALACTION
Execution before final action.
Note
The same information as Windows Server 2012 is set by CLP_OSNAME and CLP_OSVER after Windows Server 2012 R2.
Writing recovery/pre-recovery action scripts
This section explains the environment variables mentioned above, using a practical scripting example.
Example of a recovery/pre-recovery action script
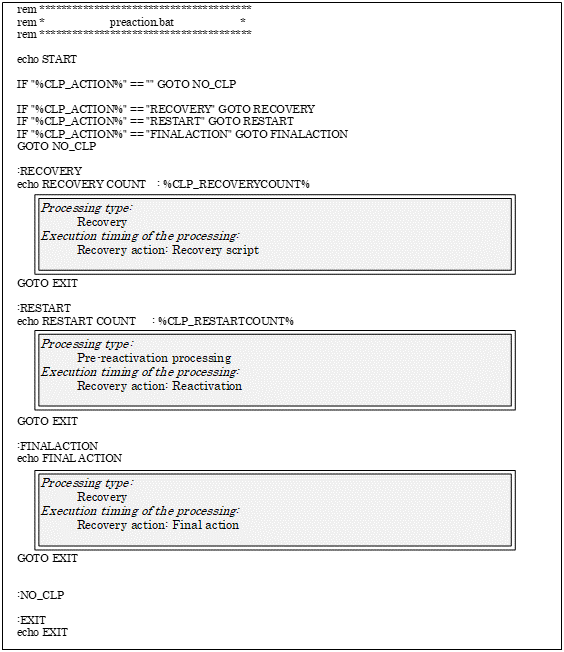
Tips for recovery/pre-recovery action script coding
Pay careful attention to the following points when coding the script.
When the script contains a command that requires a long time to run, log the end of execution of that command. The logged information can be used to identify the nature of the error if a problem occurs. clplogcmd is used to log the information.
Note on the recovery/pre-recovery action script
None.
7.8. Delay warning of a monitor resource
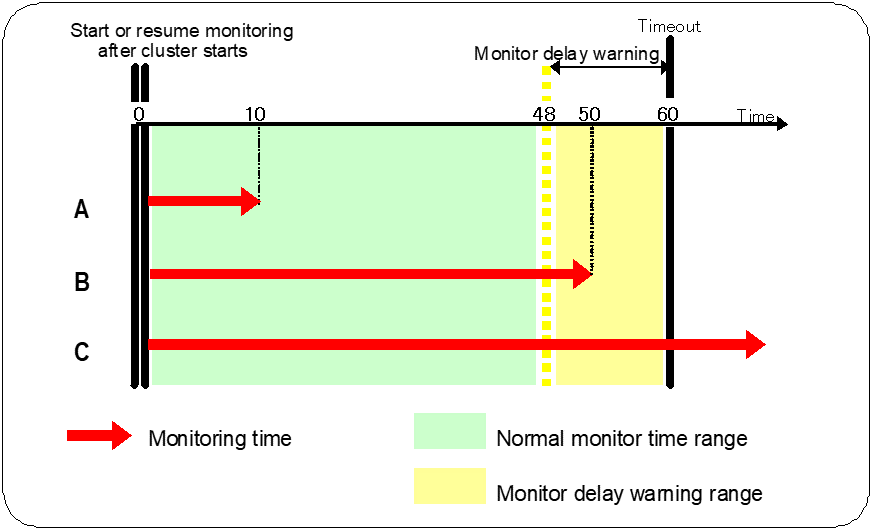
- The time for monitor processing is 10 seconds. The monitor resource is in normal status.In this case, no alert is used.
- The time for monitor processing is 50 seconds and the delay of monitoring is detected during this time. The monitor resource is in the normal status.In this case, an alert is used because the delay warning rate has exceeded 80%.
- The time for monitor processing has exceeded 60 seconds of the monitoring timeout and the delay of monitoring is detected. The monitor resource has a problem.In this case, no alert is used.
See also
To configure the delay warning of monitor resources, click Cluster Properties and select Monitor Delay Warning in the Delay Warning tab.
7.9. Waiting for a monitor resource to start monitoring
Configuration of monitor resource
<Monitor>Interval 30 secTimeout 60 secRetry Count 0 timesWait Time to Start Monitoring 0 sec / 30 sec
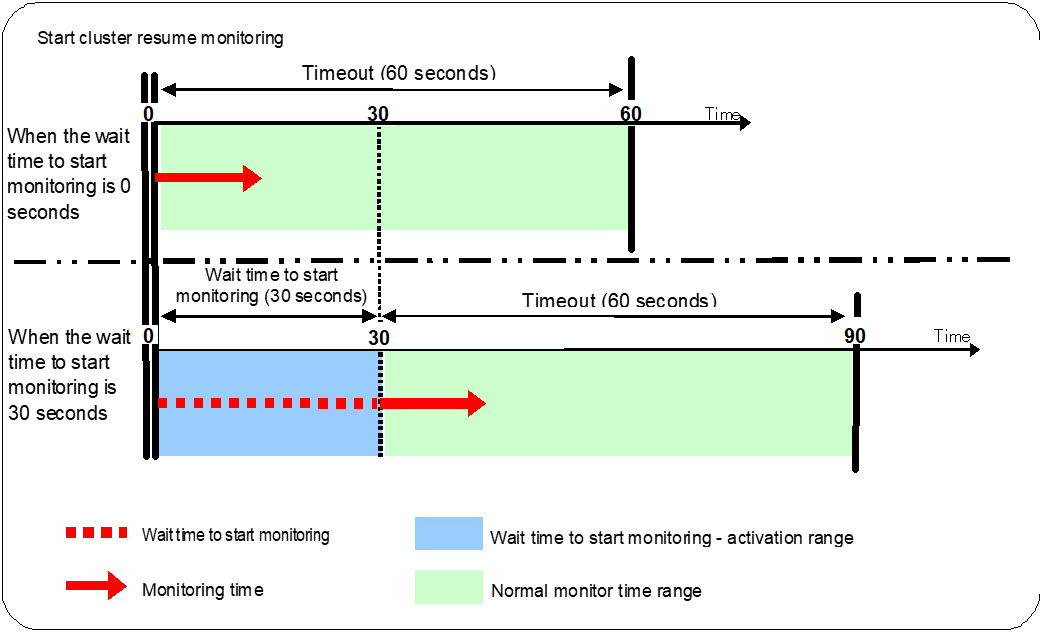
Note
Monitoring will restart after the time specified to wait for start monitoring has elapsed even when the monitor resource is suspended and/or resumed by using the monitoring control commands.
Configuration of application monitor resource
<Monitor>Interval 5 secTimeout 60 secRetry Count 0 timesWait Time to Start Monitoring 0 sec (default)<Error Detection>Recovery Action Restart the following targetRecovery Target appli1Final Action Stop Group
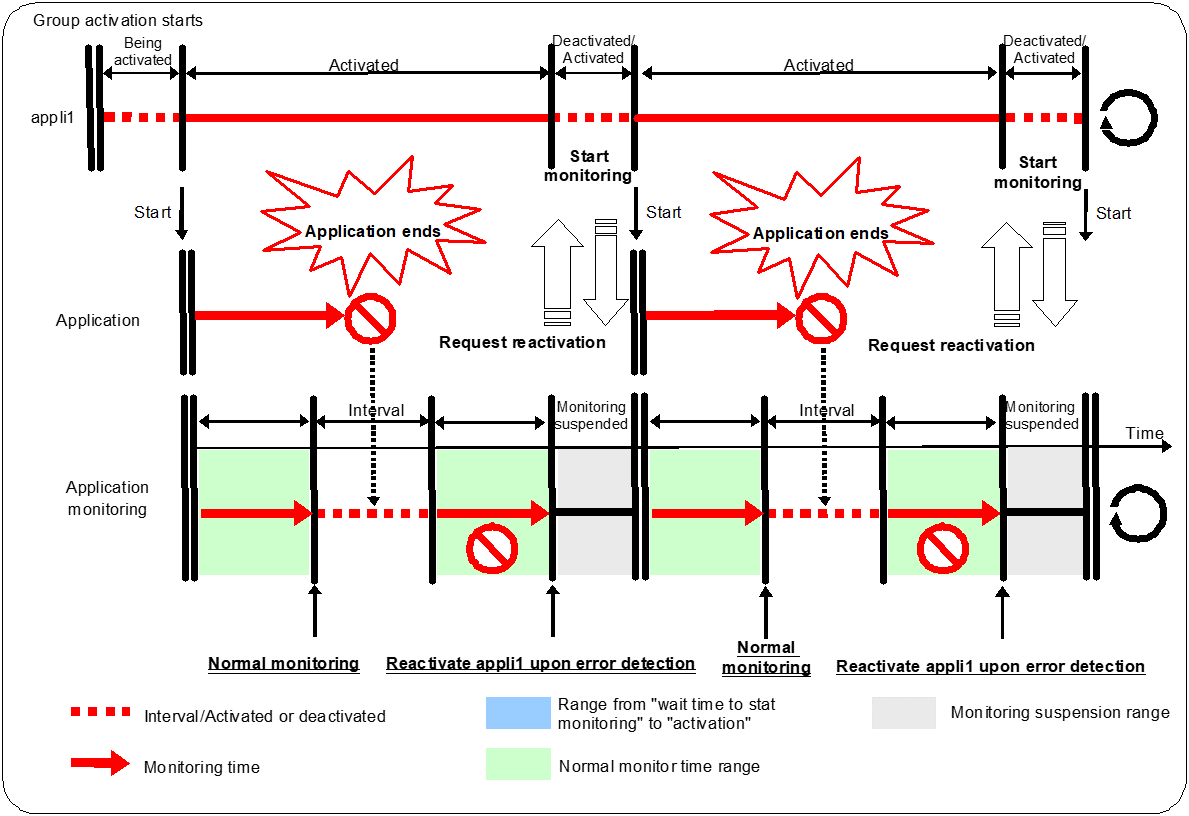
Configuration of application monitor resource
<Monitor>Interval 5 secTimeout 60 secRetry Count 0 timesWait Time to Start Monitoring: 60 sec<Error Detection>Recovery Action Restart the following targetRecovery Target appli1Final Action Stop Group
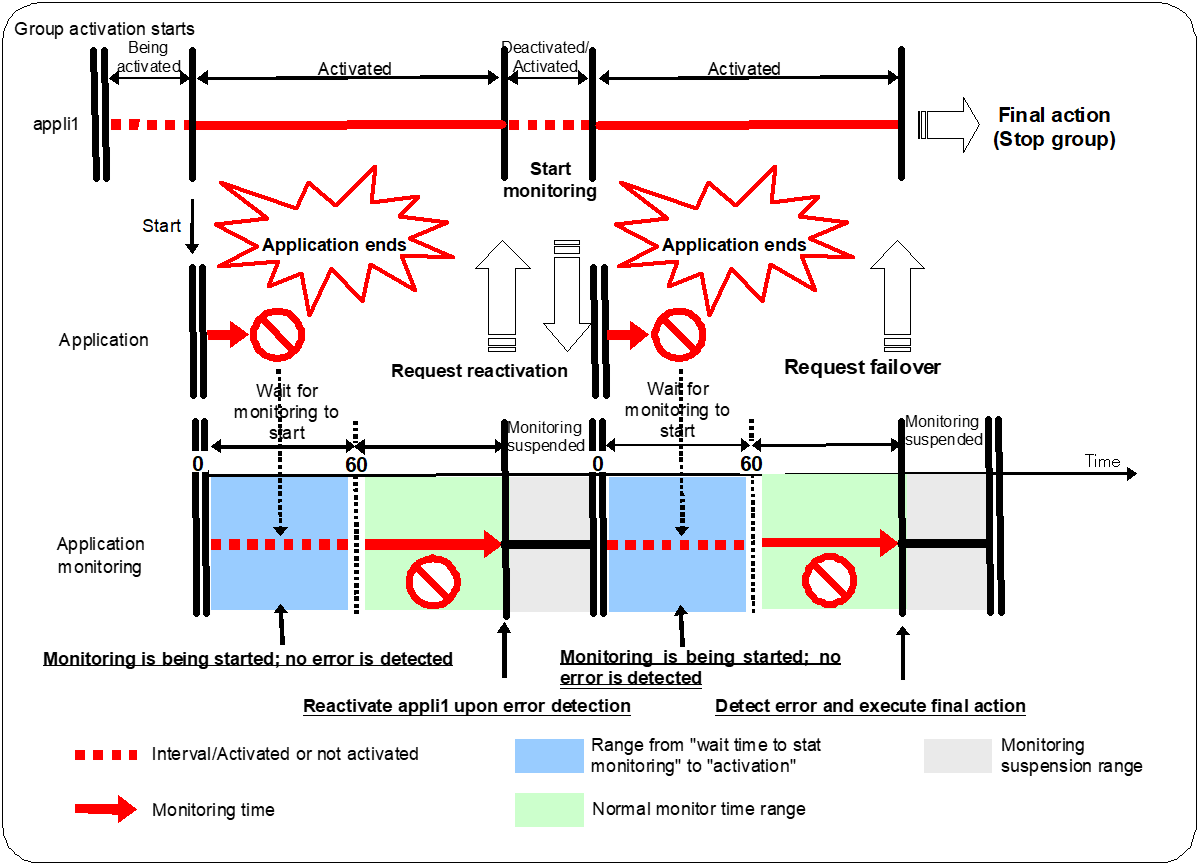
7.10. Limiting the reboot count for error detection by a monitor resource
When Stop cluster service and shutdown OS or Stop cluster service and reboot OS is selected as a final action to be taken when an error is detected by the monitor resource, the number of shutdowns or reboots can be limited.
Run the clpregctrl command to reset the reboot count. For details about the clpregctrl command, see " EXPRESSCLUSTER X SingleServerSafe command reference" in the "EXPRESSCLUSTER X SingleServerSafe Operation Guide".
Note
8. Notes and Restrictions
This chapter provides information on known problems and how to troubleshoot the problems.
This chapter covers:
8.1. Designing a system configuration
This section describes the items to note when selecting hardware and designing a system configuration.
8.1.1. EXPRESSCLUSTER X Alert Service
The license for the EXPRESSCLUSTER X Alert Service allows you to use the mail report function, but not the warning light function.
8.1.2. JVM monitor resources
Up to 25 Java VMs can be monitored concurrently. The Java VMs that can be monitored concurrently are those which are uniquely identified by the Cluster WebUI (with Identifier in the Monitor (special) tab)
Connections between Java VMs and JVM monitor resources do not support SSL.
If, during the monitoring of Java VM, there is another process with the same name as the monitoring target, C heap monitoring may be performed for a different monitoring target.
It may not be possible to detect thread deadlocks. This is a known problem in Java VM. For details, refer to "Bug ID: 6380127" in the Oracle Bug Database
The JVM monitor resources can monitor only the Java VMs on the server on which the JVM monitor resources are running.
Application monitoring is disabled when an application to be monitored on the IA32 version is running on an x86_64 version OS.
If a large value such as 3,000 or more is specified as the maximum Java heap size by the Cluster WebUI (by using Maximum Java Heap Size on the JVM monitor tab in Cluster Property), The JVM monitor resources will fail to start up. The maximum heap size differs depending on the environment, so be sure to specify a value based on the capacity of the mounted system memory.
If you want to take advantage of the target Java VM load calculation function of coordination load balancer is recommended for use in SingleServerSafe.
- If "-XX:+UseG1GC" is added as a startup option of the target Java VM, the settings on the Memory tab on the Monitor(special) tab in Property of JVM monitor resources cannot be monitored before Java 7.It's possible to monitor by choosing Oracle Java (usage monitoring) in JVM Type on the Monitor(special) tab after Java 8.
8.2. Notes when creating the cluster configuration data
This section describes the items to note before designing and creating configuration data based on the system configuration.
8.2.1. Folders and files in the location pointed to by the EXPRESSCLUSTER X SingleServerSafe installation path
8.2.2. Final action for a group resource deactivation error
8.2.3. Delay warning rate
If the delay warning rate is set to 0 or 100, the following can be achieved:
- When 0 is set to the delay monitoring rateAn alert for the delay warning is issued at every monitoring.By using this feature, you can calculate the polling time for the monitor resource at the time the server is heavily loaded, which will allow you to determine the time for monitoring timeout of a monitor resource.
- When 100 is specified as the delay monitoring rateThe delay warning will not be issued.
Be sure not to set a low value, such as 0%, except for a test operation.
8.2.4. Double-byte character set that can be used in script comments
Scripts edited in Windows environment are dealt as Shift-JIS code, and scripts edited in Linux environment are dealt as EUC code. In case that other character codes are used, character corruption may occur depending on environment.
8.2.5. JVM monitor resource settings
When the monitoring target is WebLogic, the maximum values of the following JVM monitor resource settings may be limited due to the system environment (including the amount of installed memory):
The number under Monitor the requests in Work Manager
Average under Monitor the requests in Work Manager
The number of Waiting Requests under Monitor the requests in Thread Pool
Average of Waiting Requests under Monitor the requests in Thread Pool
The number of Executing Requests under Monitor the requests in Thread Pool
Average of Executing Requests under Monitor the requests in Thread Pool
To use the Java Resource Agent, install the Java runtime environment (JRE) described in " Operation environment for JVM monitor" in " Checking system requirements for EXPRESSCLUSTER X SingleServerSafe" in " About EXPRESSCLUSTER X SingleServerSafe" in the " Installation Guide", or a Java development kit (JDK). You can use either the same JRE or JDK as that used by the monitoring target (WebLogic Server or WebOTX) or a different one. If both JRE and JDK are installed on a server, you can use either one.
To monitor resource name must not include a blank.
Command that is used to run a command according to a failure cause when a failure is detected and the load balancer function cannot be used together.
8.2.6. System monitor resource settings
- Pattern of detection by resource monitoringThe System Resource Agent performs detection by using thresholds and monitoring duration time as parameters.The System Resource Agent collects the data (used size of memory, CPU usage rate, and used size of virtual memory) on individual system resources continuously, and detects errors when data keeps exceeding a threshold for a certain time (specified as the duration time).
8.2.7. Recovery operation when a service fails in a Windows Server 2012-based system
In a Windows Server 2012-based system, the operation actually performed when a service fails if Restart Computer is set as the recovery operation to perform when a service fails (terminates abnormally) has been changed from the conventional one, OS restart (Windows Server 2008 or earlier), to OS restart with a STOP error.
The EXPRESSCLUSTER services for which Restart Computer is set as the recovery operation by default are the following:
EXPRESSCLUSTER Disk Agent service
EXPRESSCLUSTER Server service
EXPRESSCLUSTER Transaction service
8.3. Notes when changing the EXPRESSCLUSTER configuration
The section describes what happens when the configuration is changed after starting to use EXPRESSCLUSTER in the cluster configuration.
8.3.1. Dependency between resource properties
8.3.2. Adding and deleting group resources
Example) Moving script1 (floating ip resource) from failover1 group to failover2 group
Delete script1 from failover1.
Reflect the setting to the system.
Add script1 to failover2.
Reflect the setting to the system.
8.3.3. Setting cluster statistics information of message receive monitor resources
Once the settings of cluster statistics information of monitor resource has been changed, the settings of cluster statistics information are not applied to message receive monitor resources even if you execute the suspend and resume. Reboot the OS to apply the settings to the message receive monitor resources.