1. Preface
1.1. Who Should Use This Guide
The Operation Guide is intended for system administrators who will operate and maintain an introduced system. It describes how to operate EXPRESSCLUSTER X SingleServerSafe.
1.2. How This Guide Is Organized
2. EXPRESSCLUSTER X SingleServerSafe command reference: Describes the usable commands in EXPRESSCLUSTER X SingleServerSafe.
3. Notes and restrictions: Provides information on known problems and restrictions.
4. Error messages: Lists and describes error messages you might encounter when operating EXPRESSCLUSTER X SingleServerSafe.
1.3. Terms Used in This Guide
EXPRESSCLUSTER X SingleServerSafe, which is described in this guide, uses windows and commands common to those of the clustering software EXPRESSCLUSTER X to ensure high compatibility with EXPRESSCLUSTER X in terms of operation and other aspects. Therefore, cluster-related terms are used in parts of the guide.
The terms used in this guide are defined below.
- Cluster, cluster system
A single server system using EXPRESSCLUSTER X SingleServerSafe
- Cluster shutdown, reboot
Shutdown or reboot of a system using EXPRESSCLUSTER X SingleServerSafe
- Cluster resource
A resource used in EXPRESSCLUSTER X SingleServerSafe
- Cluster object
A resource object used in EXPRESSCLUSTER X SingleServerSafe
- Failover group
A group of group resources (such as applications and services) used in EXPRESSCLUSTER X SingleServerSafe
1.4. EXPRESSCLUSTER X SingleServerSafe Documentation Set
The EXPRESSCLUSTER X SingleServerSafe manuals consist of the four guides below. The title and purpose of each guide is described below:
EXPRESSCLUSTER X SingleServerSafe Installation Guide
This guide is intended for system engineers who intend to introduce a system using EXPRESSCLUSTER X SingleServerSafe and describes how to install EXPRESSCLUSTER X SingleServerSafe.
EXPRESSCLUSTER X SingleServerSafe Configuration Guide
This guide is intended for system engineers who intend to introduce a system using EXPRESSCLUSTER X SingleServerSafe and system administrators who will operate and maintain the introduced system. It describes how to set up EXPRESSCLUSTER X SingleServerSafe.
EXPRESSCLUSTER X SingleServerSafe Operation Guide
This guide is intended for system administrators who will operate and maintain an introduced system that uses EXPRESSCLUSTER X SingleServerSafe. It describes how to operate EXPRESSCLUSTER X SingleServerSafe.
EXPRESSCLUSTER X SingleServerSafe Legacy Feature Guide
This guide is intended for system engineers who want to introduce systems using EXPRESSCLUSTER X SingleServerSafe and describes EXPRESSCLUSTER X SingleServerSafe 4.0 WebManager and Builder.
1.5. Conventions
In this guide, Note, Important, See also are used as follows:
Note
Used when the information given is important, but not related to the data loss and damage to the system and machine.
Important
Used when the information given is necessary to avoid the data loss and damage to the system and machine.
See also
Used to describe the location of the information given at the reference destination.
The following conventions are used in this guide.
Convention |
Usage |
Example |
|---|---|---|
Bold |
Indicates graphical objects, such as fields, list boxes, menu selections, buttons, labels, icons, etc. |
In User Name, type your name.
On the File menu, click Open Database.
|
Angled bracket within the command line |
Indicates that the value specified inside of the angled bracket can be omitted. |
|
Monospace |
Indicates path names, commands, system output (message, prompt, etc), directory, file names, functions and parameters. |
|
bold |
Indicates the value that a user actually enters from a command line. |
Enter the following:
clpcl -s -a
|
italic |
Indicates that users should replace italicized part with values that they are actually working with. |
|
 In the figures of this guide, this icon represents EXPRESSCLUSTER X SingleServerSafe.
1.6. Contacting NEC
For the latest product information, visit our website below:
2. EXPRESSCLUSTER X SingleServerSafe command reference
This chapter describes the commands available with EXPRESSCLUSTER X SingleServerSafe.
EXPRESSCLUSTER X SingleServerSafe uses commands common to those of the clustering software EXPRESSCLUSTER X to ensure high compatibility with EXPRESSCLUSTER X in terms of operation and other aspects.
This chapter covers:
2.8. Applying and backing up configuration data (clpcfctrl command)
2.17. Requesting processing to cluster servers (clprexec command)
2.19. Estimating the amount of resource usage (clpprer command)
2.21. Setting an action for OS shutdown initiated by other than cluster service (clpstdncnf command)
2.22. Displaying the cluster statistics information (clpperfc command)
2.23. Checking the cluster configuration information (clpcfchk command)
2.1. Operating the cluster from the command line
EXPRESSCLUSTER X SingleServerSafe provides various commands for performing operations from the command prompt. These commands are useful in such cases as when you are setting up a cluster or cannot use the Cluster WebUI. You can perform a greater number of operations by using the command line than by using the Cluster WebUI.
Note
If the monitor resource detects an error when you have specified a group resource (such as an application resource) as a recovery target in the settings for error detection by a monitor resource, do not perform the following control operations for any service or group by using a command or the Cluster WebUI during recovery (reactivation -> final action).
Stopping or suspending a service
Starting or stopping a group
2.2. EXPRESSCLUSTER commands
Commands for construction
Command
Explanation
Refer to
clpcfctrl.exe
Applies the configuration data created by the Cluster WebUI to servers.Backs up the configuration data to be used by the Cluster WebUI.2.8. Applying and backing up configuration data (clpcfctrl command)
clplcnsc.exe
Manages the product or trial version license of this product.
clpcfchk.exe
Checks cluster configuration data.
2.23. Checking the cluster configuration information (clpcfchk command)
Commands for showing status
Command
Explanation
Refer to
clpstat.exe
Displays the status and configuration data of EXPRESSCLUSTER X SingleServerSafe.
clphealthchk.exe
Check the process health.
Commands for operation
Command
Explanation
Refer to
clpcl.exe
Starts, stops, suspends, or resumes the service.
clpstdn.exe
Stops the service and shuts down a server.
clpgrp.exe
Starts and stops groups.
clptoratio.exe
Extends or displays the timeout values.
clpmonctrl.exe
Suspends or resumes monitor resources.
clprsc.exe
Suspends or resumes group resources.
clpcpufreq.exe
Controls CPU frequency.
clprexec.exe
Requests a server to execute a process.
2.17. Requesting processing to cluster servers (clprexec command)
clpregctrl.exe
Controls the reboot count limitation.
Commands for logs
Command
Explanation
Refer to
clplogcc.exe
Collects logs and OS information.
clplogcf.exe
Changes and displays the log level and log output file size.
clpperfc.exe
Displays cluster statistical information on a group or a monitor resource.
2.22. Displaying the cluster statistics information (clpperfc command)
Commands for scripts
Command
Explanation
Refer to
clplogcmd.exe
Write this command in the script resource script to output messages to any destination.
Important
The installation directory contains executable files and script files that are not listed in this guide. Do not execute these files by using any program other than EXPRESSCLUSTER X SingleServerSafe. Any problems caused by not using EXPRESSCLUSTER will not be supported.
System monitor-related commands (when the System Resource Agent is used)
Command
Explanation
Refer to
clpprer.exe
Estimates the future value from the tendency of the given resource use amount data.
2.19. Estimating the amount of resource usage (clpprer command)
2.3. Displaying the status (clpstat command)
Displays the status and configuration data of EXPRESSCLUSTER X SingleServerSafe.
-
Command line - clpstat -s [--long]clpstat -gclpstat -mclpstat -i [--detail]clpstat --cl [--detail]clpstat --sv [--detail]clpstat --grp [<grpname>] [--detail]clpstat --rsc [<rscname>] [--detail]clpstat --mon [<monname>] [--detail]
-
Description Displays the status and configuration data of EXPRESSCLUSTER X SingleServerSafe.
-
Option -
-s
-
None¶ Displays the status.
-
--long¶ Displays a name of the cluster name and resource name until the end.
-
-g¶ Displays groups.
-
-m¶ Displays the status of each monitor resource.
-
-i¶ Displays the overall configuration data.
-
--cl¶ Displays the configuration data.
-
--sv¶ Displays the server configuration information.
-
--grp[<grpname>]¶ Displays server group configuration information. By specifying the name of a server group, you can display only the information on the specified server group.
-
--rsc[<rscname>]¶ Displays group resource configuration information. By specifying the name of a group resource, you can display only the information on the specified group resource.
-
--mon[<monname>]¶ Displays monitor resource configuration information. By specifying the name of a monitor resource, you can display only the information on the specified monitor resource.
-
--detail¶ Displays more detailed information on the setting.
-
-
Return Value 0
Success
251
Double Activation
Other than the above
Failure
-
Remarks According to the combination of options, configuration information shows information in various forms.
-
Notes - Run this command as a user with Administrator privileges .This command cannot be double launched.When you run the clpstat command with the -s option or without any option, names such as a cluster or a resource will not be displayed halfway .
-
Error Messages Message
Cause/Solution
Log in as administrator.
Log in as a user with Administrator privileges.
Invalid configuration file. Create valid cluster configuration data.
Create valid cluster configuration data by using the Cluster WebUI.
Invalid option.
Specify a valid option.
Could not connect to the server. Check if the cluster service is active
Check if the EXPRESSCLUSTER service is operating.
Invalid server status.
Check if the EXPRESSCLUSTER service is operating.
Server is not active. Check if the cluster service is active.
Check if the EXPRESSCLUSTER service is operating.
Invalid server name. Specify a valid server name in the cluster.
Specify the valid server name in the cluster.
Invalid heartbeat resource name. Specify a valid heartbeat resource name in the cluster.
Specify the valid heart beat resource name in the cluster.
Invalid network partition resource name. Specify a valid network partition resource name in the cluster.
Specify the valid network partition resolution resource name in the cluster.
Invalid group name. Specify a valid group name in the cluster.
Specify the valid name of a group in the cluster.
Invalid group resource name. Specify a valid group resource name in the cluster.
Specify the valid name of a group resource in the cluster.
Invalid monitor resource name. Specify a valid monitor resource name in the cluster.
Specify the valid name of a monitor resource in the cluster.
Connection was lost. Check if there is a server where the cluster service is stopped in the cluster.
Check if there is any server on which the EXPRESSCLUSTER service has stopped in the cluster.
Invalid parameter.
An invalid value may be specified to command argument.
Internal communication timeout has occurred in the cluster server. If it occurs frequently, set the longer timeout.A time-out occurred in the EXPRESSCLUSTER internal communication.If time-out keeps occurring, set the internal communication time-out longer.Internal error. Check if memory or OS resources are sufficient.
Check if the memory or OS resource is sufficient.
The cluster is not created.
Create and apply the cluster configuration data.
Could not connect to the server. Internal error. Check if memory or OS resources are sufficient.
Check to see if the memory or OS resource is sufficient.
Cluster is stopped. Check if the cluster daemon is active.
Check if the cluster daemon is started.
Cluster is suspended. To display the cluster status, use --local option.
Cluster is suspended. To display the cluster status, use --local option.
2.4. Operating the service (clpcl command)
Operates the EXPRESSCLUSTER service.
-
Command line - clpcl -sclpcl -t [-w <timeout>] [--apito <timeout>]clpcl -r [-w <timeout>] [--apito <timeout>]clpcl --return [--apito <timeout>]clpcl --suspend [--force] [-w <timeout>] [--apito <timeout>]clpcl --resume
-
Description This command starts, stops, restarts, suspends, or resumes the EXPRESSCLUSTER service.
-
Option -
-s¶ Starts the EXPRESSCLUSTER service.
-
-t¶ Stops the EXPRESSCLUSTER service.
-
-r¶ Restarts the EXPRESSCLUSTER service.
-
--return¶ Returns the EXPRESSCLUSTER service.
-
--suspend¶ Suspends the EXPRESSCLUSTER service.
-
--resume¶ Resumes the EXPRESSCLUSTER service.
-
-w<timeout>¶ - When --t, --r, or --suspend option is used, specify the wait time in seconds that the clpcl command waits for the EXPRESSCLUSTER service to be completely stopped or suspended.When timeout is not specified, it waits for unlimited time.When "0" is specified for timeout, the command does not wait at all.When the -w option is not specified (default), the command waits for twice the heartbeat timeout time (in seconds).
-
--force¶ When used with the --suspend option, this option forcefully suspends the service regardless of the server status.
-
--apitotimeout¶ - Specify the time in seconds to wait for the EXPRESSCLUSTER service to be stopped, restarted, or suspended (internal communication timeout). A value between 1 to 9999 can be specified.When the --apito option is not specified, the command waits according to the value set for the internal communication timeout in the cluster property.
-
-
Return Value 0
Success
Other than 0
Failure
-
Remarks - When this command is executed with the -s or --resume option specified, it returns control when processing starts on the target server.When this command is executed with the -t or --suspend option specified, it returns control after waiting for the processing to complete.When this command is executed with the -r option specified, it returns control when the EXPRESSCLUSTER daemon restarts on the target server after stopping once.Run the clpstat command to display the started or resumed status of the EXPRESSCLUSTER daemon.
-
Notes - This command must be executed by a user with the administrator privilege.This command cannot be executed while a group is being started or stopped.Before you suspend the EXPRESSCLUSTER service, the service must be running.Before you resume the EXPRESSCLUSTER service, use the clpstat command to make sure that the service is not running.
Suspend and Resume
When you want to update the configuration data or EXPRESSCLUSTER X SingleServerSafe, you can stop the EXPRESSCLUSTER service while continuing the operation. This status is called the suspended status. Returning from the suspended status to normal status is called "resume."The suspend and resume operations request processing of the server. The EXPRESSCLUSTER service must be active when you execute a suspend operation.The following functions stop when the cluster is suspended because the EXPRESSCLUSTER service stops while active resources stay active.All monitor resources stop.
You cannot perform operations on groups or group resources (start/stop).
The following commands are disabled:
clpcl options other than --resume
clpstdn
clpgrp
clptoratio
clpmonctrl
-
Error Messages Message
Cause/Solution
Log in as administrator.
Log in as a user with Administrator privileges.
Invalid configuration file. Create valid cluster configuration data.
Create valid cluster configuration data using the Cluster WebUI.
Invalid option.
Specify a valid option
Performed stop processing to the stopped cluster service.
The stopping process has been executed to the stopped EXPRESSCLUSTER service.
Performed startup processing to the active cluster service.
The startup process has been executed to the activated EXPRESSCLUSTER service.
Command timeout.
The command timed out.
Failed to return the server. Check the status of failed server.
Failed to return the server. Check the status of the failed server.
Could not connect to the server. Check if the cluster service is active.
Check if the EXPRESSCLUSTER service is activated.
Failed to obtain the list of nodes. Specify a valid server name in the cluster.
Specify the valid name of a server in the cluster.
Failed to obtain the service name.
Failed to obtain the service name.
Failed to operate the service.
Failed to operate the service.
Resumed the cluster service that is not suspended.
Resumed the EXPRESSCLUSTER service that is not suspended.
invalid server status.
Check if the EXPRESSCLUSTER service is activated.
Server is busy. Check if this command is already run.
This command may be run already. Check it.
Server is not active. Check if the cluster service is active.
Check if the EXPRESSCLUSTER service is activated.
There is one or more servers of which cluster service is active. If you want to perform resume, check if there is any server whose cluster service is active in the cluster.
When you execute the command to resume, check if there is no server in the cluster on which the EXPRESSCLUSTER service is activated.
All servers must be activated. When suspending the server, the cluster service need to be active on all servers in the cluster.
When you execute the command to suspend, the EXPRESSCLUSTER service must be activated in all servers in the cluster.
Resume the server because there is one or more suspended servers in the cluster.
Execute the command to resume because some server(s) in the cluster is suspended.
Invalid server name. Specify a valid server name in the cluster.
Specify the valid name of a server in the cluster.
Connection was lost. Check if there is a server where the cluster service is stopped in the cluster.
Check if there is any server on which the EXPRESSCLUSTER service has stopped in the cluster.
invalid parameter.
The value specified as a command parameter may be invalid.
Internal communication timeout has occurred in the cluster server. If it occurs frequently, set the longer timeout.
A timeout occurred in the EXPRESSCLUSTER internal communication.If time-out keeps occurring, set the internal communication time-out longer.Processing failed on some servers. Check the status of failed servers.
If stopping process is executed to all servers, there is one or more servers on which the stopping process has failed.Check the status of the server(s) on which the stopping process has failed.Internal error. Check if memory or OS resources are sufficient.
Check if the memory or OS resource is sufficient.
2.5. Shutting down the server (clpstdn command)
Shuts down the server.
-
Command line clpstdn [-r]
-
Description This command stops the EXPRESSCLUSTER service of the server and shuts down all servers.
-
Return Value 0
Success
Other than 0
Failure
-
Remarks This command returns control when the group stop processing is completed.
-
Notes - This command must be executed by a user with the administrator privilege.This command cannot be executed while a group is being started or stopped.
-
Error messages
2.6. Operating groups (clpgrp command)
Operates groups.
-
Command line - clpgrp -s [<grpname>] [--apito timeout]clpgrp -t [<grpname>] [--apito timeout]
-
Description Starts and stops groups.
-
Option -
-s[<grpname>]¶ When you specify the name of a group for grpnam, only the specified group starts up. If no group name is specified, all groups start up.
-
-t[<grpname>]¶ When you specify the name of a group for grpname, only the specified group stops. If no group name is specified, all groups stop.
-
--apitotimeout¶ - Specify the time in seconds to wait for groups to be started, stopped(internal communication timeout). A value between 1 to 9999 can be specified.When the --apito option is not specified, the command waits according to the value set for the internal communication timeout in the cluster property.
-
-
Return Value 0
Success
Other than 0
Failure
-
Notes - This command must be executed by a user with the administrator privilege.The EXPRESSCLUSTER service must be running.
-
Error messages Message
Cause/Solution
Log in as administrator.
Log in as a user with Administrator privileges.
Invalid configuration data. Create valid cluster configuration data.
Create valid cluster configuration data using the Cluster WebUI.
Invalid option.
Specify a valid option.
Could not connect to the server. Check if the cluster service is active.
Check if the EXPRESSCLUSTER service is operating.
Invalid server status. Check if the cluster service is active.
Check if the EXPRESSCLUSTER service is operating.
Server is not active. Check if the cluster service is active.
Check if the EXPRESSCLUSTER .service is operating.
Invalid server name. Specify a valid server name in the cluster.
Specify the valid server name in the cluster.
Connection was lost. Check if there is a server where the cluster service is stopped in the cluster.
Check if there is any server on which the EXPRESSCLUSTER service has stopped in the cluster.
Invalid parameter.
The value specified as a command parameter may be invalid.
Internal communication timeout has occurred in the cluster server. If it occurs frequently, set the longer timeout.
A time-out occurred in the EXPRESSCLUSTER internal communication.If time-out keeps occurring, set the internal communication time-out longer.Invalid server. Specify a server that can run and stop the group, or a server that can be a target when you move the group.
Server that starts and stops the group or to which the group is moved is invalid.Specify a valid server.Could not start the group. Try it again after the other server is started, or after the Wait Synchronization time is timed out.
Start up the group after waiting for the remote server to start up, or after waiting for the timeout of the start-up wait time.
No operable group exists in the server.
Check if there is any group that is operable in the server which requested the process.
The group has already been started on the local server.
Check the status of the group by using the Cluster WebUI or the clpstat command.
The group has already been started on the other server. To start/stop the group on the local server, use -f option.
Check the status of the group by using the Cluster WebUI or the clpstat command.If you want to start up or stop a group which was started in a remote server from the local server, move the group or run the command with the -f option.The group has already been stopped.
Check the status of the group by using the Cluster WebUI or the clpstat command.
Failed to start one or more resources. Check the status of group.
Check the status of group by using the Cluster WebUI or the clpstat command.
Failed to stop one or more resources. Check the status of group.
Check the status of group by using the Cluster WebUI or the clpstat command.
The group is busy. Try again later.
The group is now being started or stopped. Wait for a while and try again.
An error occurred on one or more groups. Check the status of group.
Check the status of the group by using the Cluster WebUI or the clpstat command.
Invalid group name. Specify a valid group name in the cluster.
Specify the valid name of a group in the cluster.
Server is isolated.
The server has been suspended. The server is rebooted after it went down.
Some invalid status. Check the status of cluster.
The status is invalid. Check the status of the cluster.
Log in as administrator.
Check if the memory or OS resource is sufficient.
Failed to migrate the group.
If the -l option is used, check whether the type of the specified group is "virtualmachine".
The specified group cannot be migrated.
Check the status of the group.
The specified group is not vm group.
Check if the type of the group is set to the virtual machine.
Migration resource does not exist.
Check if the virtual machine resource exists in the group.
Migration resource is not online.
Check if the virtual machine resource has already started.
Server is not in a condition to start group. Critical monitor error is detected.
Check the status of each server.
There is no appropriate destination for the group. Critical monitor error is detected.
Check the status of each server.
2.7. Collecting logs (clplogcc command)
Collects logs.
-
Command line clplogcc [-t collect_type] [-o path] [--local] [--evt event_type ...]
-
Description Collects logs and OS information.
-
Option -
None¶ Logs are collected.
-
-tcollect_type¶ Specifies a log collection pattern. When this option is omitted, a log collection pattern will be type 1.
-
-opath¶ Specifies the output destination of collector files. When this option is omitted, logs are output under tmp of the installation path.
-
--local¶ Collects logs on the local server without going through the data transfer server.
-
--evtevent_type¶ - Specifies the type of the event log to be collected.When this option is skipped, application logs, system logs and security logs will be collected.If you specify none, no event log is collected.This option is enabled only when [--local] option is specified.For details, see "2.7.3. Specifying a event log type to collect (--evt option)".
-
-
Return Value 0
Success
Other than 0
Failure
-
Remarks Because log files are compressed in the zip format, decompress them by using an appropriate application.
-
Notes Run this command as a user with Administrator privileges.
-
Execution Result For this command, the following processes are displayed:
Steps in Process
Explanation
Preparing
Initializing
Connecting
Connecting to the server
Compressing
Compressing log files
Transmitting
Sending log files
Disconnecting
Disconnecting from the server
Completion
Finished collecting logs
The following results (server status) are displayed:
Result (server status)
Explanation
Normal
Completed successfully
Canceled
Canceled by the user
Invalid Parameters
Parameters are invalid
Compression Error
There was an error while compressing files.
Communication Error
There was a communication error.
Timeout
Timeout occurred.
Busy
The server is busy.
No Free Space
No free space on the disk.
File I/O Error
There was a file I/O error.
Unknown Error
Failure caused by other errors
-
Error messages Message
Cause/Solution
Log in as administrator.
Log in as a user with Administrator privileges.
Invalid option.
Specify a valid option.
Collect type must be specified 'type1' or 'type2' or 'type3' or 'type4' or 'type5' or 'type6'. Incorrect collection type is specified.
Invalid collection type is specified.
Specifiable number of servers are the max number of servers that can constitute a cluster.
The number of servers you can specify is within the maximum number of servers for cluster configuration.
Failed to obtain properties.
Failed to obtain the properties.
Failed to obtain the list of nodes. Specify a valid server name in the cluster.
Specify the valid name of a server in the cluster.
Invalid server name. Specify a valid server name in the cluster.
Specify the invalid server name in the cluster.
Failed to collect log.
Failed to collect logs.
Server is busy. Check if this command is already run.
This command may be run already. Check it.
Internal error. Check if memory or OS resources are sufficient.
Check if the memory or OS resource is sufficient.
2.7.1. Collecting logs by specifying a type (-t option)
Type1 |
Type2 |
Type3 |
Type4 |
Type5 |
Type6 |
|
|---|---|---|---|---|---|---|
|
✓ |
✓ |
✓ |
n/a |
n/a |
n/a |
|
✓ |
✓ |
✓ |
✓ |
n/a |
n/a |
|
✓ |
✓ |
✓ |
✓ |
n/a |
n/a |
|
✓ |
✓ |
n/a |
n/a |
n/a |
n/a |
|
✓ |
✓ |
n/a |
n/a |
n/a |
n/a |
|
✓ |
✓ |
✓ |
n/a |
n/a |
n/a |
|
✓ |
✓ |
✓ |
n/a |
n/a |
n/a |
|
✓ |
✓ |
✓ |
n/a |
n/a |
n/a |
|
n/a |
✓ |
n/a |
n/a |
n/a |
n/a |
|
n/a |
n/a |
n/a |
n/a |
n/a |
n/a |
|
n/a |
n/a |
n/a |
n/a |
n/a |
✓ |
|
✓ |
✓ |
✓ |
n/a |
n/a |
✓ |
# clplogcc -t type2
When no option is specified, a log type will be type 1.
Information to be collected by default
Logs of each module in the EXPRESSCLUSTER Server
Attribute information on each module (dir) in the EXPRESSCLUSTER Server
In bin
In
alert\bin, Inwebmgr\bin%SystemRoot%\system32\driversEXPRESSCLUSTER X SingleServerSafe version information
OS information
Update log
License Information
Configuration file
Policy file
Shared memory dump
Local node status of EXPRESSCLUSTER (clpstat --local execution result)
Host name and domain name information (hostname execution result)
Network information (netstat execution result)
IP routing table information (route print execution result)
Process existing status (tasklist execution result)
ipconfig (ipconfig execution result)
Shared configuration of files (net share execution result)
Session information (net session execution result)
Windows firewall settings (netsh execution result)
SNP (Scalable Networking Pack) setting (netsh execution result)
Task schedule settings (schtasks execution result)
Event log
Application log (AppEvent.Evt, Application.evtx, Application.txt)
System log (SysEvent.Evt, System.evtx, System.txt)
Security log (SecEvent.Evt, Security.evtx, Security.txt)
Windows Error Report
***.wer
User dump
***.*dmp
Diagnostics report
The result of running msinfo32.exe
Registry
Registry information of the EXPRESSCLUSTER Server
HKLM\SOFTWARE\NEC\EXPRESSCLUSTER\Alert
HKLM\SOFTWARE\NEC\EXPRESSCLUSTER\MirrorList
HKLM\SOFTWARE\NEC\EXPRESSCLUSTER\RC
HKLM\SOFTWARE\NEC\EXPRESSCLUSTER\VCOMRegistry information of OS
HKLM\SYSTEM\CurrentControlSet\Services\Disk
HKLM\SYSTEM\CurrentControlSet\Control\Session Manager\DOS Devices
HKLM\SYSTEM\MountedDevices
HKLM\SYSTEM\CurrentControlSet\Enum\SCSI
HKLM\SYSTEM\CurrentControlSet\Enum\STORAGE
HKLM\SYSTEM\CurrentControlSet\Services\symc8xx
HKLM\SYSTEM\CurrentControlSet\Control\FileSystem
Scripts
Start/stop script for a group that was created with the Cluster WebUI.If you specify a user-defined script, it is not included in the log collection information. It must be collected separately.
ESMPRO/AC and ESMPRO/UPSC logs
Files collected by running the acupslog.exe command
HA logs
System resource information
JVM monitor log
System monitor log
Mirror Statistics
This version does no collect.
Cluster Statistics
Cluster Statistics
In perf\cluster
System statistics
System statistics
In
perf\system
2.7.2. Output paths of log files (-o option)
Log file is named and be saved as server_name-log.zip.
Because log files are compressed in the zip format, decompress them by using an appropriate application.
If not specifying -o option
Logs are output in tmp of installation path.
When the -o option is specified:
If you run the command as follows, logs are located in the specified
c:\tmpdirectory.# clplogcc -o C:\tmp
2.7.3. Specifying a event log type to collect (--evt option)
Event log type |
Character string to specify |
|---|---|
Application log |
app |
System log |
sys |
Security log |
sec |
No event log to be collected |
none |
Example) Collecting the system log and the security log
# clplogcc --local --evt sys sec
This option is enabled only when the [--local] option is specified.
2.7.4. Collecting information on emergency OS shutdown
Server information
Some module logs in EXPRESSCLUSTER servers
Information created by running a command
Host name and domain name information (hostname execution result)
Network information (netstat execution result)
Process existing status (tasklist execution result)
ipconfig (ipconfig execution result)
Shared configuration of files (net share execution result)
Session information (net session execution result)
These are collected by default in the log collection. You do not need to collect them separately.
2.8. Applying and backing up configuration data (clpcfctrl command)
2.8.1. Applying configuration data (clpcfctrl --push)
Applies the configuration data to servers.
-
Command line clpcfctrl --push [-w] [-x <path>] [-p <portnumber>] [--nocheck]
-
Description Applies the configuration data created by the Cluster WebUI to servers.
-
Option -
--push¶ - Specify this option when applying the data.This option cannot be omitted.
-
-x¶ Specify this option to apply the configuration data in the specified directory.
-
-w¶ - Indicates that SJIS encoding is used for the configuration data file.In general, it is not necessary to specify this option
-
-p¶ - Specifies the number of the port used to transfer data.When this option is omitted, the default value is used. In general, it is not necessary to specify this option.
-
--nocheck¶ Omits the check on the operation necessary to apply changes.
-
-
Return Value 0
Success
Other than 0
Failure
-
Notes - Run this command as a user with Administrator privileges.When the configuration data is applied, the current configuration data is compared with the configuration data to be applied.If there is any change in the configuration data, the following message output. After operating the service or group by following the instructions in the message, execute the command again.
Message
Solution
Please stop EXPRESSCLUSTER Server.
Stop the server.
Please suspend EXPRESSCLUSTER Server.
Suspend the server.
Please stop the following groups.
Stop the group for which the setting has been changed.
Reboot of a cluster is necessary to reflect setting.
Shut down and reboot the cluster to apply the change of settings.
To apply the changes you made, restart the EXPRESSCLUSTER Web Alert service.
Restart the Web Alert service to apply the change of settings.
To apply the changes you made, restart the EXPRESSCLUSTER Manager service.
Restart the EXPRESSCLUSTER Manager service to apply the change of settings.
Start of a cluster is necessary to reflect setting.
This is the message displayed at the initial cluster configuration. Start the cluster.
The --nocheck option is used only for special purposes including a maintenance procedure. Do not use the --nocheck option for normal operations.
-
Error messages Message
Cause/Solution
Log in as administrator.
Log in as a user with Administrator privileges.
This command is already run.
This command has already been run.
invalid option.
This option is invalid. Check the option.
Invalid mode. Check if --push or --pull option is specified.
Check if --push is specified.
Invalid host name. Server specified by -h option is not included in the configuration
The server specified with -h is not included in configuration data. Check if the specified server name or IP address is correct.
Failed to initialize the xml library. Check if memory or OS resources are sufficient.
Check if the memory or OS resources are sufficient.
Failed to load the configuration file. Check if memory or OS resources are sufficient.
Check if the memory or OS resources are sufficient.
Failed to change the configuration file. Check if memory or OS resources are sufficient.
Check if the memory or OS resources are sufficient.
Failed to load the all.pol file. Reinstall the RPM cluster.
Reinstall the EXPRESSCLUSTER Server.
Failed to load the cfctrl.pol file. Reinstall the RPM cluster.
Reinstall the EXPRESSCLUSTER Server.
Failed to get the install path. Reinstall the RPM cluster.
Reinstall the EXPRESSCLUSTER Server.
Failed to initialize the trncl library. Check if memory or OS resources are sufficient.
Check if the memory or OS resources are sufficient.
Failed to connect to trnsv. Check if the other server is active.
Accessing the server has failed. Check if the other server has been started up.
Failed to get the list of node. Check if the server name or ip addresses are correct.
Check if the server name and the IP address of the configuration information are correctly set.
File delivery failed. Failed to deliver the configuration data. Check if the other server is active and run the command again.
Delivering configuration data has failed. Check if other server(s) has been started.Run the command again after the server has started up.Multi file delivery failed. Failed to deliver the configuration data. Check if the other server is active and run the command again.
Delivering configuration data has failed. Check if other server(s) has been started.Run the command again after the server has started up.Failed to deliver the configuration data. Check if the other server is active and run the command again.
Delivering configuration data has failed. Check if other server(s) has been started.Run the command again after the server has started up.Failed to upload the configuration file. Check if the other server is active and run the command again.
Delivering configuration data has failed. Check if other server(s) has been started
Canceled to deliver the configuration file since it failed to connect to one or more server. If you want to deliver the configuration file to servers that can be connected, run the command again with "-force" option.
Canceled the delivery of the configuration data. There are some servers that failed to connect. If you want to deliver the configuration data only to the server that can be connected, run the command again by using the --force option.
The directory "work" is not found. Reinstall the RPM.
Reinstall the EXPRESSCLUSTER Server.
Failed to make a working directory.
Check if the memory or OS resources are sufficient.
The directory does not exist.
Check if the memory or OS resources are sufficient.
This is not a directory.
Check if the memory or OS resources are sufficient.
The source file does not exist.
Check if the memory or OS resources are sufficient.
The source file is a directory.
Check if the memory or OS resources are sufficient.
The source directory does not exist.
Check if the memory or OS resources are sufficient.
The source file is not a directory.
Check if the memory or OS resources are sufficient.
Failed to change the character code set (EUC to SJIS).
Check if the memory or OS resources are sufficient.
Failed to change the character code set (SJIS to EUC).
Check if the memory or OS resources are sufficient.
Failed to allocate memory.
Check if the memory or OS resources are sufficient.
Failed to change the directory.
Check if the memory or OS resources are sufficient.
Failed to make a directory.
Check if the memory or OS resources are sufficient.
Failed to remove the directory.
Check if the memory or OS resources are sufficient.
Failed to remove the file.
Check if the memory or OS resources are sufficient.
Failed to open the file.
Check if the memory or OS resources are sufficient.
Failed to read the file.
Check if the memory or OS resources are sufficient.
Failed to copy the file.
Check if the memory or OS resources are sufficient.
Failed to create the mutex.
Check if the memory or OS resources are sufficient.
Internal error. Check if memory or OS resources are sufficient.
Check if the memory or OS resources are sufficient.
Failed to check server property. Check if the server name or ip addresses are correct.
Check if the server name and the IP address of the configuration information are correctly set.
Please stop the following resources.
Stop the resource of which the configuration has been changed.
2.8.2. Backing up configuration data (clpcfctrl --pull)
Backs up the configuration data.
-
Command line clpcfctrl --pull [-w] [-x <path>] [-p <portnumber>]
-
Description Backs up the configuration data to be used by the Cluster WebUI.
-
Option -
--pull¶ - Specify this option when performing backup.This option cannot be omitted.
-
-x¶ Specify this option when backing up configuration data in the specified directory.
-
-w¶ Save the configuration data with character encoding, SJIS.
-
-p¶ - Specifies the number of the port used to transfer data.When this option is omitted, the default value is used. In general, it is not necessary to specify this option.
-
-
Return Value 0
Success
Other than 0
Failure
-
Notes Run this command as a user with Administrator privileges.
-
Error messages Message
Cause/Solution
Log in as administrator.
Log on as a user with Administrator privileges.
This command is already run.
This command has already been run.
invalid option.
The option is invalid. Check the option.
Invalid mode. Check if --push or --pull option is specified.
Check if --pull is specified.
Failed to initialize the xml library. Check if memory or OS resources are sufficient.
Check if the memory or OS resources are sufficient.
Failed to load the configuration file. Check if memory or OS resources are sufficient.
Check if the memory or OS resources are sufficient.
Failed to change the configuration file. Check if memory or OS resources are sufficient.
Check if the memory or OS resources are sufficient.
Failed to load the all.pol file. Reinstall the cluster.
Reinstall the EXPRESSCLUSTER Server.
Failed to load the cfctrl.pol file. Reinstall the cluster.
Reinstall the EXPRESSCLUSTER Server.
Failed to get the install path. Reinstall the cluster.
Reinstall the EXPRESSCLUSTER Server.
Failed to initialize the trncl library. Check if memory or OS resources are sufficient
Check if the memory or OS resources are sufficient.
Failed to connect to trnsv. Check if the other server is active.
Accessing the server has failed. Check if other server(s) has been started.
The directory "work" is not found. Reinstall the cluster.
Reinstall the EXPRESSCLUSTER Server.
Failed to make a working directory.
Check if the memory or OS resources are sufficient.
The directory does not exist.
Check if the memory or OS resources are sufficient.
This is not a directory.
Check if the memory or OS resources are sufficient.
The source file does not exist.
Check if the memory or OS resources are sufficient.
The source file is a directory.
Check if the memory or OS resources are sufficient.
The source directory does not exist.
Check if the memory or OS resources are sufficient.
The source file is not a directory.
Check if the memory or OS resources are sufficient.
Failed to change the character code set (EUC to SJIS).
Check if the memory or OS resources are sufficient.
Failed to change the character code set (SJIS to EUC).
Check if the memory or OS resources are sufficient.
Failed to allocate memory.
Check if the memory or OS resources are sufficient.
Failed to change the directory.
Check if the memory or OS resources are sufficient.
Failed to make a directory.
Check if the memory or OS resources are sufficient.
Failed to remove the directory.
Check if the memory or OS resources are sufficient.
Failed to remove the file.
Check if the memory or OS resources are sufficient.
Failed to open the file.
Check if the memory or OS resources are sufficient.
Failed to read he file.
Check if the memory or OS resources are sufficient.
Failed to write the file.
Check if the memory or OS resources are sufficient.
Failed to copy the file.
Check if the memory or OS resources are sufficient.
Failed to create the mutex.
Check if the memory or OS resources are sufficient.
Internal error. Check if memory or OS resources are sufficient.
Check if the memory or OS resources are sufficient.
2.9. Adjusting time-out temporarily (clptoratio command)
Extends or displays the current timeout ratio.
-
Command line - clptoratio -r <ratio> -t <time>clptoratio -iclptoratio -s
-
Description Temporarily extends the following timeout values:
Monitor resource
Alert synchronous service
WebManager service
The current timeout ratio is displayed.
-
Option -
-rratio¶ - Specifies the timeout ratio. Use 1 or larger integer. The maximum timeout ratio is 10,000.If you specify "1," you can restore the original ratio as when using the -i option.
-
-ttime¶ - Specifies the extension period.You can specify minutes for m, hours for h, and days for d. The maximum period of time is 30 days. Example:2m, 3h, 4d
-
-i¶ Sets back the modified timeout ratio.
-
-s¶ Refers to the current timeout ratio.
-
-
Return Value 0
Success
Other than 0
Failure
-
Remarks - When the server is shut down, the timeout ratio you specified becomes ineffective.With the -s option, you can only refer to the current timeout ratio. You cannot see other information such as remaining time of extended period.You can see the original timeout value by using the status display command.Monitor resource timeout
# clpstat --mon monitor_resource_name --detail
-
Notes - This command must be executed by a user with the administrator privilege.The EXPRESSCLUSTER service must be running when you execute this command.When you set the timeout ratio, make sure to specify the extension period. However, if you set "1" for the timeout ratio, you cannot specify the extension period.You cannot specify a combination such as "2m3h," for the extension period.
-
Examples Example 1: Doubling the timeout ratio for three days
# clptoratio -r 2 -t 3d
Example 2: Setting back the timeout ratio to original
# clptoratio -i
Example 3: Referring to the current timeout ratio
# clptoratio -s
present toratio : 2
The current timeout ratio is set to 2.
-
Error messages Message
Cause/Solution
Log in as administrator.
Log on as a user with Administrator privileges.
Invalid configuration file. Create valid cluster configuration data.
Create valid cluster configuration data by using the Cluster WebUI.
invalid option.
Specify a valid option.
Specify a number in a valid range.
Specify a number within a valid range.
Specify a correct number.
Specify a valid number.
Scale factor must be specified by integer value of 1 or more.
Specify 1 or larger integer for ratio.
Specify scale factor in a range less than the maximum scale factor.
Specify a ratio that is not larger than the maximum ratio.
Set the correct extension period.ex) 2m, 3h, 4dSet a valid extension period.Set the extension period in a range less than the maximum extension period.
Set the extension period which does not exceed the maximum extension period.
Could not connect to the server. Check if the cluster service is active.
Check that the EXPRESSCLUSTER service is operating.
Server is not active. Check if the cluster service is active.
Check that the EXPRESSCLUSTER service is operating.
Connection was lost. Check if there is a server where the cluster service is stopped in the cluster.
Check if there is any server in the cluster that the EXPRESSCLUSTER service stopped.
Invalid parameter.
The value specified as the command parameter may be invalid.
Internal communication timeout has occurred in the cluster server. If it occurs frequently, set the longer timeout.A time-out occurred in the EXPRESSCLUSTER internal communication.If time-out keeps occurring, set the internal communication time-out longer.Processing failed on some servers. Check the status of failed servers.
There is a server in which the processing has failed.Check the statuses of servers in the cluster. Run the command with all servers in the cluster activated.Internal error. Check if memory or OS resources are sufficient.
Check if the memory or OS resources are sufficient.
2.10. Modifying the log level and size (clplogcf command)
Modifies and displays log level and log output file size.
-
Command line clplogcf -t <type> -l <level> -s <size>
-
Description - Modifies the settings of the log level and log output file size.Displays the currently specified values.
-
Option -
-t¶ - Specifies a module type whose settings will be changed.If both -l and -s are omitted, the information set to the specified module will be displayed. See the list of "Types that can be specified to the -t option" for types which can be specified.
-
-l¶ - Specifies a log level.You can specify one of the following for a log level.1, 2, 4, 8, 16, 32You can see more detailed information as the log level increases.
-
-s¶ - Specifies the size of a file for log output.The unit is byte.
-
None¶ Displays the entire configuration information currently set.
-
-
Return Value 0
Success
Other than 0
Failure
-
Remarks Each type of log output by EXPRESSCLUSTER X SingleServerSafe uses two log files. Therefore, it is necessary to have twice the disk space specified by -s.
-
Notes - Run this command as a user with Administrator privileges.To run this command, the EXPRESSCLUSTER Event service must be started.Rebooting the server restores the settings to their pre-change values.
-
Examples Example 1: Modifying the pm log level
# clplogcf -t pm -l 8
Example 2: Seeing the pm log level and log file size
# clplogcf -t pm
TYPE, LEVEL, SIZE
pm, 8, 1000000
Example 3: Displaying the values currently configured
# clplogcf
TYPE, LEVEL, SIZE
trnsv, 4, 1000000
xml, 4, 1000000
logcf, 4, 1000000
-
Error messages Message
Cause/Solution
Log in as administrator.
Log on as a user with Administrator privileges.
invalid option.
The option is invalid. Check the option.
Failed to change configuration. Check if the event service is running.
clpevent may not have been started.
invalid level
The specified level is invalid.
invalid size
The specified size is invalid.
Failed to initialize the xml library. Check if memory or OS resources are sufficient.
Check if the memory or OS resources are sufficient.
Failed to print current configuration. Check if the event service is running.
clpevent may not be started yet.
-
Types that can be specified for the -t option (y=yes, n=no) Type
Module
Description
alert
clpaltinsert.exe
Alert
apicl
clpapicl.dll
API client library
apicl_rc
clpapicl.dll
API client library
apisv
clpapisv.dll
API server
appli
clpappli.dll
Application resource
appliw
clpappliw.dll
Application monitor resource
armdrive
armdrive.exe
Drive letter setting command
bwctrl
clpbwctrl.exe
Cluster activation synchronization wait processing control command
cfchk
clpcfchk.exe
Command to check the cluster configuration
cfctrl
clpcfctrl.exe
Cluster generation, cluster information and backup command
cl
clpcl.exe
Cluster startup and stop command
clpdnld
clpdnld.exe
Downloader
clpgetsvcstat
clptrnsv.exe
Transaction server
clpshmstat
clpshmstat.dll
Node status management library
clsv
clpclsv.dll
Client server
commcl
clpcommcl.dll
Common communication client library
cpufreq
clpcpufreq.exe
CPU frequency control command
diskperf
clpdiskperf.dll
Disk performance log library
diskutil
clpdiskutil.dll
Mirror disk/disk shared library
diskw
clpdiskw.dll
Disk RW monitor resource
down
clpdown.exe
Server shutdown command
event
clpevent.dll
Event log
exping
clpexpng.dll
PING execution management
genw
genw.dll
Custom monitor resource
grp
clpgrp.exe
Group startup, stop, move, and migration command
hblog
clplanhb.dll
Kernel-mode LAN heartbeat resource
healthchk
clphealthchk.exe
Process health check command
ibsv
clpibsv.exe
Information Base service
ipw
clpipw.dll
IP monitor resource
lankhb
clplanhb.dll
Kernel-mode LAN heartbeat resource
lcns
clplcns.dll
License library
ledctrl
clpledctrl.exe
Chassis identify control command
logc
clplogcc.exe
Log collection library
logcc
clplogcc.exe
Collect logs command
logcf
clplogcf.exe
Log level and size modification command
logcmd
clplogcmd.exe
Alert producing command
mail
clpmail.exe
Mail Notification
monctrl
clpmonctrl.exe
Monitor resource control command
mgmtagt
clpmgtmib.dll
Library for SNMP Service
miiw
clpmiiw.dll
NIC Link Up/Down monitor resource
monctrl
clpmonctrl.exe
Monitor resource control command
mrw
clpmrw.dll
Message receive monitor resource
mtw
clpmtw.dll
Multi target monitor resource
nm
clpnm.exe
Node map management
oldapi
clpoldapi.exe
Compatible API
oldapi_cnf
clpoldapi.exe
Compatible API
oldapi_evt
clpoldapi.exe
Compatible API
oldapi_if
clpoldapi.exe
Compatible API
oldapi_sts
clpoldapi.exe
Compatible API
perfc
clpperfc.exe
Command to display cluster statistical information
pm
clppm
Process management
pmsvc
clppmsvc.exe
Process management
psw
clppsw.dll
Process name monitor resource
ptun
clpptun.dll
Parameter tuning
ptunlib
clpptun.dll
Parameter tuning
rc
clprc.exe
Group and group resource management
rc_ex
clprc.exe
Group and group resource management
regctrl
clpregctrl.exe
Reboot count control command
resdllc
clpresdllc.dll
Resource control library
rm
clprm.dll
Monitor management
script
clpscript.dll
Script resource
scrpc
clpscrpc.exe
Script
scrpl
clpscrpl.ece
Script
sem
clpsem.dll
Semaphore library
service
clpservice.dll
Service resource
servicew
clpservicew.dll
Service monitor resource
shmcm
clpshmcm.dll
Shared memory library
shmevt
clpshmevt.dll
Event library
shmnm
clpshmnm.dll
Shared memory library
shmrm
clpshmrm.dll
Shared memory library
snmpmgr
clpsnmpmgr.dll
SNMP trap reception library
starup
clpstartup.exe
Startup
stat
clpstat.exe
Status display command
stdn
clpstdn.exe
Cluster shutdown command
toratio
clptoratio.exe
Time-out ratio modification command
trncl
clptrncl.dll
Transaction library
trap
claptrap.exe
SNMP trap command
trnreq
clptrnreq.exe
Inter-cluster processing request command
rexec
clprexec.exe
External monitoring link processing request command
trnsv
clptrnsv.exe
Transaction server
userw
clpuserw.dll
User space monitor resource
webalert
clpaltd.exe
Alert synchronization
webmgr
clpwebmc.exe
WebManager service
xml
xlpxml.dll
XML library
vm
clpvm.dll
VM resource
vmw
clpvmw.dll
VM monitor resource
vmctrl
clpvmctrl.dll
VMCtrl library
-
Monitoring Agent Types that can be specified for the -t option Type
Module
Description
db2w
clp_db2w.dll
DB2 Monitor (Database Agent)
ftpw
clp_ftpw.dll
FTP Monitor (Internet Server Agent)
httpw
clp_httpw.dll
HTTP Monitor (Internet Server Agent)
imap4w
clp_imap4w.dll
IMAP4 Monitor (Internet Server Agent)
jra
clpjrasvc.exe
JVM Monitor (Java Resource Agent)
jraw
clpjraw.dll
JVM Monitor (Java Resource Agent)
odbcw
clp_odbcw.dll
ODBC Monitor (Database Agent)
oraclew
clp_oraclew.dll
Oracle Monitor (Database Agent)
otxw
clp_otxw.dll
WebOTX Monitor (Application Server Agent)
pop3w
clp_pop3w.dll
POP3 Monitor (Internet Server Agent)
psqlw
clp_psqlw.dll
PostgreSQL Monitor (Database Agent)
smtpw
clp_smtpw.dll
SMTP Monitor (Internet Server Agent)
sqlserverw
clp_sqlserverw.dll
SQL Server Monitor (Database Agent)
sra
clpsraserviceproc.exe
System Monitor/Process resource monitor (System Resource Agent)
sraw
clpsraw.dll
System Monitor (System Resource Agent)
psrw
clppsrw.dll
Process resource monitor(System Resource Agent)
tuxw
clp_tuxw.dll
Tuxedo Monitor (Application Server Agent)
wasw
clp_wasw.dll
WebSphere Monitor (Application Server Agent)
wlsw
clp_wlsw.dll
WebLogic Monitor (Application Server Agent)
2.11. Managing licenses (clplcnsc command)
the clplcnsc command manages licenses.
-
Command line - clplcnsc -i [licensefile ...]clplcnsc -l [-a]clplcnsc -d serialno [-q]clplcnsc -d -t [-q]clplcnsc -d -a [-q]clplcnsc --reregister licensefile...
-
Description This command registers, refers to and remove the licenses of the product version and trial version of this product.
-
Option -
-i[licensefile ... ]¶ When a license file is specified, license information is acquired from the file for registration. You can specify multiple licenses. If nothing is specified, you need to enter license information interactively.
-
-l[-a]¶ - References the registered license.The name of displayed items are as follows.
Item
Explanation
Serial No
Serial number (product version only)
User name
User name (trial version only)
Key
License key
Licensed Number of CPU
The number of license (per CPU)
Licensed Number of Computers
The number of license (per node)
Start date
End date
Status
Status of the license
Status
Explanation
valid
valid
invalid
invalid
unknown
unknown
inactive
expired
- 1(1,2,3,4)
Displayed in the case of the fixed term license
- 2(1,2,3,4)
Displayed in the case of the license of trial version
When -a option not specifed, the license status of "invalid", "unknown" and "expired" are not displayed.When specifying -a option, all the licenses are displayed regardless of the license status.
-
-d<param>
<param>
- serialnoDeletes the license with the specified serial number.
- -tDeletes all the registered licenses of the trial version.
- -aDeletes all the registered licenses.
-
-q¶ Deletes licenses without displaying a warning message. This is used with -d option.
-
--reregisterlicensefile...¶ Reregisters a fixed-term license. Usually, it is unnecessary to execute the command with this option.
-
-
Return Value 0
Normal termination
1
Cancel
3
Initialization error
5
Invalid option
8
Other internal error
-
Example of a command entry for registration Registering the license interactively
# clplcnsc -i
Product Version/Product Version (Fixed Term)
Select a product division.
Selection of License Version
  1.  Product Version
  2.  Trial Version
  e. Exit
Select License Version. [1, 2, or e (default:1)] ...
Enter a serial number.
Enter serial number [ Ex. XXXXXXXX000000] ...
Enter a license key.
Enter license key [ Ex. XXXXXXXX-XXXXXXXX-XXXXXXXX-XXXXXXXX] ...
Trial Version
Select a product division.
Selection of License Version
  1.  Product Version
  2.  Trial Version
  e. Exit
Select License Version. [1, 2, or e (default:1)] ...
Enter a user name.
Enter user name [ 1 to 63byte ] .
Enter a license key.
Enter license key
[Ex. XXXXX-XXXXXXXX-XXXXXXXX-XXXXXXXX] ...
Specify a license file
# clplcnsc -i c:\tmp\licensefile
for referring to the license
# clplcnsc -l
Product version
< EXPRESSCLUSTER X SingleServerSafe <PRODUCT> >

Seq... 1
Key..... A1234567-B1234567-C1234567-D1234567
Licensed Number of CPU... 2
Status... valid

Seq... 2
Serial No..... AAAAAAAA000002
Key..... E1234567-F1234567-G1234567-H1234567
Licensed Number of Computers... 1
Status... valid
Product version (fixed term)
< EXPRESSCLUSTER X SingleServerSafe <PRODUCT> >

Seq... 1
Serial No..... AAAAAAAA000001
Key..... A1234567-B1234567-C1234567-D1234567
Start date..... 2018/01/01
End date...... 2018/01/31
Status........... valid

Seq... 2
Serial No..... AAAAAAAA000002
Key..... E1234567-F1234567-G1234567-H1234567
Status........... inactive
Trial version
< EXPRESSCLUSTER X SingleServerSafe <TRIAL> >
Seq... 1
Key..... A1234567-B1234567-C1234567-D1234567
User name... NEC
Start date..... 2018/01/01
End date...... 2018/02/28
Status........... valid
for deleting the license
# clplcnsc -d AAAAAAAA000001 -q
for deleting the license
# clplcnsc -d -t -q
for deleting the license
# clplcnsc -d -a
Deletion confirmation
Are you sure to remove the license? [y/n] ...
-
Notes - Run this command as the Administrator user.Furthermore, when you use -d option and -a option together, all the trial version licenses and product version licenses will be deleted. To delete only the trial license, also specify the -t option. If the licenses including the product license have been deleted, register the product license again.When you refer to a license which includes multiple licenses, all included licenses information are displayed.
-
Error messages Message
Cause/Solution
Processed license num(success : %d, error : %d).The number of processed licenses (success:%d, error:%d)If error is not 0, check if the license information is correct.Command succeeded.
The command ran successfully.
Command failed.
The command did not run successfully.
Log in as administrator.
Log on as the Administrator user.
Invalid cluster configuration data. Check the cluster configuration information.
The cluster configuration data is invalid. Check the cluster configuration data by using the Cluster WebUI.
Initialization error. Check if memory or OS resources are sufficient.
Check to see if the memory or OS resource is sufficient.
The command is already run.
The command is already running.
The license is not registered.
The license has not been registered yet.
Could not open the license file. Check if the license file exists on the specified path.
Input/Output cannot be done to the license file. Check to see if the license file exists in the specified path.
Could not read the license file. Check if the license file exists on the specified path.
Input/Output cannot be done to the license file. Check to see if the license file exists in the specified path.
The field format of the license file is invalid. The license file may be corrupted. Check the destination from where the file is sent.
The field format of the license file is invalid. The license file may be corrupted. Check it with the file sender.
The cluster configuration data may be invalid or not registered.
The cluster configuration data may be invalid or not registered. Check the configuration data.
Failed to terminate the library. Check if memory or OS resources are sufficient.
Check to see if the memory or OS resource is sufficient.
Failed to register the license. Check if the entered license information is correct.
Check to see if the entered license information is correct.
Failed to open the license. Check if the entered license information is correct.
Check to see if the entered license information is correct.
Failed to remove the license.
License deletion failed. Parameter error may have occurred or resources (memory or OS) may not be sufficient.
This license is already registered.
This license has already been registered.Check the registered license.This license is already activated.
This license has already been used.Check the registered license.This license is unavailable for this product.
This license cannot be used for this product.Check the license.The maximum number of licenses was reached.
The maximum number of registered licenses has been reached.Delete invalid licenses.Internal error. Check if memory or OS resources are sufficient.
Check to see if the memory or OS resource is sufficient.
2.12. Outputting messages (clplogcmd command)
Registers the specified message with Alert logs.
-
Command line clplogcmd -m message [--alert] [--mail] [-i ID] [-l level]
Note
It is not necessary to run this command during normal setup or operation. You need to write the command in the script resource script.
-
Description - Write this command in the script resource script to output messages to any destination.Messages are produced in the following format:
[ID] message
-
Option -
-mmessage¶ - Specifies a message. This option cannot be omitted. The maximum size of message is 498 bytes.You may use alphabets, numbers, and symbols 3 .
-
--alert
-
--mail¶ - Specify the output destination from alert and mail. (Multiple destinations can be specified.)This parameter can be omitted. The alert will be the output destinations when the parameter is omitted.For more information on output destinations, see "Directory structure of EXPRESSCLUSTER" in "The system maintenance information" in the "EXPRESSCLUSTER X Maintenance Guide".
-
-iID¶ - Specify message ID.This parameter can be omitted. The default value 1 is set for the ID when the parameter is omitted.
-
-llevel¶ - Level of alert to output.Select a level of alert output from ERR, WARN, or INFO. The icon on the alert logs of the Cluster WebUI is determined according to the level you select here.This parameter can be omitted. The default value INFO is set to level when the parameter is omitted.For details, see the online manual.
-
-
Return Value 0
Success
Other than 0
Failure
-
Notes This command must be executed by a user with the administrator privilege.
The specification of the -i option is different from that of the Linux version. In the Windows version, the event ID displayed in an alert cannot be changed.
-
Examples of command execution - Example 1: When specifying message, message ID, and level:When the following is written in the script resource script, the message is displayed in the Alert logs.
clplogcmd -m test1 -i 100 -l ERR
Example 2: When specifying message, output destination, event ID, and level (output destination is mail):When the following is written in the Script resource script, the message is sent to the mail address set in the Cluster Properties. For more information on the mail address settings, see "Alert Service tab" in "Cluster properties" in "Parameter details" in the "EXPRESSCLUSTER X Reference Guide".clplogcmd -m test2 --mail -i 100 -l ERR
The following information is sent to the mail destination:Message:test2 Type: logcmd ID: 100 Host: server1 Date: 2004/09/01 14:00:00
- 3
Notes on using symbols in the message:
The symbols below must be enclosed in double quotes (" ")
& | < >
(For example, if you specify "&" in the message, & is output.)The symbols below must have a backslash \ at the beginning
\
(For example, if you specify \\ in the message, \ is output.)When there is a space in the message, it must be placed in enclosed in double quotes (" ").
2.13. Controlling monitor resources (clpmonctrl command)
Controls the monitor resources.
-
Command line - clpmonctrl -s [-m resource name] [-w wait time]clpmonctrl -r [-m resource name] [-w wait time]clpmonctrl -c [-m resource name]clpmonctrl -v [-m resource name]clpmonctrl -e -m resource nameclpmonctrl -n [-m resource name]
-
Description Suspends or resumes monitor resources.
-
Option -
-s,--suspend¶ Suspends monitoring
-
-r,--resume¶ Resumes monitoring
-
-c,--clear¶ Initializes the recovery operation count.
-
-v,--view¶ Displays the recovery operation count.
-
-e,--error¶ Enables dummy failure.Be sure to specify a monitor resource name with the -m option.
-
-n,--normal¶ Disables dummy failure. When a monitor resource name is specified with the -m option, the function is disabled only for the resource. When the -m option is omitted, the function is disabled for all monitor resources.
-
-m,--monitor¶ - Specifies a monitor resource to be controlled.This option can be omitted. All monitor resources are controlled when the option is omitted.
-
-w,--wait¶ - Waits for control monitoring on a monitor resource basis. (in seconds)This option can be omitted. The default value 5 is set when the option is omitted.
-
-
Return Value 0
Completed successfully.
1
Privilege for execution is invalid.
2
The option is invalid.
3
Initialization error
4
The configuration data is invalid.
5
Monitor resource is not registered.
6
The specified monitor resource is invalid.
10
EXPRESSCLUSTER is not running.
11
The EXPRESSCLUSTER service is suspended
90
Monitoring control wait timeout
128
Duplicated activation
255
Other internal error
-
Remarks If you suspend an already suspended monitor resource or resume an already started one, this command abends without changing the status of the monitor resource.
-
Notes - Run this command as a user with the administrator privilege.Check the status of monitor resource by using the status display command or Cluster WebUI.Before you run this command, use the clpstat command or Cluster WebUI to verify that the status of monitor resources is in either "Online" or "Suspend."In the case of a monitor resource of which monitor timing is "Active", if a target resource stops temporarily in the active status, and then the target resource or the group which the target resource belongs to is activated, the monitor resource which has been stopped temporarily cannot detect an error. This is because the monitor resource does not start monitoring.The following are examples of the case described above:
Stops an application monitor that is monitoring application resource temporarily.
Reactivate the application resource or the group that the application resource belongs to.
This reactivation procedure applies both manual and automatic when a monitor resource detects an error and reactivates an application by the recovery operation.If you execute clpmonctrl command with the -v option, "FinalAction Count" is script execution count before final action for following setting.The Execute Script before Final Action check box is selected.
Final Action is No operation.
-
Error Messages Message
Causes/Solution
Command succeeded.
The command ran successfully.
You are not authorized to run the command. Log in as Administrator.
You are not authorized to run this command. Log in as a user with Administrator privileges.
Initialization error. Check if memory or OS resources are sufficient.
Check if the memory or OS resource is sufficient.
Invalid cluster configuration data. Check the cluster configuration information.
The cluster configuration data is invalid. Check the cluster configuration data by using the Cluster WebUI.
Monitor resource is not registered.
The monitor resource is not registered.
Specified monitor resource is not registered. Check the cluster configuration information.
The specified monitor resource is not registered.Check the cluster configuration data by using the Cluster WebUI.The cluster has been stopped. Check the active status of the cluster service by using the command such as ps command.
The cluster has been stopped.Check the activation status of the EXPRESSCLUSTER service by using the ps command.The cluster has been suspended. The cluster service has been suspended. Check activation status of the cluster service by using a command such as the ps command.
The EXPRESSCLUSTER service has been suspended. Check the activation status of the EXPRESSCLUSTER service by using a command such as ps command.
Waiting for synchronization of the cluster. The cluster is waiting for synchronization. Wait for a while and try again.
Synchronization of the cluster is awaited.Try again after synchronization of the cluster is completed.Monitor %1 was unregistered, ignored. The specified monitor resources %1is not registered, but continues processing. Check the cluster configuration data.
There is an unregistered monitor resource in the specified monitor resources, but it is ignored and the process is continuedCheck the cluster configuration data by using the Cluster WebUI.%1: Monitor resource nameThe command is already executed. Check the execution state by using the "ps" command or some other command.
The command has already been run. Check the status by using the ps command.
Internal error. Check if memory or OS resources are sufficient.
Check if the memory or OS resource is sufficient.
Monitor resource types that can be specified for the -m option
Type
Suspending/Resume
Reset Recovery Count
Dummy Failure Possibility
appliw
✓
✓
✓
diskw
✓
✓
✓
ipw
✓
✓
✓
miiw
✓
✓
✓
mtw
✓
✓
✓
servicew
✓
✓
✓
genw
✓
✓
✓
vmw
✓
✓
n/a
mrw
✓
✓
n/a
db2w
✓
✓
✓
ftpw
✓
✓
✓
httpw
✓
✓
✓
imap4w
✓
✓
✓
odbcw
✓
✓
✓
oraclew
✓
✓
✓
pop3w
✓
✓
✓
psqlw
✓
✓
✓
smtpw
✓
✓
✓
sqlserverw
✓
✓
✓
tuxw
✓
✓
✓
wasw
✓
✓
✓
wlsw
✓
✓
✓
otxw
✓
✓
✓
jraw
✓
✓
✓
sraw
✓
✓
✓
psrw
✓
✓
✓
userw
✓
✓
✓
psw
✓
✓
✓
2.14. Controlling group resources (clprsc command)
Controls group resources
-
Command line - clprsc -s resource_name [-f] [--apito timeout]clprsc -t resource_name [-f] [--apito timeout]
-
Description This command starts and stops group resources.
-
Option -
-s¶ Starts group resources.
-
-t¶ Stops group resources.
-
-f¶ - When the group resource is running, all group resources that the specified group resource depends start up.When the group resource is not running, all group resources that the specified group resource depends stop.
-
--apitotimeout¶ - Specify the time in seconds to wait for group resources to be started or stopped (internal communication timeout). A value between 1 to 9999 can be specified.When the --apito option is not specified, the command waits according to the value set for the internal communication timeout in the cluster property.
-
-
Return Value 0
Completed successfully.
Other than 0
Terminated due to a failure.
-
Notes - This command must be executed by a user with the administrator privilege.Check the status of the group resources by using the status display command or the Cluster WebUI.
-
Error Messages Message
Causes/Solution
Log in as Administrator.
Run this command as a user with Administrator privileges.
Invalid cluster configuration data. Check the cluster configurationinformation.The cluster construction information is not correct. Check the cluster construction information by Cluster WebUI.
Invalid option.
Specify a correct option.
Could not connect server. Check if the cluster service is active.
Check if the EXPRESSCLUSTER is activated.
Invalid server status. Check if the cluster service is active.
Check if the EXPRESSCLUSTER is activated.
Server is not active. Check if the cluster service is active.
Check if the EXPRESSCLUSTER is activated.
Invalid server name. Specify a valid server name in the cluster.
Specify a correct server name in the cluster.
Connection was lost. Check if there is a server where the cluster service is stopped in the cluster.
Check if there is any server with EXPRESSCLUSTER service stopped in the cluster.
Internal communication timeout has occurred in the cluster server. If it occurs frequently, set the longer timeout.
Timeout has occurred in internal communication in the EXPRESSCLUSTER.Set the internal communication timeout longer if this error occurs frequently.The group resource is busy. Try again later.
Because the group resource is in the process of starting or stopping, wait for a while and try again.
An error occurred on group resource. Check the status of group resource.
Check the group resource status by using the luster WebUI or the clpstat command.
Could not start the group resource. Try it again after the other server is started, or after the Wait Synchronization time is timed out.
Wait till the other server starts or the wait time times out, then start the group resources.
No operable group resource exists in the server.
Check there is a processable group resource on the specified server.
The group resource has already been started on the local server.
Check the group resource status by using the Cluster WebUI or clpstat command.
The group resource has already been started on the other server. To start the group resource on the local server, stop the group resource.
Check the group resource status by using the Cluster WebUI or clpstat command.
Stop the group to start the group resources on the local server.
The group resource has already been stopped.
Check the group resource status by using the Cluster WebUI or clpstat command.
Failed to start group resource. Check the status of group resource.
Check the group resource status by using the Cluster WebUI or clpstat command.
Failed to stop resource. Check the status of group resource.
Check the group resource status by using the Cluster WebUI or clpstat command.
Depending resource is not offline. Check the status of resource.
Because the status of the depended group resource is not offline, the group resource cannot be stopped. Stop the depended group resource or specify the -f option.
Depending resource is not online. Check the status of resource.
Because the status of the depended group is not online, the group resource cannot be started. Start the depended group resource or specify the -f option.
Invalid group resource name. Specify a valid group resource name in the cluster.
The group resource is not registered.
Server is isolated.
The server is suspended. (Rebooting after down)
Internal error. Check if memory or OS resources are sufficient.
Not enough memory space or OS resource. Check if there is enough space.
Server is not in a condition to start resource. Critical monitor error is detected.
Check the status of the server.
2.15. Controlling CPU frequency (clpcpufreq command)
Controls CPU frequency.
-
Command line - clpcpufreq --highclpcpufreq --lowclpcpufreq -iclpcpufreq -s
-
Description This command enables or disables power-saving mode by CPU frequency control.
-
Option -
--high¶ Sets the highest CPU frequency.
-
--low¶ Sets the lowest CPU frequency to switch to the power-saving mode.
-
-i¶ Passes the CPU frequency control to EXPRESSCLUSTER X SingleServerSafe.
-
-s¶ Displays the current CPU frequency level.
high The CPU frequency is at its highest.
low The CPU frequency has been decreased because the CPU is in the power-saving mode.
-
-
Return Value 0
Completed successfully.
Other than 0
Terminated due to a failure.
-
Remarks If the Use CPU Frequency Control check box is not selected in the Extension tab settings in Cluster Properties, this command results in an error.
-
Notes - This command must be executed by a user with the administrator privilege.When you use CPU frequency control, it is required that frequency is changeable in the BIOS settings, and that the CPU supports frequency control by Windows OS power management function.
-
Error Messages Message
Cause/Solution
Log in as Administrator.
Log in as a user with Administrator privileges.
This command is already run.
This command has already been run.
Invalid option.
This option is invalid. Check the option.
Invalid mode.Check if --high or --low or -i or -s option is specified.Check if either of the --high, --low, -I or -s option is specified.Failed to initialize the xml library.Check if memory or OS resources are sufficient.Check to see if the memory or OS resource is sufficient.Failed to change CPU frequency settings.Check the BIOS settings and the OS settings.Check if the cluster is started.Check if the setting is configured so that CPU frequency control is used.Failed to acquire CPU frequency settings.Check the BIOS settings and the OS settings.Check if the cluster is started.Check if the setting is configured so that CPU frequency control is used.Failed to create the mutex.
Check if the memory or OS resource is sufficient.
Internal error. Check if memory or OS resources are sufficient.
Check if the memory or OS resource is sufficient.
2.16. Processing inter-cluster linkage (clptrnreq command)
The clptrnreq command requests a server to execute a process.
-
Command line clptrnreq -t request_code -h IP [-r resource_name] [-s script_file] [-w timeout]
-
Description The command issues the request to execute specified process to the server in another cluster.
-
Option -
-trequest_code¶ - Specifies the request code of the process to be executed. The following request codes can be specified:GRP_FAILOVER Group failoverEXEC_SCRIPT Execute script
-
-hIP¶ - Specifies the server to issue the request to execute the process with IP address. You can specify more than one server by separating by commas. The maximum number of IP addresses you can specify is 32.When you specify group failover for request code, specify the IP addresses of all the servers in the cluster.
-
-rresource_name¶ - Specifies the resource name which belongs to the target group for the request for process when GRP_FAILOVER is specified for request code.If GRP_FAILOVER is specified, -r cannot be omitted.
-
-sscript_file¶ - Specifies the file name (within 30 characters) of the script to be executed (e.g. batch file or executable file) when EXEC_SCRIPT is specified for request code. The script needs to be created in the worktrnreq folder in the folder where EXPRESSCLUSTER is installed in each server specified with -h.If EXEC_SCRIPT is specified, -s cannot be omitted.
-
-wtimeout¶ - Specifies the timeout value of the command by the second. The minimum value is 5 seconds.If the -w option is not specified, it waits for 30 seconds.
-
-
Return Value 0
Completed successfully.
Other than 0
Terminated due to a failure.
-
Notes - This command must be executed by a user with the administrator privilege.It is required that EXPRESSCLUSTER for Windows of internal version 10.02 or later, or EXPRESSCLUSTER for Linux of internal version 2.0.2_1 or later is set up in the server which executes this command and the server with the IP address specified by -h.
-
Examples Example 1: When performing a failover on the group having the appli1 resource of another cluster
# clptrnreq -t GRP_FAILOVER -h 10.0.0.1,10.0.0.2 -r appli1
GRP_FAILOVER 10.0.0.1: Success
GRP_FAILOVER 10.0.0.2: Success
Example 2: When executing the scrpit1.bat script by the server with IP address 10.0.0.1
# clptrnreq -t EXEC_SCRIPT -h 10.0.0.1 -s script1.bat
EXEC_SCRIPT 10.0.0.1: Success
-
Error messages Message
Cause/solution
Log in as Administrator.
Log in as a user with Administrator privileges.
Invalid option.
The command line option is invalid. Specify the correct option.
All servers are busy. Check if this command is already run.
This command may be run already. Check it.
Internal error. Check if memory or OS resources are sufficient.
Check if the memory or OS resource is sufficient.
Command timeout
The cause may be heavy load on OS and so on. Check this.
Failed to obtain the list of nodes.Specify a valid server name in the cluster.Failed to obtain the list of nodes.Specify a valid IP address.Could not connect to all data transfer server. Check if the server has started up.
Could not connect to all IP addresses specified. Check the IP addresses and the status of the target server.
Could not connect to the data transfer server. Check if the server has started up.
Could not connect to the IP address specified. Check the IP address and the status of the target server.
GRP_FAILOVER IP: Group that specified resource (resource_name) belongs to is offline.
Failover process is not performed because the group to which the specified resource belongs is not started on the target server.
EXEC_SCRIPT IP: Specified script ( script_file ) does not exist.
The script does not exist on the specified server.Check it.EXEC_SCRIPT IP: Specified script (script_file) is not executable.
The specified script could not be executed.
Check that execution is permitted.
request_code IP : This server is not permitted to execute clptrnreq.
The server that executed the command does not have permission. Check that the server is registered to the connection restriction IP list of Cluster WebUI.
request_code IP : REQEST_TYPE failed in execute.
The execution processing of the request type failed.(Either of a present request type Failover or Script is specified. )
2.17. Requesting processing to cluster servers (clprexec command)
Issues a processing execution request to another server on which EXPRESSCLUSTER is installed.
-
Command line - clprexec --script script_file -h IP [-p port_number] [-w timeout] [-o logfile_path]clprexec --notice [mrw_name] -h IP [-k category[.keyword]] [-p port_number] [-w timeout] [-o logfile_path]clprexec --clear [mrw_name] -h IP [-k category[.keyword]] [-p port_number] [-w timeout] [-o logfile_path]
-
Description This command is an expansion of the existing clptrnreq command and has additional functions such as issuing a processing request (error message) from the external monitor to the EXPRESSCLUSTER server.
-
Option -
--scriptscript_name¶ - Requests script execution.For script_name, specify the file name of the script to execute (such as a shell script or executable file).The script must be created in the work/trnreq folder, which is in the folder where EXPRESSCLUSTER is installed, on each server specified using -h.
-
--notice¶ - Sends an error message to the EXPRESSCLUSTER server.Specify a message reception monitor resource name for mrw_name.When not specifying the monitor resource name, specify the monitor type and monitor target of the message reception monitor resource by using the -k option.
-
--clear¶ - Requests changing the status of the message reception monitor resource from "Abnormal" to "Normal."Specify a message reception monitor resource name for mrw_name.When not specifying the monitor resource name, specify the monitor type and monitor target of the message reception monitor resource by using the -k option.
-
-hIP Address¶ - Specify the IP addresses of EXPRESSCLUSTER servers that receive the processing request.Up to 32 IP addresses can be specified by separating them with commas.* If this option is omitted, the processing request is issued to the local server.
-
-kcategory[.keyword]¶ - For category, specify the category specified for the message receive monitor when the --notice or --clear option is specified.To specify the keyword of the message receive monitor resource, specify them by separating them with period after category.
-
-pport_number¶ - Specify the port number.For port_number, specify the data transfer port number specified for the server that receives the processing request.The default value, 29002, is used if this option is omitted.
-
-ologfile_path¶ - For logfile_path, specify the file path along which the detailed log of this command is output.The file contains the log of one command execution.* If this option is not specified on a server where EXPRESSCLUSTER is not installed, the log is always output to the standard output.
-
-wtimeout¶ - Specify the command timeout time. The default, 180 seconds, is used if this option is not specified.A value from 5 to 999 can be specified.
-
-
Return Value 0
Completed successfully.
Other than 0
Terminated due to a failure.
-
Notes - When issuing error messages by using the clprexec command, the message reception monitor resources for which executing an action when an error occurs is specified in EXPRESSCLUSTER server must be registered and started.The server that has the IP address specified for the -h option must satisfy the following conditions:= EXPRESSCLUSTER X3.0 or later must be installed.= EXPRESSCLUSTER must be running.(When an option other than --script is used)= mrw must be set up and running.(When the --notice or --clear option is used)
When using the Limiting the access by using client IP addresses function, add the IP address of the device in which the clprexec command is executed to the IP Addresses of the Accessible Clients list.
For details of the Limiting the access by using client IP addresses function, see "WebManager tab" of "Cluster properties" in "Other setting details" in the EXPRESSCLUSTER X SingleServerSafe Configuration Guide.
-
Examples Example 1: This example shows how to issue a request to execute the script (script1.bat) on EXPRESSCLUSTER server 1 (10.0.0.1):
# clprexec --script script1.bat -h 10.0.0.1
Example 2: This example shows how to issue an error message to EXPRESSCLUSTER server 1 (10.0.0.1):* mrw1 set, category: earthquake, keyword: scale3This example shows how to specify a message reception monitor resource name:
# clprexec --notice mrw1 -h 10.0.0.1 -w 30 -p /tmp/clprexec/clprexec.log
This example shows how to specify the category and keyword specified for the message reception monitor resource:
# clprexec --notice -h 10.0.0.1 -k earthquake,scale3 -w 30 -p /tmp/clprexec/clprexec.log
Example 3: This example shows how to issue a request to change the monitor status of mrw1 to EXPRESSCLUSTER server 1 (10.0.0.1):* mrw1 set, category: earthquake, keyword: scale3This example shows how to specify a message reception monitor resource name:
# clprexec --clear mrw1 -h 10.0.0.1
This example shows how to specify the category and keyword specified for the message reception monitor resource:
# clprexec --clear -h 10.0.0.1 -k earthquake,scale3
-
Error Messages Message
Cause/solution
Success
-
Invalid option.
Check the command argument.
Could not connect to the data transfer servers. Check if the servers have started up.
Check whether the specified IP address is correct and whether the server that has the IP address is running.
Could not connect to all data transfer server.
Check whether the specified IP address is correct and whether the server that has the IP address is running.
Command timeout.
Check whether the processing is complete on the server that has the specified IP address.
All servers are busy. Check if this command is already run.
This command might already be running.
Group(%s) is offline.
Check the processing result on the server that received the request.
Group that specified resource(%s) belongs to is offline.
Check the group status.
Specified script(%s) does not exist.
Check if the specified script exist.
Specified resource(%s) is not exist.
Check the resource name or monitor resource name.
Specified resource(Category:%s, Keyword:%s) is not exist.
Check the resource name or monitor resource name.
Specified group(%s) does not exist.
Check the group name.
This server is not permitted to execute clprexec.
Check whether the IP address of the server that executes the command is registered in the list of client IP addresses that are not allowed to connect to the Cluster WebUI.
%s failed in execute.
Check the status of the EXPRESSCLUSTER server that received the request.
2.18. Controlling reboot count (clpregctrl command)
Controls reboot count limitation.
-
Command line - clpregctrl --getclpregctrl -gclpregctrl --clear -t type -r registryclpregctrl -c -t type -r registry
-
Description Displays or initializes the reboot count on a server.
-
Option -
-g,--get¶ Displays reboot count information.
-
-c,--clear¶ Initializes reboot count.
-
-ttype¶ Specifies the type to initialize the reboot count. The type that can be specified is rc or rm
-
-rregistry¶ Specifies the registry name. The registry name that can be specified is haltcount.
-
-
Return Value 0
Completed successfully.
1
Privilege for execution is invalid.
2
Duplicated activation
3
The option is invalid.
4
The configuration data is invalid.
10 to 17
Internal error
20 to 22
Obtaining reboot count information has failed.
90
Allocating memory has failed.
-
Notes This command must be executed by a user with the administrator privilege.
-
Examples Display of reboot count information
# clpregctrl -g
******************************
-------------------------
type : rc
registry : haltcount
comment : halt count
kind : int
value : 0
default : 0
-------------------------
type : rm
registry : haltcount
comment : halt count
kind : int
value : 3
default : 0
******************************
success.(code:0)

#
The reboot count is initialized in the following examples.
Example 1: When initializing the count of reboots caused by a group resource error:
# clpregctrl -c -t rc -r haltcount
success.(code:0)
#
Example 2: When initializing the count of reboots caused by a monitor resource error:
# clpregctrl -c -t rm -r haltcount
success.(code:0)
#
-
Error Messages Message
Cause/solution
Command succeeded.
The command ran successfully.
Log in as Administrator.
You are not authorized to run this command. Run this command as a user with Administrator privileges.
The command is already executed.
The command is already running.
Invalid option.
Specify a valid option.
Internal error. Check if memory or OS resources are sufficient.
Not enough memory space or OS resource.
2.19. Estimating the amount of resource usage (clpprer command)
Estimates the future value from changes in the resource usage amount written to the input file and outputs the result to a file. It can also be used to check the result of threshold judgment for estimated data.
-
Command line clpprer -i <inputfile> -o <outputfile> [-p <number>] [-t <number> [-l]]
-
Description Estimates the future value from the tendency of the given resource use amount data.
-
Option -
-i<inputfile>¶ The clpprer command specifies the resource data for which a future value is to be obtained.
-
-o<outputfile>¶ Specifies the name of the file to which the estimate result is output.
-
-p<number>¶ Specifies the number of estimate data items. If omitted, 30 items of estimate data are obtained.
-
-t<number>¶ Specifies the threshold to be compared with the estimate data.
-
-l¶ Valid only when the threshold is set with the -t option.Judges the status to be an error when the data value is less than the threshold.
-
-
Return Value 0
Normal end without threshold judgment
1
Error occurrence
2
As a result of threshold judgment, the input data is determined to have exceeded the threshold.
3
As a result of threshold judgment, the estimate data is determined to have exceeded the threshold.
4
As a result of threshold judgment, the data is determined to have not exceeded the threshold.
5
If the number of data items to be analyzed is less than the recommended number of data items to be analyzed (120), the input data is determined to have exceeded the threshold as a result of threshold judgment.
6
If the number of data items to be analyzed is less than the recommended number of data items to be analyzed (120), the estimate data is determined to have exceeded the threshold as a result of threshold judgment.
7
If the number of data items to be analyzed is less than the recommended number of data items to be analyzed (120), the data is determined to have not exceeded the threshold as a result of threshold judgment.
-
Notes - This command can be used only when the license for the system monitor resource (System Resource Agent) is registered. (If the license is registered, you do not need to configure system monitor resources for the cluster configuration.)The maximum number of input data items of the resource data file specified with the -i option is 500. A certain number of input data items are required to estimate the amount of resource usage. However, if the number of input data items is large, it takes a considerable amount of time to perform the analysis. So, it is recommended that the number of input data items be restricted to about 120. Moreover, the maximum number of output data items that can be specified in option -p is 500.If the time data for the input file is not arranged in ascending order, the estimate will not be appropriate. In the input file, therefore, set the time data arranged in ascending order.
-
Input file The input file format is explained below. You need to have an input file, written in the following format, for the resource usage amount for which you want to estimate a result.
The input file format is CSV. One piece of data is coded in the form of date and time, numeric value.Moreover, the data and time format is YYYY/MM/DD hh:mm:ss.File example
2012/06/14 10:00:00,10.0
2012/06/14 10:01:00,10.5
2012/06/14 10:02:00,11.0
-
Examples The estimation of the future value is explained using a simple example.
When an error is detected in the input data:
If the latest value of the input data exceeds the threshold, an error is assumed and a return value of 2 is returned. If the number of input data items is less than the recommended value (=120), a return value of 5 is returned.
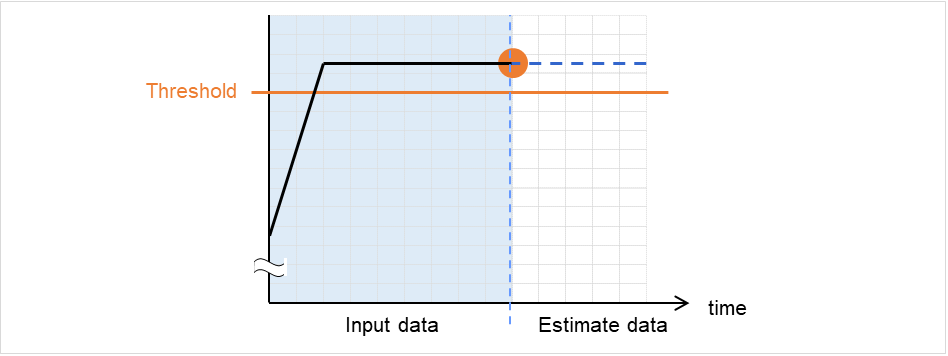
Fig. 2.1 Error detection in the input data
When an error is detected in the estimate data:
If the estimate data exceeds the threshold, an error is assumed and a return value of 3 is returned. If the number of input data items is less than the recommended value (=120), a return value of 6 is returned.
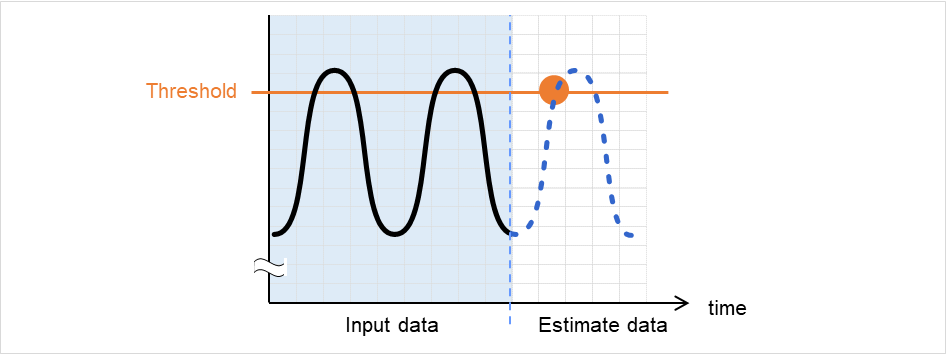
Fig. 2.2 Error detection in the estimate data
When no threshold error is detected:
If neither the input data nor the estimate data exceeds the threshold, a return value of 4 is returned. If the number of input data items is less than the recommended value (=120), a return value of 7 is returned.
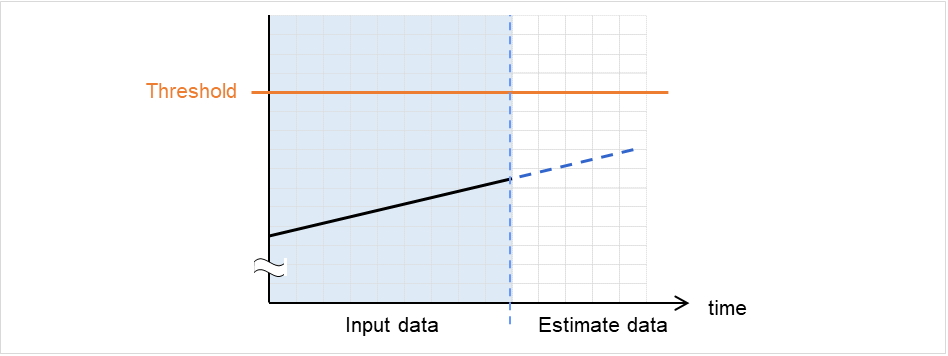
Fig. 2.3 When no threshold error is detected
When the -l option is used:
If the -l option is used, an error is assumed when the data is less than the threshold.
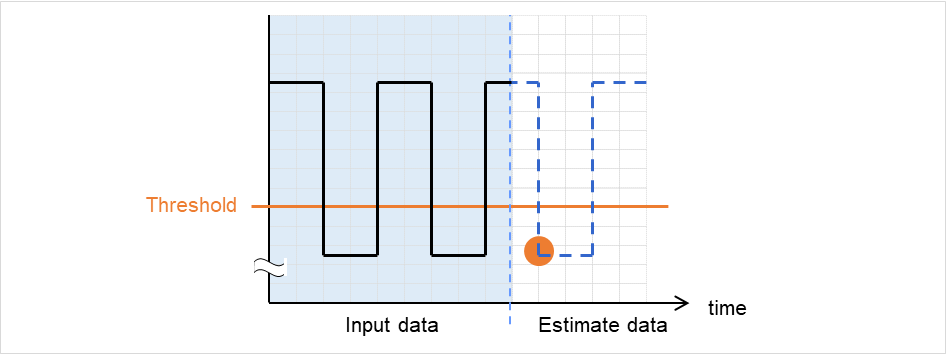
Fig. 2.4 Use of the -l option
-
Examples If you use a file written in the specified format and run the clpprer command, you can output the estimate result to a file and check it.
Input file test.csv
2012/06/14 10:00:00,10.0
2012/06/14 10:01:00,10.5
2012/06/14 10:02:00,11.0
# clpprer -i test.csv -o result.csv
Output result result.csv
2012/06/14 10:03:00,11.5
2012/06/14 10:04:00,12.0
2012/06/14 10:05:00,12.5
2012/06/14 10:06:00,13.0
2012/06/14 10:07:00,13.5
    :
If you set a threshold for option, you can check the result of threshold judgment for estimate data at the command prompt.
# clpprer -i test.csv -o result.csv -t 12.5
Execution result
Detect over threshold. datetime = 2012/06/14 10:06:00, data = 13.00, threshold = 12.5
-
Error Messages Message
Causes/Solution
Normal state.
As a result of threshold judgment, no data exceeding the threshold is detected.
Detect over threshold. datetime = %s, data = %s, threshold = %s
As a result of threshold judgment, data exceeding the threshold is detected.
Detect under threshold. datetime = %s, data = %s, threshold = %s
As a result of threshold judgment with the -l option, data less than the threshold is detected.
License is nothing.
The license for the valid System Resource Agent is not registered. Check to see the license.
Inputfile is none.
The specified input data file does not exist.
Inputfile length error.
The path for the specified input data file is too long. Specify no more than 1023 bytes.
Output directory does not exist.
The directory specified with the output file does not exist. Check whether the specified directory exists.
Outputfile length error.
The path for the specified output file is too long. Specify no more than 1023 bytes.
Invalid number of -p.
The value specified in the -p option is invalid.
Invalid number of -t.
The value specified in the -t option is invalid.
Not analyze under threshold(not set -t) .
The -t option is not specified. When using the -I option, also specify the -t option.
File open error [%s]. errno = %s
The file failed to open. The amount of memory or OS resources may be insufficient. Check for any insufficiency.
Inputfile is invalid. cols = %s
The number of input data items is not correct. Set the number of input data items to 2 or more.
Inputfile is invalid. rows = %s
The input data format is incorrect. One line needs to be divided into two rows.
Invalid date format. [expected YYYY/MM/DD HH:MM:SS]
The date of the input data is not of the correct format. Check to see the data.
Invalid date format. Not sorted in ascending order.
Input data is not arranged in ascending order of date and time. Check the data.
File read error.
An invalid value is set in the input data. Check the data.
Too large number of data [%s]. Max number of data is %s.
The number of input data items exceeds the maximum value (500). Reduce the number of data items.
Input number of data is smaller than recommendable number.
The number of input data items is less than the recommended number of data items to be analyzed (120).* Data is analyzed even if the recommended number of data items to be analyzed is small.Internal error.
An internal error has occurred.
2.20. Checking the process health (clphealthchk command)
Checks the process health.
-
Command line clphealthchk [ -t pm | -t rc | -t rm | -t nm | -h]
Note
This command must be run on the server whose process health is to be checked because this command checks the process health of a single server.
-
Description This command checks the process health of a single server.
-
Option -
None¶ Checks the health of all of pm, rc, rm, and nm.
-
-t<param>¶ <param>
- pmChecks the health of pm.
- rcChecks the health of rc.
- rmChecks the health of rm.
- nmChecks the health of nm.
-
-h¶ Displays the usage.
-
-
Return Value 0
Normal termination.
1
Privilege for execution is invalid.
2
Duplicated activation.
3
Initialization error.
4
The option is invalid.
10
The process stall monitoring function has not been enabled.
11
The cluster is not activated (waiting for the cluster to start or the cluster has been stopped.)
12
The cluster daemon is suspended.
100
There is a process whose health information has not been updated within a certain period.
If the -t option is specified, the health information of the specified process is not updated within a certain period.
255
Other internal error.
-
Examples Example 1: When the processes are healthy
# clphealthchk
pm OK
rc OK
rm OK
nm OK
Example 2: When clprc is stalled
# clphealthchk
pm OK
rc NG
rm OK
nm OK
# clphealthchk -t rc
rc NG
Example 3: When the cluster has been stopped
# clphealthchk
The cluster has been stopped
-
Remarks If the cluster has been stopped or suspended, the process is also stopped.
-
Notes Run this command as a user with Administrator privileges.
-
Error Messages Message
Cause/Solution
Log in as Administrator.
Log in as a user with Administrator privileges.
Initialization error. Check if memory or OS resources are sufficient.
Check to see if the memory or OS resource is sufficient.
Invalid option.
Specify a valid option.
The function of process stall monitor is disabled.
The process stall monitoring function has not been enabled.
The cluster has been stopped.
The cluster has been stopped.
The cluster has been suspended.
The cluster has been suspended.
This command is already run.
The command has already been started.
Internal error. Check if memory or OS resources are sufficient.
Check to see if the memory or OS resource is sufficient.
2.21. Setting an action for OS shutdown initiated by other than cluster service (clpstdncnf command)
Sets an action for OS shutdown initiated by other than cluster service..
-
Command line - clpstdncnf -e [time]clpstdncnf -dclpstdncnf -v
-
Description This command sets an action for OS shutdown initiated by other than cluster service.
-
Option -
-e[time]¶ - Waits for cluster services to be stopped when OS shutdown is initiated by other than cluster service.You can specify a timeout value in minutes (A value between 1 to 1440 can be specified).It is necessary to specify the timeout value at first execution.From the second execution on, if you don't specify the timeout value, the current value is used.
-
-d¶ Does not wait for cluster services to be stopped when OS shutdown is initiated by other than cluster service.
-
-v¶ shows the current setting.
-
-
Return Value 0
Success
Other than 0
Failure
-
Notes - Run this command as a user with Administrator privileges.In case of a virtual environment, such as cloud environment, when OS shutdown is initiated from the virtual infrastructure, power-off may be executed depending on the virtual infrastructure.
-
Example of command execution Example 1: Waits for cluster service to be stopped (timeout = 30 minutes)
# clpstdncnf -e 30
Command succeeded.
# clpstdncnf -v
Mode : wait
Timeout : 30 min
Example 2: Does not wait for cluster service to be stopped
# clpstdncnf -d
Command succeeded.
# clpstdncnf -v
Mode : no wait
Timeout : 30 min
2.22. Displaying the cluster statistics information (clpperfc command)
the clpperfc command displays the cluster statistics information.
-
Command line - clpperfc --starttime -g group_nameclpperfc --stoptime -g group_nameclpperfc -g [group_name]clpperfc -m monitor_name
-
Description This command displays the median values (millisecond) of the group start time and group stop time.
This command displays the monitoring processing time (millisecond) of the monitor resource.
-
Option -
--starttime-g group_name¶ Displays the median value of the group start time.
-
--stoptime-g group_name¶ Displays the median value of the group stop time.
-
-g[group_name]¶ Displays the each median value of the group start time and group stop time.
If groupname is omitted, it displays the each median value of the start time and stop time of all the groups.
-
-mmonitor_name¶ Displays the last monitor processing time of the monitor resource.
-
-
Return value 0
Normal termination
1
Invalid command option
2
User authentication error
3
C onfiguration information load error
4
C onfiguration information load error
5
Initialization error
6
Internal error
7
I nternal communication initialization error
8
I nternal communication connection error
9
I nternal communication processing error
10
T arget group check error
12
Timeout error
-
Example of Execution When displaying the median value of the group start time:
# clpperfc --starttime -g failover1
200
When displaying each median value of the start time and stop time of the specific group:
# clpperfc -g failover1
            start time    stop time
failover1          200          150
When displaying the monitor processing time of the monitor resource:
# clpperfc -m monitor1
100
-
Remarks The time is output in millisecond by this commands.
If the valid start time or stop time of the group was not obtained, - is displayed.
If the valid monitoring time of the monitor resource was not obtained, 0 is displayed.
-
Notes Execute this command as a root user.
-
Error Messages Message
Cause/Solution
Log in as Administrator.
Run this command as an Administrator user.
Invalid option.
The command option is invalid. Check the command option.
Command timeout.
Command execution timed out .
Internal error.
Check if memory or OS resources are sufficient.
2.23. Checking the cluster configuration information (clpcfchk command)
This command checks the cluster configuration information.
-
Command line - clpcfchk -o path [-i conf_path]
-
Description This command checks the validness of the setting values based on the cluster configuration information.
-
Option -
-opath¶ Specifies the directory to store the check results.
-
-iconf_path¶ Specifies the directory which stored the configuration information to check.
If this option is omitted, the applied configuration information is checked.
-
-
Return Value 0
Normal termination
Other
than 0 Termination with an error
-
Example of Execution When checking the applied configuration information:
# clpcfchk -o /tmp
server1 : PASS
When checking the stored configuration information:
# clpcfchk -o /tmp -i /tmp/config
server1 : PASS
-
Execution Result For this command, the following check results (total results) are displayed.
Check Results (Total Results)
Description
PASS
No error found.
FAIL
An error found.Check the check results.
-
Remarks Only the total results of each server are displayed.
-
Notes Run this command as a root user.
When checking the configuration information exported through Cluster WebUI, decompress it in advance.
-
Error Messages Message
Cause/Solution
Log in as Administrator.
Log in as an Administrator user.
Invalid option.
Specify a valid option.
Could not opened the configuration file. Check if the configuration file exists on the specified path.
The specified path does not exist. Specify a valid path.
Server is busy. Check if this command is already run.
This command has been already activated.
Failed to obtain properties.
Failed to obtain the properties.
Failed to check validation.
Failed to check the cluster configuration.
Internal error. Check if memory or OS resources are sufficient.
The amount of memory or OS resources may be insufficient. Check for any insufficiency.
3. Notes and restrictions
This chapter provides cautions on using EXPRESSCLUSTER X SingleServerSafe, as well as the known problems and how to prevent them.
This chapter covers:
3.1. After starting operating EXPRESSCLUSTER X SingleServerSafe
This section provides notes on situations you might encounter after starting to operate EXPRESSCLUSTER.
3.1.1. Restrictions during recovery operation
Do not perform the following operations by using the Cluster WebUI or command line while recovery processing is changing (reactivation -> last operation), if a group resource (an application resource, service resource, or other resource) is specified as a recovery target and when a monitor resource detects an error.
Stopping/suspending the cluster
Starting or stopping a group
3.1.2. Executable format files and script files not described in the command reference
3.1.3. Notes on the Cluster WebUI
If the Cluster WebUI is operated in the state that it cannot communicate with the connection destination, it may take a while until the control returns.
When going through the proxy server, make the settings for the proxy server be able to relay the port number of the Cluster WebUI.
When going through the reverse proxy server, the Cluster WebUI will not operate properly.
When updating EXPRESSCLUSTER X SingleServerSafe, close all running browsers. Clear the browser cache and restart the browser.
Cluster configuration data created using a later version of this product cannot be used with this product.
- When closing the Web browser, the dialog box to confirm to save may be displayed.
 When you continue to edit, click the Stay on this page button.
 - Reloading the Web browser (by selecting Refresh button from the menu or tool bar), the dialog box to confirm to save may be displayed.
 When you continue to edit, click the Stay on this page button.
 For notes and restrictions of Cluster WebUI other than the above, see the online manual.
3.1.4. EXPRESSCLUSTER Disk Agent service
The EXPRESSCLUSTER Disk Agent service is not used for EXPRESSCLUSTER X SingleServerSafe. Do not start this service.
3.1.5. Issues with User Account Control (UAC) in Windows Server 2012 or later environment
In Windows Server 2012 or later or later environment, User Account Control (UAC) is enabled by default. When UAC is enabled, there are following issues.
Monitor Resource
Following resource has issues with UAC.
Oracle Monitor Resource
For the Oracle monitor resource, if you select OS Authentication for Authentication Method and then set any user other than those in the Administrators group as the monitor user, the Oracle monitoring processing will fail.When you set OS Authentication in Authentication Method, the user to be set in Monitor User must belong to the Administrators group.
3.1.6. Screen display of application resource / script resource
Because the processes started from the application resource or script resource of EXPRESSCLUSTER are executed in session 0, when you start a process having GUI, the Interactive services dialog detection pop-up menu is displayed. Unless you select Show me the message, GUI is not displayed.
3.1.7. Environment in which the network interface card (NIC) is duplicated
- Network Initialization complete wait timeYou can configure this setting in Timeout tab of Cluster Properties. If NIC initialization is completed within timeout, the cluster service starts up.
- ARMDELAY command (armdelay.exe)The cluster service starts up after the time that you set with the command from OS startup.
For more details of above setting and command, please refer to the "Legacy Feature Guide" for EXPRESSCLUSTER X.
3.1.8. EXPRESSCLUSTER service login account
The EXPRESSCLUSTER service login account is set in Local System Account. If this account setting is changed, EXPRESSCLUSTER might not properly operate as a cluster.
3.1.9. Monitoring the EXPRESSCLUSTER resident process
The EXPRESSCLUSTER resident process can be monitored by using software monitoring processes. However, recovery actions such as restarting a process when the process abnormally terminated must not be executed.
3.1.10. JVM monitor resources
When restarting the monitoring-target Java VM, you must first suspend JVM monitor resources or stop the cluster.
When changing the JVM monitor resource settings, you must suspend and resume the cluster.
JVM monitor resources do not support a delay warning of monitor resources.
3.1.11. System monitor resources,Process resource monitor resource
To change a setting, the cluster must be suspended.
System monitor resources do not support a delay warning for monitor resources.
- If the date or time setting on the OS is changed while a system monitor resource is operating, that system monitor resource may fail to operate normally.If you have changed the date or time setting on the OS, suspend and then resume the cluster.
No error is detected even after the specified duration for detecting errors has passed.
An error is detected before the specified duration for detecting errors has elapsed.
Up to 26 disks that can be monitored by the disk resource monitoring function of System monitor resources.
4. Error messages
This chapter provides information on error messages you might encounter when operating EXPRESSCLUSTER X SingleServerSafe.
This chapter covers:
4.1. Messages during setup
Module Type |
Error Message |
Solution |
|---|---|---|
setup |
Previous version of EXPRESSCLUSTER is installed. Upgrading from this version is not supported. Install after uninstalling the previous version of EXPRESSCLUSTER. |
Uninstall the previous version of EXPRESSCLUSTER, and then try installing again. |
setup |
The SNMP service is running. You need to stop the SNMP service before you perform uninstallation. Do you want to stop the SNMP service now? |
Select Yes to stop the SNMP service automatically and continue the installation. Or, select No to cancel the installation, manually stop the SNMP service and then perform installation again. |
setup |
Setup has failed.
Error code : xxx
|
- Check the system requirements, setup procedures and notes described in the manual, and make sure they are followed.
- If other application is running, terminate it.
- Install again after restarting the OS.
|
setup |
Setup has failed(xxx).
Error code : xxx
Please reboot the system and try again.
|
- Check the system requirements, setup procedures and notes described in the manual, and make sure these requirements are followed.
- If other application is running, terminate it.
- Install again after starting the OS again.
|
setup |
Unsupported environment. |
Install in the environment where the system requirements are met. |
setup |
Cannot perform uninstallation because there is one or more EXPRESSCLUSTER services still running. Stop all EXPRESSCLUSTER services before you restart uninstallation. |
Stop all EXPRESSCLUSTER services, and then perform uninstallation. |
setup |
Failed to start the installer. (errcode: xxx) |
- Check the system requirements, setup procedures and notes described in the manual, and make sure they are followed.
- If other application is running, terminate it.
- The installer file may be corrupted or missing. Check it.
|
setup |
Internal error.
(xxx)
|
- Check the system requirements, setup procedures and notes described in the manual, and make sure they are followed.
- If other application is running, terminate it.
|
4.2. Messages reported by event log and alert
These are the messages reported by applications, event logs, and alert logs of the Cluster WebUI. Messages with o in the columns of Alert, Eventlog and Userlog are recorded in each log. The following shows how to refer the logs:
Log Name |
How to refer |
File Name |
|---|---|---|
Alert |
Output to the Alert Logs of the Cluster WebUI. Logs can be collected by using the log collection tool. |
alertlog.alt |
Event log |
Output to the Event Viewer (application log) of the OS. Collect logs by using the log collection tool. The source of the event is "EXPRESSCLUSTER X." Logs can be collected by using the log collection tool. Note because they are collected in the binary format with the file names in the right column, it is necessary to open the files using Event Viewer in the environment where EXPRESSCLUSTER is set up to refer to the information. |
AppEvent.Evt
SysEvent.Evt
|
User log |
These are the logs with text format, in which detail information is recorded. They are output in the "userlog.{00 - 02}.log" file in the log folder of the logs collected by using the log collection tool. |
userlog.{00 - 02}.log |
Messages with "o" in the Mail Report column will be sent as e-mail by EXPRESSCLUSTER X Alert Service.
Messages with "o" in the SNMP Trap column will be sent as SNMP trap.
"Report Settings" are settings of when linking to the ESMPRO Agent. In "Alive," the ESMPRO Agent performs the Alert report. In "Manager," alerts are output to the ESMPRO Agent. For details, see the manual of the ESMPRO Agent.
For Mail Alert and SNMP Trap sending, refer to "Alert Service tab" of "Cluster properties" in "Other setting details" in the "EXPRESSCLUSTER X SingleServerSafe Configuration Guide".
The report settings in "Alert Service tab" of "Cluster properties" in "Other setting details" in the "EXPRESSCLUSTER X SingleServerSafe Configuration Guide" cannot be configured for any message marked with x.
If the "o" mark is shown in the Message Topic column, the message on that row is reported when Amazon SNS linkage function is enabled.
For details of Amazon SNS linkage function, see "EXPRESSCLUSTER X SingleServerSafe Configuration Guide" - "Other setting details" - "Cluster properties" - "Cloud tab".
In the table below, each number indicates the following:
[1]Alert, [2]Eventlog, [3]Userlog, [4]Mail Report, [5]SNMP Trap, [6]Alive, [7]Manager, [8]Message Topic
Module Type |
Event Type |
Event ID |
Messages |
Description |
Solution |
1 |
2 |
3 |
4 |
5 |
6 |
7 |
8 |
|---|---|---|---|---|---|---|---|---|---|---|---|---|---|
nm |
Information |
1 |
The server %1 has been started. |
Server up |
- |
o |
o |
||||||
nm |
Information |
2 |
The server %1 has been stopped. |
Server down |
Server down was detected. Remove the failures of the server and then return the server to the cluster. |
o |
o |
o |
o |
o |
o |
o |
|
nm |
Information |
3 |
The resource %2 of the server %1 has been started. |
Resource up |
- |
o |
|||||||
nm |
Error |
4 |
The resource %2 of the server %1 has an error. |
Resource abnormally |
An error of the resource was detected. Refer to the event logs of the appropriate resource. |
o |
|||||||
nm |
Information |
5 |
The resource %2 of the server %1 has been recovered to the normal status. |
Resource recover |
- |
o |
|||||||
nm |
Error |
6 |
The resource %2 of the server %1 is unknown. |
Resource unknown |
Check the cluster configuration data. |
o |
o |
o |
|||||
nm |
Error |
7 |
Network partition was detected. Shut down the server %1 to protect data. |
Network partition detected |
No heartbeat resources can be used. Make sure there is no error in the network adapter and the network is correctly connected. |
o |
o |
o |
o |
o |
|||
nm |
Error |
8 |
An error occurred while confirming the network partition. Shut down the server %1. |
It was not possible to check for a network partition. |
Refer to the event logs to check whether an error has occurred in a resource. |
o |
o |
o |
o |
o |
|||
nm |
Error |
9 |
An error occurred in confirming the network partition. To avoid failover on multiple servers, the server %1 suspended failover. |
Failover hold |
Refer to the event logs to check whether an error has occurred in a resource. |
o |
o |
o |
o |
o |
|||
nm |
Information |
10 |
The server %1 canceled the pending failover. |
Failover hold cancel |
- |
o |
o |
o |
|||||
nm |
Error |
11 |
Shut down the server %1. (reason:%2) |
Server shutdown |
No heartbeat resources can be used. Make sure there is no error in the network adapter and the network is correctly connected. |
o |
o |
o |
o |
||||
nm |
Error |
12 |
Cluster service will be stopped. (reason:%1) |
Cluster service stopping |
Check the cause following the message. |
o |
o |
o |
|||||
nm |
Warning |
13 |
The combination of the network partition resources is invalid. (server name:%1) |
NP resource combination error |
Check the cluster configuration data. |
o |
o |
o |
|||||
nm |
Error |
14 |
The status of heartbeat %1 is abnormal. |
Heartbeat abnormally |
Make sure there is no error in the network adapter and the network is correctly connected. |
o |
o |
o |
o |
||||
nm |
Information |
15 |
The heartbeat %1 has been recovered to the normal status. |
Heartbeat recovered |
- |
o |
o |
||||||
nm |
Error |
16 |
The network partition %2 of the server %1 has an error. |
Network partition abnormally |
Refer to the event logs to check whether an error has occurred in a resource. |
o |
o |
o |
o |
||||
nm |
Information |
17 |
The network partition %2 of the server %1 has been recovered to the normal status. |
Network partition recovered |
- |
o |
o |
||||||
nm |
Error |
18 |
Failed to start the resource %1. Server name:%2 |
Resource start failed |
Refer to the event logs to check whether an error has occurred in a resource. |
o |
o |
o |
o |
||||
nm |
Information |
19 |
Waiting for servers to start up has been canceled. |
Waiting for servers to start up has been canceled. |
- |
o |
o |
||||||
nm |
Error |
20 |
Network partition was detected. Shut down the server %1 for the cluster service to protect data. |
Network partition detected |
No heartbeat resources can be used. Make sure there is no error in the network adapter and the network is correctly connected. |
o |
o |
o |
|||||
nm |
Error |
21 |
An error occurred when checking for a network partition. Shut down the server %1 for the cluster service to protect data. |
It was not possible to check for a network partition. |
Refer to the event logs to check whether an error has occurred in a resource. |
o |
o |
o |
|||||
nm |
Error |
22 |
Network partition was detected. Execute action(%1) on the server %2 for the cluster service to protect data. |
Network partition |
No heartbeat resources can be used. Make sure there is no error in the network adapter and the network is correctly connected. |
o |
o |
o |
|||||
nm |
Error |
23 |
An error occurred when checking for a network partition. Execute action(%1) on the server %2 for the cluster service to protect data. |
Can not network partition resolution |
Refer to the event logs to check whether an error has occurred in a resource. |
o |
o |
o |
|||||
nm |
Error |
24 |
Execute action(%1) on the server %2. (reason:%3) |
Can not network partition resolution |
No heartbeat resources can be used. Make sure there is no error in the network adapter and the network is correctly connected. |
o |
o |
o |
|||||
nm |
Warning |
25 |
The NP resolution process at the cluster startup is disabled. |
Network partition resolution disabled |
The NP resolution process at the cluster startup is disabled. |
o |
o |
o |
|||||
pm |
Information |
501 |
Cluster service has been started properly. |
Cluster service started |
- |
o |
o |
o |
|||||
pm |
Information |
502 |
Cluster service is shutting down. |
Cluster service shutting down |
- |
o |
o |
o |
|||||
pm |
Error |
510 |
Cluster service has already been started. |
Cluster service already started |
Check the status of cluster service. |
o |
o |
o |
o |
||||
pm |
Error |
511 |
Fatal error has occurred in the cluster service. |
Critical error in cluster service |
The service is not run by a user with required privilege or the system may not be able to operate properly. |
o |
o |
o |
o |
o |
o |
o |
|
pm |
Error |
512 |
An error is detected in xml library. |
problem detected in xml library |
The system may not be able to operate properly. |
o |
o |
o |
o |
||||
pm |
Error |
513 |
An error is detected in configuration file. |
problem detected in configuration file |
Check the cluster configuration data. |
o |
o |
o |
o |
o |
o |
o |
|
pm |
Error |
514 |
Configuration file does not exist. |
Configuration file not exists |
Upload the cluster configuration data. |
o |
o |
o |
o |
||||
pm |
Error |
515 |
My host name is not found in configuration file. |
my name not found in configuration file |
Check the cluster configuration data. |
o |
o |
o |
o |
||||
pm |
Error |
520 |
%1 process terminated abnormally. |
process exit abnormally |
The system may not be able to operate properly. The abend of the nm process, which does not affect the business operation, prevents you from stopping the cluster. To recover from it, restart the OS by using Cluster WebUI or the clpdown command. |
o |
o |
o |
o |
o |
o |
o |
|
pm |
Error |
521 |
The cluster service process returned an error. (halting system) |
Rc process exit with error |
Deactivation of group resources may be failed. Take appropriate action by following the group resource message. |
o |
o |
o |
o |
||||
pm |
Error |
522 |
An error has occurred while initializing %1 process. (return code:%2) |
process init error |
Check the cause of an initialization error and troubleshoot it. |
o |
o |
o |
o |
o |
o |
o |
|
pm |
Information |
523 |
The system will be shut down. |
system halting |
- |
o |
o |
o |
|||||
pm |
Information |
524 |
Cluster service will be stopped. |
Cluster service stopping |
- |
o |
o |
o |
|||||
pm |
Information |
525 |
System will be rebooted. |
System rebooting |
- |
o |
o |
o |
|||||
pm |
Information |
526 |
%1 process will be restarted. |
Process restarting |
- |
o |
o |
o |
|||||
pm |
Information |
527 |
Emergency shutdown is in progress. |
Emergency shutdown |
- |
o |
o |
o |
|||||
pm |
Information |
528 |
Generating STOP error. |
Stop Error |
- |
o |
o |
o |
|||||
pm |
Information |
529 |
Generating hardware reset. |
HW reset |
- |
o |
o |
o |
|||||
pm |
Information |
530 |
There was a request to shut down the system from the %1. |
request of system halt |
- |
o |
o |
o |
|||||
pm |
Information |
531 |
There was a request to stop cluster service from the %1. |
request of cluster service stop |
- |
o |
o |
o |
|||||
pm |
Information |
532 |
There was a request to reboot system from the %1. |
request of system reboot |
- |
o |
o |
o |
|||||
pm |
Information |
533 |
There was a request to restart cluster service from the %1. |
request of cluster service restart |
- |
o |
o |
o |
|||||
pm |
Information |
534 |
There was a request to resume cluster service from the %1. |
request of cluster service resume |
o |
o |
o |
||||||
pm |
Information |
535 |
There was a request to suspend cluster service from the %1. |
request of cluster service suspend |
- |
o |
o |
o |
|||||
pm |
Information |
536 |
There was a request of emergency shutdown from the %1. |
request of emergency shutdown |
- |
o |
o |
o |
|||||
pm |
Information |
537 |
There was a request to generate STOP error from the %1. |
request of STOP error |
- |
o |
o |
o |
|||||
pm |
Information |
538 |
There was a request to generate hardware reset from the %1. |
request of HW reset |
- |
o |
o |
o |
|||||
pm |
Information |
540 |
Requesting shutdown to the automatic running control software. |
shutdown request to the automatic running control software start |
- |
o |
o |
o |
|||||
pm |
Information |
541 |
Requesting shutdown (reboot) to the automatic running control software. |
shutdown (reboot) request to the automatic running control software |
- |
o |
o |
o |
|||||
pm |
Information |
542 |
Shutdown request to the automatic running control software is completed. |
shutdown request to the automatic running control software complete |
- |
o |
o |
o |
|||||
pm |
Error |
543 |
The automatic running control software returned an error to the shutdown request. |
shutdown by ESMPRO/AC fail |
The automatic operating settings may be incorrect. Check the settings. |
o |
o |
o |
o |
||||
pm |
Error |
544 |
Communications with the automatic running control software failed. |
Communications with ESMPRO/AC fail |
The system may not be able to operate properly. |
o |
o |
o |
o |
||||
pmsvc |
Error |
801 |
The system will be shutdown because cluster resume was failed. |
Failed to resume the cluster daemon |
- |
o |
o |
o |
|||||
pmsvc |
Error |
802 |
An attempt to shutdown the system failed. |
Failed to shutdown the system |
The system may not be able to operate properly. |
o |
o |
o |
|||||
pmsvc |
Information |
810 |
The system shutdown was initiated by other than cluster service. Stopping cluster service. (timeout=%1 min). |
Stopping cluster service. |
- |
o |
o |
o |
|||||
pmsvc |
Information |
811 |
Stopping cluster service has been completed. |
Stopping cluster service has been completed. |
- |
o |
o |
o |
|||||
pmsvc |
Error |
812 |
Stopping cluster service has timed out. |
Stopping cluster service has timed out. |
- |
o |
o |
o |
|||||
pmsvc |
Warning |
813 |
Stopping cluster service has been canceled. |
Stopping cluster service has been canceled. |
- |
o |
o |
o |
|||||
rc |
Information |
1010 |
The group %1 is starting. |
group-start started |
- |
o |
o |
o |
|||||
rc |
Information |
1011 |
The group %1 has been started. |
group-start ended |
- |
o |
o |
o |
|||||
rc |
Error |
1012 |
Failed to start the group %1. |
group-start failed |
Take appropriate action by following the group resource message. |
o |
o |
o |
o |
||||
rc |
Information |
1015 |
Waiting for group %1 to start has started. |
waiting for group to start has started. |
- |
o |
o |
o |
|||||
rc |
Information |
1016 |
Waiting for group %1 to start has been completed. |
waiting for group to start has been completed. |
- |
o |
o |
o |
|||||
rc |
Error |
1017 |
Group start was canceled because waiting for group %1 to start was timed out. (%2) |
waiting for group to start has timed out. |
Check the status of the group waiting to start.
If the group has not yet been started, re-perform the group operation after starting that group.
|
o |
o |
o |
|||||
rc |
Warning |
1018 |
Waiting for group %1 to start has timed out. However, group start continues. (%2) |
group start continues. |
- |
o |
o |
o |
|||||
rc |
Warning |
1019 |
Server %1 is not in a condition to start group %2. |
cannot-start-group |
Perform server recovery if the target server is suspended (Isolated). If it is suspended (Network Partition Unsolved), recover network partition resources to the normal status. |
o |
|||||||
rc |
Information |
1020 |
The group %1 is stopping. |
group-stop started |
- |
o |
o |
o |
|||||
rc |
Information |
1021 |
The group %1 has been stopped. |
group-stop ended |
- |
o |
o |
o |
|||||
rc |
Error |
1022 |
Failed to stop the group %1. |
group-stop failed |
Take appropriate action by following the group resource message. |
o |
o |
o |
o |
||||
rc |
Information |
1025 |
Waiting for group %1 to stop has started. |
waiting for group to stop has started. |
- |
o |
o |
o |
|||||
rc |
Information |
1026 |
Waiting for group %1 to stop has started. |
waiting for group to stop has been completed. |
- |
o |
o |
o |
|||||
rc |
Error |
1027 |
Group stop has been canceled because waiting for group %1 to stop has timed out. (%2) |
waiting for group to stop has timed out. |
Check the status of the group waiting to stop.
If the group has not yet been stopped, re-perform the group operation after stopping that group.
|
o |
o |
o |
|||||
rc |
Warning |
1028 |
Waiting for group %1 to stop has timed out. However, group stop continues. (%2) |
group stop continues. |
- |
o |
o |
o |
|||||
rc |
Information |
1030 |
The resource %1 is starting. |
resource-start started |
- |
o |
o |
||||||
rc |
Information |
1031 |
The resource %1 has been started. |
resource-start ended |
- |
o |
o |
||||||
rc |
Error |
1032 |
Failed to start the resource %1. (%2 : %3) |
resource-start failed |
Check the cause for failing to start the resource.
If a stall occurs during start processing, "Failed to start the resource %1. (99 : command is timeout)" is output.
|
o |
o |
o |
o |
o |
o |
o |
|
rc |
Error |
1033 |
Failed to start the recovery script of resource %1. (%2 : %3) |
recoverscript-start failed |
Check the cause for failing to start the recovery script. |
o |
o |
o |
o |
||||
rc |
Information |
1034 |
A request to activate %1 resource on server %2 has been started. |
Resource start request to the standby server |
- |
o |
o |
o |
|||||
rc |
Information |
1035 |
A request to activate %1 resource on server %2 has been completed. |
Resource start request to the standby server completed. |
- |
o |
o |
o |
|||||
rc |
Error |
1036 |
A request to activate %1 resource on server %2 has been failed. |
Resource activation request to the standby server failed. |
Check if there is an error with the network or with the remote server. |
o |
o |
o |
|||||
rc |
Information |
1040 |
The resource %1 is stopping. |
resource-stop started |
- |
o |
o |
||||||
rc |
Information |
1041 |
The resource %1 has been stopped. |
resource-stop ended |
- |
o |
o |
||||||
rc |
Error |
1042 |
Failed to stop the resource %1. (%2 : %3) |
resource-stop failed |
Check the cause for failing to stop the resource.
If a stall occurs during stop processing, "Failed to stop the resource %1. (99 : command is timeout)" is output.
|
o |
o |
o |
o |
o |
o |
o |
|
rc |
Information |
1044 |
A request to stop %1 resource on server %2 has been started. |
Resource stop request to the standby server |
- |
o |
o |
o |
|||||
rc |
Information |
1045 |
A request to stop %1 resource on server %2 has been completed. |
Resource stop request to the standby server completed. |
- |
o |
o |
o |
|||||
rc |
Error |
1046 |
A request to stop %1 resource on server %2 has been failed. |
Resource stop request to the standby server failed. |
Check if there is an error with the network or with the remote server. |
o |
o |
o |
|||||
rc |
Information |
1050 |
Moving the group %1. |
group-move started |
- |
o |
o |
o |
|||||
rc |
Information |
1051 |
The group %1 has been moved. |
group-move ended |
- |
o |
o |
o |
|||||
rc |
Error |
1052 |
Failed to move the group %1. |
group-move failed |
Take appropriate action by following the group resource message. |
o |
o |
o |
o |
||||
rc |
Warning |
1059 |
Server %1 is not in a condition to move group %2. |
cannot-move-group |
Perform server recovery if the target server is suspended (Isolated). If it is suspended (Network Partition Unsolved), recover network partition resources to the normal status. |
o |
|||||||
rc |
Information |
1060 |
Failing over the group %1. |
group-failover started |
- |
o |
o |
o |
|||||
rc |
Information |
1061 |
The group %1 has been failed over. |
group-failover ended |
- |
o |
o |
o |
|||||
rc |
Error |
1062 |
Failed to fail over the group %1. |
group-failover failed |
Take appropriate action by following the group resource message. |
o |
o |
o |
o |
||||
rc |
Information |
1070 |
Restarting the group %1. |
group-restart started |
- |
o |
o |
o |
|||||
rc |
Information |
1071 |
The group %1 has been restarted. |
group-restart ended |
- |
o |
o |
o |
|||||
rc |
Error |
1072 |
Failed to restart the group %1. |
group-restart failed |
Take appropriate action by following the group resource message. |
o |
o |
o |
o |
||||
rc |
Error |
1077 |
Group failover has failed because there is a server incapable of internal communication. |
group-failover failed (internal communication disabled) |
Check the LAN heartbeat status in kernel mode. Start the group after recovering internal communication. |
o |
o |
o |
|||||
rc |
Information |
1080 |
Restarting the resource %1. |
resource-restart started |
- |
o |
o |
o |
|||||
rc |
Information |
1081 |
The resource %1 has been restarted. |
resource-restart ended |
- |
o |
o |
o |
|||||
rc |
Error |
1082 |
Failed to restart the resource %1. |
resource-restart failed |
Take appropriate action by following the group resource message. |
o |
o |
o |
o |
||||
rc |
Information |
1090 |
Shutting down the cluster. |
cluster shutdown |
- |
o |
o |
o |
|||||
rc |
Information |
1091 |
Shutting down the server. |
server shutdown |
- |
o |
o |
o |
|||||
rc |
Error |
1092 |
Group %1 is started on more than one server. |
group double start |
Server will automatically be shut down. Check the cause for the group to be started in more than one server. |
o |
o |
o |
o |
o |
o |
o |
|
rc |
Error |
1093 |
The system shutdown was performed by other than the cluster service. |
system shutdown by other than cluster service |
It is considered as an error if the system shuts down by other than cluster service. Follow the appropriate steps to shut down the system. |
o |
o |
o |
o |
||||
rc |
Warning |
1100 |
Shutdown count is reached the maximum number (%1). Final action of resource %2 was ignored. |
shutdown count reached the limit |
- |
o |
o |
o |
o |
o |
o |
o |
|
rc |
Warning |
1101 |
Since there is no other normally running server, the final action for an activation error of group resource %1 was suppressed. |
Suppression of final action for activation error |
- |
o |
o |
o |
|||||
rc |
Warning |
1102 |
Since there is no other normally running server, the final action for a deactivation error of group resource %1 was suppressed. |
Suppression of final action for deactivation error |
- |
o |
o |
o |
|||||
rc |
Warning |
1103 |
Since server %1 is specified as that which suppresses shutdown at both-system activation detection, it ignored the shutdown request. |
Suppression of shutdown caused by both-system activation detection |
- |
o |
o |
o |
|||||
rc |
Warning |
1104 |
A mismatch in the group %1 status occurs between the servers. |
Generation of group status mismatch |
Restart the group or reboot the cluster. |
o |
o |
o |
|||||
rc |
Information |
1105 |
Since server %1 is not specified as that which suppresses shutdown at both-system activation detection, it executed the shutdown request. |
Shutdown caused by both-system |
- |
o |
o |
o |
|||||
rc |
Information |
1110 |
Server %1 is returned to the cluster. |
server returned |
- |
o |
o |
o |
|||||
rc |
Information |
1111 |
Server %1 is isolated from the cluster. |
server isolated |
- |
o |
o |
o |
|||||
rc |
Information |
1112 |
Server %1 started to return to the cluster. |
server return start |
- |
o |
o |
o |
|||||
rc |
Error |
1113 |
Server %1 failed to return to the cluster. |
server return fail |
The system may not be able to operate properly. |
o |
o |
o |
o |
||||
rc |
Information |
1120 |
Server %1 will notify the automatic running control software of shutdown start. |
shutdown notification start |
- |
o |
o |
o |
|||||
rc |
Error |
1121 |
The automatic running control software returned an error to the shutdown start notification in server %1. |
shutdown notification fail |
The automatic operating settings may be incorrect. Check the settings. |
o |
o |
o |
o |
||||
rc |
Information |
1122 |
Server %1 notified the automatic running control software of shutdown start. |
shutdown notification finish |
- |
o |
o |
o |
|||||
rc |
Information |
1123 |
The automatic running control software is checking the power status of shared disks. A server will be restarted after the power status is checked. |
waiting for disk power-on |
- |
o |
o |
o |
|||||
rc |
Error |
1124 |
An error was returned from the automatic running control software. Failed to check the power status of shared disks. |
disk power-on confirmation failed |
The automatic operating settings may be incorrect. Check the settings. An error may have occurred in the automatic power control unit. Check the automatic power control unit. |
o |
o |
o |
o |
||||
rc |
Error |
1125 |
Server %1 failed to communicate with the automatic running control software. |
communications with the automatic running control software failed |
The system may not be able to operate properly. |
o |
o |
o |
o |
||||
rc |
Information |
1130 |
Starting a single resource %1. |
single-resource-start started |
- |
o |
o |
o |
|||||
rc |
Information |
1131 |
A single resource %1 has been started. |
single-resource-start ended |
- |
o |
o |
o |
|||||
rc |
Error |
1132 |
Failed to start a single resource %1. |
single-resource-start failed |
Take appropriate action by following the group resource message. |
o |
o |
o |
o |
||||
rc |
Warning |
1139 |
Server %1 is not in a condition to start a single resource %2. |
cannot-start-single-resource |
Perform server recovery if the target server is suspended (Isolated). If it is suspended (Network Partition Unsolved), recover network partition resources to the normal status. |
o |
|||||||
rc |
Information |
1140 |
Stopping a single resource %1. |
single-resource-stop started |
- |
o |
o |
o |
|||||
rc |
Information |
1141 |
A single resource %1 has been stopped. |
single-resource-stop ended |
- |
o |
o |
o |
|||||
rc |
Error |
1142 |
Failed to stop a single resource %1. |
single-resource-stop failed |
Take appropriate action by following the group resource message. |
o |
o |
o |
o |
||||
rc |
Information |
1150 |
The group %1 is being migrated. |
The group is being migrated. |
- |
o |
o |
o |
|||||
rc |
Information |
1151 |
The group %1 has been migrated. |
The group has been migrated. |
- |
o |
o |
o |
|||||
rc |
Error |
1152 |
Failed to migrate the group %1. |
Migrating the group has failed. |
Take appropriate action by following the group resource message. |
o |
o |
o |
|||||
rc |
Warning |
1159 |
Server %1 is not in a condition to migrate group %2. |
The group cannot be migrated. |
Perform server recovery if the target server is suspended (isolated). If it is suspended (due to an unresolved network partition), recover network partition resources to the normal status. |
o |
o |
o |
|||||
rc |
Information |
1170 |
Server %1 in the same server group (%2) has been set as the destination for the group %3. |
The destination found in the same server group |
- |
o |
o |
o |
|||||
rc |
Information |
1171 |
Server %1 not in the same server group (%2) has been set as the destination for the group %3. |
The destination found in the other server group |
- |
o |
o |
o |
|||||
rc |
Warning |
1179 |
Can not fail over the group %1 because there is no appropriate destination in the same server group %2. |
The destination not found in the same server group |
Check if other servers in the same server group are stopped or isolated. If so, start the servers or return the servers to the cluster. |
o |
o |
o |
|||||
rc |
Information |
1200 |
The resource %1 will be restarted since starting the resource %2 failed. |
resource-restart by resource-acterr |
- |
o |
o |
o |
|||||
rc |
Information |
1201 |
The group %1 will be failed over to server %2 since starting the resource %3 failed. |
group-failover by resource-acterr |
- |
o |
o |
o |
|||||
rc |
Information |
1202 |
The group %1 will be stopped since starting the resource %2 failed. |
group-stop by resource-acterr |
- |
o |
o |
o |
|||||
rc |
Information |
1203 |
The cluster service will be stopped since starting the resource %1 failed. |
service-stop by resource-acterr |
- |
o |
o |
o |
|||||
rc |
Information |
1204 |
The system will be shut down since starting the resource %1 failed. |
shutdown-system by resource-acterr |
- |
o |
o |
o |
|||||
rc |
Information |
1205 |
The system will be rebooted since starting the resource %1 failed. |
reboot-system by resource-acterr |
- |
o |
o |
o |
|||||
rc |
Information |
1220 |
The resource %1 will be stopped again since stopping the resource %2 failed. |
resource-stop retry by resource-deacterr |
- |
o |
o |
o |
|||||
rc |
Information |
1223 |
The cluster service will be stopped since stopping the resource %1 failed. |
service-stop by resource-deacterr |
- |
o |
o |
o |
|||||
rc |
Information |
1224 |
The system will be shut down since stopping the resource %1 failed. |
shutdown-system by resource-deacterr |
- |
o |
o |
o |
|||||
rc |
Information |
1225 |
The system will be rebooted since stopping the resource %1 failed. |
reboot-system by resource-deacterr |
- |
o |
o |
o |
|||||
rc |
Information |
1241 |
Hardware reset will be generated since starting the resource %1 failed. |
hw-reset by resource-acterr |
- |
o |
o |
o |
|||||
rc |
Information |
1242 |
STOP error will be generated since starting the resource %1 failed. |
stop-error by resource-acterr |
- |
o |
o |
o |
|||||
rc |
Information |
1281 |
Hardware reset will be generated since stopping the resource %1 failed. |
hw-reset by resource-deacterr |
- |
o |
o |
o |
|||||
rc |
Information |
1282 |
STOP error will be generated since stopping the resource %1 failed. |
stop-error by resource-deacterr |
- |
o |
o |
o |
|||||
rc |
Information |
1300 |
Script before final action upon activation failure in resource %1 started. |
Script before final action upon resource activation failure started. |
- |
o |
o |
o |
|||||
rc |
Information |
1301 |
Script before final action upon activation failure in resource %1 completed. |
Script before final action upon resource activation failure completed. |
- |
o |
o |
o |
|||||
rc |
Information |
1302 |
Script before final action upon deactivation failure in resource %1 started. |
Script before final action upon resource deactivation failure started. |
- |
o |
o |
o |
|||||
rc |
Information |
1303 |
Script before final action upon deactivation failure in resource %1 completed. |
Script before final action upon resource deactivation failure completed. |
- |
o |
o |
o |
|||||
rc |
Information |
1304 |
Script before activation in resource %1 started. |
Script before resource activation started. |
- |
o |
o |
o |
|||||
rc |
Information |
1305 |
Script before activation in resource %1 completed. |
Script before resource activation completed. |
- |
o |
o |
o |
|||||
rc |
Information |
1306 |
Script after activation in resource %1 started. |
Script after resource activation started. |
- |
o |
o |
o |
|||||
rc |
Information |
1307 |
Script after activation in resource %1 completed. |
Script after resource activation completed. |
- |
o |
o |
o |
|||||
rc |
Information |
1308 |
Script before deactivation in resource %1 started. |
Script before resource deactivation started. |
- |
o |
o |
o |
|||||
rc |
Information |
1309 |
Script before deactivation in resource %1 completed. |
Script before resource deactivation completed. |
- |
o |
o |
o |
|||||
rc |
Information |
1310 |
Script after deactivation in resource %1 started. |
Script after resource deactivation started. |
- |
o |
o |
o |
|||||
rc |
Information |
1311 |
Script after deactivation in resource %1 completed. |
Script after resource deactivation completed. |
- |
o |
o |
o |
|||||
rc |
Error |
1340 |
Script before final action upon activation failure in resource %1 failed. |
Script before final action upon resource activation failure failed. |
Check the cause of the script failure and take measures. |
o |
o |
o |
o |
||||
rc |
Error |
1341 |
Script before final action upon deactivation failure in resource %1 failed. |
Script before final action upon resource deactivation failure failed. |
Check the cause of the script failure and take measures. |
o |
o |
o |
o |
||||
rc |
Error |
1342 |
Failed to execute script before activation in resource %1. |
Script before resource activation failed. |
Check the cause of the script failure and take measures. |
o |
o |
o |
o |
||||
rc |
Error |
1343 |
Failed to execute script after activation in resource %1. |
Script after resource activation has failed. |
Check the cause of the script failure and take measures. |
o |
o |
o |
o |
||||
rc |
Error |
1344 |
Failed to execute script before deactivation in resource %1. |
Script before resource deactivation failed. |
Check the cause of the script failure and take measures. |
o |
o |
o |
o |
||||
rc |
Error |
1345 |
Failed to execute script after deactivation in resource %1. |
Script after resource deactivation failed. |
Check the cause of the script failure and take measures. |
o |
o |
o |
o |
||||
rc |
Error |
1346 |
Failed to log on as a user. |
Logon as a user failed |
Check if the domain, account and password of the execution user are correctly set. |
o |
o |
o |
|||||
rc |
Information |
1400 |
Forced stop (BMC Power Off) of server %1 has been requested. |
forced-stop (bmc-poweroff) requested |
- |
o |
|||||||
rc |
Information |
1401 |
Forced stop (BMC Power Cycle) of server %1 has been requested. |
forced-stop (bmc-powercycle) requested |
- |
o |
|||||||
rc |
Information |
1402 |
Forced stop (BMC Reset) of server %1 has been requested. |
forced-stop (bmc-reset) requested |
- |
o |
|||||||
rc |
Information |
1403 |
Forced stop (BMC NMI) of server %1 has been requested. |
forced-stop (bmc-nmi) requested |
- |
o |
|||||||
rc |
Information |
1404 |
Forced stop has been requested. |
forced-stop (VMware vSphere CLI) requested |
- |
o |
|||||||
rc |
Information |
1405 |
Script for forced stop has started. |
Script for forced-stop has started. |
- |
o |
|||||||
rc |
Information |
1406 |
Script for forced stop has completed. |
Script for forced-stop has completed. |
- |
o |
|||||||
rc |
Error |
1420 |
Forced stop (BMC Power Off) of server %1 failed. |
forced-stop (bmc-poweroff) failed |
The system may not be able to operate properly. |
o |
o |
o |
o |
||||
rc |
Error |
1421 |
Forced stop (BMC Power Cycle) of server %1 failed. |
forced-stop (bmc-powercycle) failed |
The system may not be able to operate properly. |
o |
o |
o |
o |
||||
rc |
Error |
1422 |
Forced stop (BMC Reset) of server %1 failed. |
forced-stop (bmc-reset) failed |
The system may not be able to operate properly. |
o |
o |
o |
o |
||||
rc |
Error |
1423 |
Forced stop (BMC NMI) of server %1 failed. |
forced-stop (bmc-nmi) failed |
The system may not be able to operate properly. |
o |
o |
o |
o |
||||
rc |
Error |
1424 |
Forced stop failed. |
forced-stop (VMware vSphere CLI) failed |
The system may not be able to operate properly. |
o |
o |
o |
o |
||||
rc |
Error |
1425 |
Script for forced stop has failed. (%1) |
Script for forced-stop has stopped. |
Check the cause of the script failure and take measures. |
o |
o |
o |
o |
||||
rc |
Error |
1426 |
Script for forced stop has timed out. |
Timeout on the-script for forced stop |
Check the cause of the script timeout and take measures. |
o |
o |
o |
o |
||||
rc |
Warning |
1427 |
Group failover has been canceled because forced stop of server %1 failed. |
Suppression of failover for forceed stop failed |
Check the cause of the forced stop failure and take measures. |
o |
o |
o |
|||||
rc |
Information |
1440 |
The CPU frequency has been set to high. |
The CPU frequency has been set to high. |
- |
o |
o |
o |
|||||
rc |
Information |
1441 |
The CPU frequency has been set to low. |
The CPU frequency has been set to low. |
- |
o |
o |
o |
|||||
rc |
Information |
1442 |
The CPU frequency has been set to %1. |
The CPU frequency has been set. |
- |
o |
o |
o |
|||||
rc |
Information |
1443 |
CPU frequency setting has been switched to automatic control by cluster. |
CPU frequency setting has been switched to automatic control by cluster. |
- |
o |
o |
o |
|||||
rc |
Warning |
1450 |
Cluster action is disabled. |
Cluster action is disabled. |
- |
o |
o |
o |
|||||
rc |
Warning |
1451 |
Ignored the automatic start of groups because automatic group startup is disabled. |
Automatic group startup is not executed. |
- |
o |
o |
o |
|||||
rc |
Warning |
1452 |
Ignored the recovery action in resource activation because recovery action caused by group resource activation error is disabled. |
Resource recovery action is not executed. |
- |
o |
o |
o |
|||||
rc |
Warning |
1453 |
Ignored the recovery action in resource deactivation because recovery action caused by group resource deactivation error is disabled. |
Resource recovery action is not executed. |
- |
o |
o |
o |
|||||
rc |
Information |
1454 |
Cluster action is set disabled. |
Cluster action is disabled. |
- |
o |
o |
o |
|||||
rc |
Information |
1455 |
Cluster action is set enabled. |
Cluster action is enabled. |
- |
o |
o |
o |
|||||
rc |
Error |
1460 |
CPU frequency control cannot be used. |
CPU frequency control cannot be used. |
Check BIOS settings and kernel settings. |
o |
o |
o |
o |
||||
rc |
Error |
1461 |
Failed to set the CPU frequency to high. |
Setting the CPU frequency to high has failed. |
Check BIOS settings and kernel settings. Check if the cluster service is started. Check if the configuration is set so that CPU frequency control is used. |
o |
o |
o |
o |
||||
rc |
Error |
1462 |
Failed to set the CPU frequency to low. |
Setting the CPU frequency to low has failed. |
Check BIOS settings and kernel settings. Check if the cluster service is started. Check if the configuration is set so that CPU frequency control is used. |
o |
o |
o |
o |
||||
rc |
Error |
1463 |
Failed to set the CPU frequency to %1. |
Setting the CPU frequency has failed. |
Check BIOS settings and kernel settings. Check if the cluster service is started. Check if the configuration is set so that CPU frequency control is used. |
o |
o |
o |
o |
||||
rc |
Error |
1464 |
Failed to switch the CPU frequency setting to automatic control by cluster. |
Switching the CPU frequency setting to automatic control by cluster has failed. |
Check if the cluster service is started. Check if the configuration is set so that CPU frequency control is used. |
o |
o |
o |
o |
||||
rc |
Information |
1470 |
Server %1 has been set as the destination for the group %2 (reason: %3). |
destination found |
- |
o |
o |
o |
|||||
rc |
Warning |
1471 |
There is no appropriate destination for the group %1 (reason: %2). |
destination not found |
Check if any monitor resources detects an error on the other servers. |
o |
o |
o |
o |
||||
rc |
Warning |
1472 |
Server %1 is not in a condition to start group %2 (reason: %3). |
not in a condition to start group |
Check if any monitor resources detects an error on the server. |
o |
o |
o |
|||||
rc |
Error |
1480 |
Group start has been canceled because waiting for group %1 to start has failed. (%2) |
waiting for group to start failed |
- |
o |
o |
o |
|||||
rc |
Warning |
1481 |
Waiting for group %1 to start has failed. However, group start continues. (%2) |
waiting for group to start failed |
- |
o |
o |
o |
|||||
rc |
Error |
1482 |
Group start has been canceled because waiting for group %1 to start has canceled. |
waiting for group to start canceled |
- |
o |
o |
o |
|||||
rc |
Warning |
1483 |
Waiting for group %1 to start has canceled. However, group start continues. |
waiting for group to start canceled |
- |
o |
o |
o |
|||||
rc |
Error |
1484 |
Group stop has been canceled because waiting for group %1 to stop has failed. (%2) |
waiting for group to stop failed |
- |
o |
o |
o |
|||||
rc |
Warning |
1485 |
Waiting for group %1 to stop has failed. However, group stop continues. (%2) |
waiting for group to stop failed |
- |
o |
o |
o |
|||||
rc |
Error |
1486 |
Group stop has been canceled because waiting for group %1 to stop has canceled. |
waiting for group to stop canceled |
- |
o |
o |
o |
|||||
rc |
Warning |
1487 |
Waiting for group %1 to stop has canceled. However, group stop continues. |
waiting for group to stop canceled |
- |
o |
o |
o |
|||||
rc |
Information |
1490 |
Group %1 started to check the double activation. |
check the double activation started |
- |
o |
|||||||
rc |
Information |
1491 |
Group %1 completed to check the double activation. |
check the double activation ended |
- |
o |
|||||||
rc |
Error |
1492 |
Group %1 failed to check the double activation. |
check the double activation failed |
Check the status of the group. |
o |
o |
o |
o |
||||
rc |
Information |
1493 |
Waiting for group %1 to start for check the double activation. |
group start continues for check the double activation |
Check the status of the group. |
o |
o |
o |
|||||
rm |
Information |
1501 |
Monitor %1 has been started. |
Monitor start |
- |
o |
o |
o |
|||||
rm |
Information |
1502 |
Monitor %1 has been stopped. |
Monitor stop |
- |
o |
o |
o |
|||||
rm |
Information |
1503 |
Monitor %1 does not monitor in this server. |
Not target server |
- |
o |
o |
o |
|||||
rm |
Warning |
1504 |
Monitor %1 is in the warning status. (%2 : %3) |
Monitor warn |
Check the cause of Warning. |
o |
o |
o |
o |
||||
rm |
Warning |
1505 |
The number of monitor resources reached the maximum number. (registered resource: %1) |
invalid number of monitor resource |
Check the cluster configuration data. |
o |
o |
o |
o |
||||
rm |
Warning |
1506 |
Configuration of %1 is invalid. (%2 : %3) |
invalid monitor resource |
Check the cluster configuration data. |
o |
o |
o |
o |
||||
rm |
Error |
1507 |
Failed to start monitor %1. |
monitor starting failed |
The system may not be able to operate properly. |
o |
o |
o |
o |
o |
o |
o |
|
rm |
Error |
1508 |
Failed to stop monitor %1. |
monitor stopping failed |
The system may not be able to operate properly. |
o |
o |
o |
o |
||||
rm |
Error |
1509 |
Monitor %1 detected an error. (%2 : %3) |
monitor failed |
Check the cause for monitor error. |
o |
o |
o |
o |
o |
o |
o |
|
rm |
Information |
1510 |
Monitor %1 is not monitored. |
not monitored |
- |
o |
o |
o |
|||||
rm |
Information |
1511 |
Monitor resource has not been registered. |
unregistered monitor resource |
- |
o |
o |
o |
|||||
rm |
Information |
1512 |
%1 was stopped for failure in monitor %2. |
relation stop |
- |
o |
o |
o |
|||||
rm |
Information |
1513 |
%1 was restarted for failure in monitor %2. |
relation restart |
- |
o |
o |
o |
|||||
rm |
Information |
1514 |
%1 was failed over for failure in monitor %2. |
relation group failover |
- |
o |
o |
o |
|||||
rm |
Information |
1515 |
There was a request to stop cluster for failure in monitor %1. |
cluster stop |
- |
o |
o |
o |
|||||
rm |
Information |
1516 |
There was a request to shut down the system for failure in monitor %1. |
system shutdown |
- |
o |
o |
o |
|||||
rm |
Information |
1517 |
There was a request to restart the system for failure in monitor %1. |
system reboot |
- |
o |
o |
o |
|||||
rm |
Error |
1518 |
Failed to stop %1 due to error detection of %2. |
relation stop failure |
Check the status of resources. |
o |
o |
o |
o |
||||
rm |
Error |
1519 |
Failed to restart %1 due to error detection of %2. |
relation restart failure |
Check the status of resources. |
o |
o |
o |
o |
||||
rm |
Error |
1520 |
Failed to fail over %1 due to error detection of %2. |
relation group failover failure |
Check the status of resources. |
o |
o |
o |
o |
||||
rm |
Error |
1521 |
Failed to stop the cluster due to error detection of %1. |
cluster stop failure |
The system may not be able to operate properly. |
o |
o |
o |
o |
||||
rm |
Error |
1522 |
Failed to shut down the system due to error detection of %1. |
os shutdown failure |
The system may not be able to operate properly. |
o |
o |
o |
o |
||||
rm |
Error |
1523 |
Failed to restart the system due to error detection of %1. |
os reboot failure |
The system may not be able to operate properly. |
o |
o |
o |
o |
||||
rm |
Error |
1524 |
The group of monitor %1 is unknown. |
unknown group |
Check the cluster configuration data. |
o |
o |
o |
o |
||||
rm |
Warning |
1525 |
No action is taken because %1 is not online. |
not perform failure action |
- |
o |
o |
o |
o |
||||
rm |
Information |
1526 |
Status of monitor %1 was returned to normal. |
status changed into normal |
- |
o |
o |
o |
|||||
rm |
Information |
1527 |
Status of monitor %1 was changed into unknown. |
status changed into unknown |
The system may not be able to operate properly. |
o |
o |
o |
|||||
rm |
Error |
1528 |
Initialization error has occurred (%1 : %2) |
process initialize error |
The system may not be able to operate properly. |
o |
o |
o |
o |
||||
rm |
Information |
1529 |
Monitor %1 was suspended. |
suspend (single monitor) |
- |
o |
o |
o |
|||||
rm |
Information |
1530 |
Monitor %1 was resumed. |
resume (single monitor) |
- |
o |
o |
o |
|||||
rm |
Information |
1531 |
All monitors were suspended. |
suspend (all monitors) |
- |
o |
o |
o |
|||||
rm |
Information |
1532 |
All monitors were resumed. |
resume (all monitors) |
- |
o |
o |
o |
|||||
rm |
Information |
1533 |
The polling interval of monitor %1 was changed into %2*%3. |
change polling interval (single monitor) |
- |
o |
o |
o |
|||||
rm |
Information |
1534 |
The polling interval ratio of all monitors were changed into %1. |
change polling interval (all monitors) |
- |
o |
o |
o |
|||||
rm |
Information |
1535 |
Causing intentional stop error was required because an error is detected by %1. |
intentional panic |
- |
o |
o |
o |
|||||
rm |
Error |
1536 |
Causing intentional stop error has failed because an error is detected by %1. |
intentional panic failure |
The system may not be able to operate properly. |
o |
o |
o |
o |
||||
rm |
Warning |
1537 |
Recovery will not be executed since server is suspending. |
not recovery(server suspending) |
Monitor resource is not recovered if the server is suspended (Network Partition Unsolved). Check the cause for being suspended (Network Partition Unsolved) and recover network partition resources to the normal status. |
o |
o |
o |
o |
||||
rm |
Warning |
1538 |
No action is taken because any recovery target is not online. |
not recovery (all groups) |
- |
o |
o |
o |
|||||
rm |
Warning |
1539 |
No action is taken because the group is set for the recovery target %1 is not online. |
not recovery (group) |
- |
o |
o |
o |
|||||
rm |
Warning |
1571 |
Monitor %1 was delayed. (timeout=%2, response time=%3, rate=%4) |
monitor delayed |
Check the load on the server where monitoring delay was detected and reduce the load. Set longer timeout if the monitoring timeout is detected. |
o |
o |
o |
o |
||||
rm |
Warning |
1572 |
Monitor %1 could not perform monitoring. |
Delay in internal processing |
The system may not be able to operate properly. |
o |
o |
o |
|||||
rm |
Warning |
1600 |
Shutdown count reached the maximum number (%1). Final action of monitor %2 was ignored. |
reached OS shutdown limit |
- |
o |
o |
o |
o |
o |
o |
o |
|
rm |
Warning |
1601 |
Since there is no other normally running server, the final action (%1) for the error detection of monitor resource %2 was suppressed. |
Suppression of final action for error detection |
- |
o |
o |
o |
|||||
rm |
Information |
1700 |
Script before action(%1) upon failure in %2 monitor resource started. |
Script before final action upon monitor resource failure started. |
- |
o |
o |
o |
|||||
rm |
Information |
1701 |
Script before action(%1) upon failure in %2 monitor resource completed. |
Script before final action upon monitor resource failure completed. |
- |
o |
o |
o |
|||||
rm |
Information |
1720 |
Script before action(%1) upon failure in %2 monitor resource failed. |
Script before final action upon monitor resource failure has failed. |
- |
o |
o |
o |
|||||
rm |
Information |
1750 |
The collecting of detailed information triggered by monitoring %1 error has been started (timeout=%2). |
The collecting of detailed information has been started. |
- |
o |
o |
o |
|||||
rm |
Information |
1751 |
The collection of detailed information triggered by monitoring %1 error has been completed. |
The collection of detailed information has been completed. |
- |
o |
o |
o |
|||||
rm |
Information |
1752 |
The collection of detailed information triggered by monitoring %1 error has been failed (%2). |
The collection of detailed information has been failed. |
- |
o |
o |
o |
|||||
rm |
Information |
1800 |
The %1 service will be started by cluster system. |
start service |
- |
o |
o |
o |
|||||
rm |
Information |
1801 |
The %1 service will be started again because the service has been stopped by cluster system. (retry: %2/%3) |
start service (retry) |
- |
o |
o |
o |
|||||
rm |
Information |
1802 |
The %1 service will be resumed by cluster system. |
resume service |
- |
o |
o |
o |
|||||
rm |
Information |
1803 |
The %1 service will be resumed again because the service has been suspended by cluster system. (retry: %2/%3) |
resume service (retry) |
- |
o |
o |
o |
|||||
rm |
Information |
1804 |
The %1 service will be stopped by cluster system. |
stop service |
- |
o |
o |
o |
|||||
rm |
Information |
1805 |
The %1 service entered the running state. |
service running |
- |
o |
o |
o |
|||||
rm |
Information |
1806 |
The %1 service entered the stopped state. |
service stopped |
- |
o |
o |
o |
|||||
rm |
Warning |
1811 |
Start request of the %1 service failed. Check the service status. |
failed to start service |
Check the service status. |
o |
o |
o |
|||||
rm |
Warning |
1812 |
Resume request of the %1 service failed. Check the service status. |
failed to resume service |
Check the service status. |
o |
o |
o |
|||||
rm |
Warning |
1813 |
Stop request of the %1 service failed. Check the service status. |
failed to stop the service |
Check the service status. |
o |
o |
o |
|||||
rm |
Warning |
1816 |
The %1 service has been stopped by other than cluster system. |
service stopped (error) |
Check the cause of the service stopped. |
o |
o |
o |
|||||
rm |
Warning |
1817 |
The %1 service has been suspended by other than cluster system. |
service suspended (error) |
Check the cause of the service suspended. |
o |
o |
o |
|||||
rm |
Warning |
1819 |
Start or resume retry count for the %1 service exceeded the threshold (%2). |
start or resume retry count exceeded the threshold |
- |
o |
o |
o |
|||||
rm |
Information |
1820 |
The cluster will be stopped because there was a failure in %1 service monitoring. |
cluster stop (failure in service monitoring) |
- |
o |
o |
o |
|||||
rm |
Information |
1821 |
The system will be shut down because there was a failure in %1 service monitoring. |
system shut down (failure in service monitoring) |
- |
o |
o |
o |
|||||
rm |
Information |
1822 |
The cluster will be rebooted because there was a failure in %1 service monitoring. |
system reboot (failure in service monitoring) |
- |
o |
o |
o |
|||||
rm |
Error |
1870 |
Monitor resource %1 can not be controlled because the license is invalid. |
cannot control monitor (invalid license) |
Check if the license is registered or the license is valid. |
o |
o |
o |
|||||
rm |
Information |
1890 |
Recovery script has executed because an error was detected in monitoring %1. |
Recovery script upon monitor resource failure executed |
o |
o |
o |
||||||
rm |
Error |
1891 |
Attempted to execute recovery script due to the error detected in monitoring %1, but failed. |
failed to execute recovery script |
Check the cause of the recovery script failure and take measures. |
o |
o |
o |
|||||
rm |
Error |
1892 |
Failed to log on as a user. |
Logon as a user failed |
Check if the domain, account and password of the execution user are correctly set. |
o |
o |
o |
|||||
rm |
Information |
1910 |
Dummy Failure of monitor resource %1 is enabled. |
enable dummy failure |
- |
o |
o |
o |
|||||
rm |
Information |
1911 |
Dummy Failure of monitor resource %1 is disabled. |
disable dummy failure |
- |
o |
o |
o |
|||||
rm |
Information |
1912 |
Dummy Failure of all monitors will be enabled. |
enable dummy failure (all monitors) |
- |
o |
o |
o |
|||||
rm |
Information |
1913 |
Dummy Failure of all monitors will be disabled. |
disable dummy failure (all monitors) |
- |
o |
o |
o |
|||||
rm |
Warning |
1914 |
An attempt was made to enable Dummy Failure of monitor resource %1, but failed. |
failed to enable dummy failure |
- |
o |
o |
o |
|||||
rm |
Warning |
1915 |
An attempt was made to disable Dummy Failure of monitor resource %1, but failed. |
failed to disable dummy failure |
- |
o |
o |
o |
|||||
rm |
Information |
1930 |
Recovery action caused by monitor resource error is disabled. |
disable recovery action caused by monitor resource error |
- |
o |
o |
o |
|||||
rm |
Information |
1931 |
Recovery action caused by monitor resource error is enabled. |
enable recovery action caused by monitor resource error |
- |
o |
o |
o |
|||||
rm |
Warning |
1932 |
Ignored the recovery action in monitoring %1 because recovery action caused by monitor resource error is disabled. |
not recovery (recovery action caused by monitor resource error has disabled) |
- |
o |
o |
o |
|||||
rm |
Warning |
1933 |
Recovery action at timeout occurrence was disabled, so the recovery action of monitor %1 was not executed. |
disable recovery action caused by monitor resource timeout |
- |
o |
o |
o |
|||||
event |
Information |
2101 |
%1 service has been started. |
Start service |
- |
o |
|||||||
event |
Information |
2102 |
%1 service has been stopped. |
Stop service |
- |
o |
|||||||
event |
Warning |
2130 |
Timeout or other error has occurred while waiting for internal threads to stop. Detected internal error %1. |
Threads were timeout |
The system may not be able to operate properly. |
o |
o |
o |
|||||
event |
Error |
2150 |
The specified parameters are invalid. Check the cluster configuration data. |
Invalid configuration |
Check the cluster configuration data. |
o |
o |
o |
|||||
event |
Error |
2151 |
Failed to obtain the policy data. Check the data. |
Invalid configuration |
Check the policy file. |
o |
o |
o |
|||||
event |
Error |
2152 |
Failed to obtain the registry data. System may be unable to operate correctly. |
Failed to read registry |
The system may not be able to operate properly. |
o |
o |
o |
|||||
event |
Error |
2153 |
Failed to dispatch to the service manager. System may be unable to operate correctly. |
Dispatch failed |
The system may not be able to operate properly. |
o |
o |
o |
|||||
event |
Error |
2154 |
Failed to create an internal resource. System may be unable to operate correctly. |
failed to resource creation |
The system may not be able to operate properly. |
o |
o |
o |
|||||
event |
Error |
2155 |
Failed to create communication sockets. System may be unable to operate correctly. |
failed to socket creation |
The system may not be able to operate properly. |
o |
o |
o |
|||||
event |
Error |
2156 |
Failed to control the shared memory. System may be unable to operate correctly. |
failed to shared memory control |
The system may not be able to operate properly. |
o |
o |
o |
|||||
event |
Error |
2157 |
Failed to generate internal threads. System may be unable to operate correctly. |
failed to thread creation |
The system may not be able to operate properly. |
o |
o |
o |
|||||
event |
Error |
2199 |
Other internal error has occurred. System may be unable to operate correctly. |
Internal Error |
The system may not be able to operate properly. |
o |
o |
o |
|||||
trnsv |
Error |
2301 |
There was a notification from external (IP=%1), but it was denied. |
Connection limit by client IP address |
Check the client IP address from which the connection is permitted. |
o |
o |
o |
|||||
trnsv |
Information |
2310 |
There was a notification (%1) from external (IP=%2). |
Received an abnormity occurrence notification from outside |
- |
o |
o |
o |
|||||
trnsv |
Information |
2320 |
Recovery action (%1) of monitoring %2 has been executed because a notification arrived from external. |
Executed the recovery action at abnormity occurrence |
- |
o |
o |
o |
|||||
trnsv |
Information |
2321 |
Recovery action (%1) of monitoring %2 has been completed. |
Completed the recovery action at abnormity occurrence |
- |
o |
o |
o |
|||||
trnsv |
Error |
2322 |
Attempted to recovery action (%1) of monitoring %2 due to the notification from external, but failed. |
Failed to execute the recovery action at abnormity occurrence |
Make sure that the recovery action on the environment is executable. |
o |
o |
o |
|||||
trnsv |
Information |
2330 |
Action (%1) has been completed. |
The requested action completed |
- |
o |
o |
o |
|||||
trnsv |
Error |
2331 |
Attempted to execute action (%1), but it failed. |
The requested action Failed |
Make sure that the recovery action is an executable environment. |
o |
o |
o |
|||||
trnsv |
Information |
2340 |
Script before action of monitoring %1 has been executed. |
Script execution started |
- |
o |
o |
o |
|||||
trnsv |
Information |
2341 |
Script before action of monitoring %1 has been completed. |
Script execution completed |
- |
o |
o |
o |
|||||
trnsv |
Error |
2342 |
Attempted to execute script before action of monitoring %1, but it failed. |
Script execution failed |
Handle the problem after making sure the cause of script failure. |
o |
o |
o |
|||||
trnsv |
Error |
2350 |
The system will be shutdown because cluster resume was failed. |
Failed to resume the cluster daemon |
- |
o |
o |
o |
|||||
trnsv |
Error |
2351 |
An attempt to shutdown the system failed. |
Failed to shutdown the system |
The system may not be able to operate properly. |
o |
o |
o |
|||||
lankhb |
Error |
2851 |
Keep-alive timeout was detected on the server %1. |
Keep-alive timeout |
There is a server where keep-alive timeout is detected. Check the server error. |
o |
o |
o |
o |
||||
lankhb |
Error |
2852 |
STOP error was detected on the server %1. (source:%2, exit code:%3) |
STOP error |
There is a server where STOP error is detected. Remove the failure of the server. |
o |
o |
o |
o |
||||
lankhb |
Error |
2853 |
Hardware reset was detected on the server %1. (source:%2, exit code:%3) |
Hardware reset |
There is a server where hardware reset is detected. Remove the failure of the server. |
o |
o |
o |
o |
||||
ptun |
Warning |
3301 |
The parameter (%1) exceeded the threshold (%2 p.c.). Timeout value=%3(sec) Data=%4(sec) |
Delay warning |
The parameter exceeded the threshold. Set an appropriate value to the parameter. |
o |
o |
o |
o |
||||
ptun |
Warning |
3302 |
The parameter (%1) exceeded the threshold (%2 p.c.). Timeout value=%3 Data=%4 Server=%5 Resource=%6 |
Delay warning |
The parameter exceeded the threshold. Set an appropriate value to the parameter. |
o |
o |
o |
o |
||||
armcmd |
Error |
3501 |
ARMLOAD detected that the application (watchID=%2) of the group %1 has stopped. The number of failovers has reached the maximum count. Check what has caused the application to stop. |
Application stopped |
Check the cause for application to be stopped. |
o |
o |
o |
|||||
armcmd |
Error |
3502 |
ARMLOAD detected that the application (watchID=%2) of the group %1 has stopped. Script will be restarted. Check what has caused the application to stop. |
Application stopped |
Check the cause for application to be stopped. |
o |
o |
o |
|||||
armcmd |
Error |
3503 |
ARMLOAD detected that the application (watchID=%2) of the group %1 has stopped. The application will be restarted. Check what has caused the application to stop. |
Application stopped |
Check the cause for application to be stopped. |
o |
o |
o |
|||||
armcmd |
Error |
3504 |
ARMLOAD detected that the application (watchID=%2) of the group %1 has stopped. Group will be failed over. Check what has caused the application to stop. |
Application stopped |
Check the cause for application to be stopped. |
o |
o |
o |
|||||
armcmd |
Error |
3505 |
ARMLOAD detected that the application (watchID=%2) of the group %1has stopped. The server will shut down. Check what has caused the application to stop. |
Application stopped |
Check the cause for application to be stopped. |
o |
o |
o |
|||||
armcmd |
Error |
3506 |
ARMLOAD detected that the service (watchID=%2) of the group %1 has stopped. The number of failovers has reached the maximum count. Check what has caused the application to stop. |
Service stopped |
Check the cause for service to be stopped. |
o |
o |
o |
|||||
armcmd |
Error |
3507 |
ARMLOAD detected that the service (watchID=%2) of the group %1 has stopped. Script will be restarted. Check what has caused the application to stop. |
Service stopped |
Check the cause for service to be stopped. |
o |
o |
o |
|||||
armcmd |
Error |
3508 |
ARMLOAD detected that the service (watchID=%2) of the group %1 has stopped. The service will be restarted. Check what has caused the application to stop. |
Service stopped |
Check the cause for service to be stopped. |
o |
o |
o |
|||||
armcmd |
Error |
3509 |
ARMLOAD detected that the service (watchID=%2) of the group %1 has stopped. The group will be failed over. Check what has caused the application to stop. |
Service stopped |
Check the cause for service to be stopped. |
o |
o |
o |
|||||
armcmd |
Error |
3510 |
ARMLOAD detected that the service (watchID=%2) of the group %1 has stopped. The server will shut down. Check what has caused the application to stop. |
Service stopped |
Check the cause for service to be stopped. |
o |
o |
o |
|||||
armcmd |
Error |
3513 |
An error occurred in command %1. Shut down the server. |
Command error |
The system may not be able to operate properly. |
o |
o |
o |
|||||
armcmd |
Warning |
3514 |
An abnormal connection to the shared name (%1) has been detected. |
Share-name abnormally |
The shared name cannot be used. Recover the devices that correspond to the shared name. (1) OS is unstable. Check the OS status. (2) Check if the power is supplied to the appropriate devices. (3) Check if the appropriate devices and the servers are connected properly. |
o |
o |
o |
|||||
armcmd |
Information |
3515 |
Connection to the shared name (%1) has been recovered. |
Share-name recovered |
- |
o |
o |
||||||
armcmd |
Warning |
3516 |
Failed to start the application (WID=%2) of the group %1. |
Application failed |
Check the cause for failing to start the application. |
o |
o |
o |
|||||
armcmd |
Information |
3517 |
The application (WID=%2) of the group %1 has restarted. |
Application restarted |
- |
o |
o |
||||||
armcmd |
Warning |
3518 |
Failed to start the service (WID=%2) of the group %1. |
Service failed |
Check the cause for failing to start the service. |
o |
o |
o |
|||||
armcmd |
Information |
3519 |
The service (WID=%2) of the group %1 has restarted. |
Service restarted |
- |
o |
o |
||||||
armcmd |
Error |
3520 |
Failed to fail over the group %1. Check whether the server where the group can fail over exists. |
Fail over failed |
There may not be a server where the group can fail over. |
o |
o |
o |
|||||
lcns |
Information |
3551 |
The trial license is valid until %1. (Product name:%2) |
Trial version license
(normal)
|
- |
o |
o |
||||||
lcns |
Error |
3552 |
The trial license has expired in %1. (Product name:%2) |
Trial version license
(expired)
|
Register the license. |
o |
o |
o |
o |
||||
lcns |
Warning |
3553 |
The number of licenses is insufficient. The number of insufficient licenses is %1. (Product name:%2) |
Insufficient |
Register the license. |
o |
o |
o |
|||||
lcns |
Error |
3554 |
The license is not registered. (Product name:%1) |
Not registered |
Register the license. |
o |
o |
o |
o |
||||
lcns |
Error |
3555 |
The same license is registered with other servers. (Product name:%1) |
Repetition registered |
Delete the overlapping license. |
o |
o |
o |
o |
||||
lcns |
Error |
3556 |
Manufacturer or model of this server is invalid. |
Invalid manufacturer or model |
Confirm the manufacturer or model. |
o |
o |
o |
o |
||||
lcns |
Error |
3558 |
The registered license is invalid. (Product name:%1, Serial No:%2) |
The license is invalid. |
Register the valid lincense. |
o |
o |
o |
o |
||||
lcns |
Information |
3559 |
The fixed term license is effective until %1. (Product name:%2) |
Fixed term license (normal) |
- |
o |
o |
||||||
lcns |
Error |
3560 |
The fixed term license has expired in %1. (Product name:%2) |
Fixed term license (expired) |
Register the license. |
o |
o |
o |
o |
||||
logcmd |
Information |
3601 |
log command |
- |
o |
x |
x |
x |
x |
x |
x |
x |
|
diskw |
Warning |
3701 |
Monitor %1 was delayed. (timeout=%2 response time=%3 rate=%4) |
monitor delayed |
- |
o |
o |
o |
o |
||||
userw |
Warning |
3711 |
Monitor %1 was delayed. (timeout=%2 response time=%3 rate=%4) |
monitor delayed |
- |
o |
o |
o |
o |
||||
Error |
4101 |
mail failed(%1).(SMTP server: %2) |
Mail failed |
Make sure there is no error in the SMTP server and no problem communicating with the SMTP server. |
o |
o |
o |
o |
|||||
Information |
4102 |
mail succeed.(SMTP server: %1) |
Mail succeeded |
- |
o |
o |
|||||||
apisv |
Information |
4301 |
There was a request to stop cluster from the %1(IP=%2). |
Cluster stop |
- |
o |
o |
||||||
apisv |
Information |
4302 |
There was a request to shutdown cluster from the %1(IP=%2). |
Cluster shutdown |
- |
o |
o |
||||||
apisv |
Information |
4303 |
There was a request to reboot cluster from the %1(IP=%2). |
Cluster restart |
- |
o |
o |
||||||
apisv |
Information |
4304 |
There was a request to suspend cluster from the %1(IP=%2). |
Cluster suspend |
- |
o |
o |
||||||
apisv |
Information |
4310 |
There was a request to stop server from the %1(IP=%2). |
Cluster service stop |
- |
o |
o |
||||||
apisv |
Information |
4311 |
There was a request to shutdown server from the %1(IP=%2). |
Shutdown |
- |
o |
o |
||||||
apisv |
Information |
4312 |
There was a request to reboot server from the %1(IP=%2). |
Restart |
- |
o |
o |
||||||
apisv |
Information |
4330 |
There was a request to start group(%1) from the %2(IP=%3). |
Group start |
- |
o |
o |
||||||
apisv |
Information |
4331 |
There was a request to start all groups from the %1(IP=%2). |
All group start |
- |
o |
o |
||||||
apisv |
Information |
4332 |
There was a request to stop group(%1) from the %2(IP=%3). |
Group stop |
o |
o |
|||||||
apisv |
Information |
4333 |
There was a request to stop all groups from the %1(IP=%2). |
All group stop |
- |
o |
o |
||||||
apisv |
Information |
4334 |
There was a request to restart group(%1) from the %2(IP=%3). |
Group restart |
- |
o |
o |
||||||
apisv |
Information |
4335 |
There was a request to restart all groups from the %1(IP=%2). |
All group restart |
- |
o |
o |
||||||
apisv |
Information |
4336 |
There was a request to move group(%1) from the %2(IP=%3). |
Group move |
- |
o |
o |
||||||
apisv |
Information |
4337 |
There was a request to move all groups from the %1(IP=%2). |
All group move |
- |
o |
o |
||||||
apisv |
Information |
4338 |
There was a request to failover group(%1) from the %2(IP=%3). |
Group failover |
- |
o |
o |
||||||
apisv |
Information |
4339 |
There was a request to failover all groups from the %1(IP=%2). |
All group failover |
- |
o |
o |
||||||
apisv |
Information |
4340 |
There was a request to migrate group(%1) from the %2(IP=%3). |
Group migration |
- |
o |
o |
||||||
apisv |
Information |
4341 |
There was a request to migrate all groups from the %1(IP=%2). |
All group migration |
- |
o |
o |
||||||
apisv |
Information |
4342 |
There was a request to failover all groups from the %1(IP=%2). |
All group failover |
- |
o |
o |
||||||
apisv |
Information |
4343 |
There was a request to cancel waiting for the dependence destination group of group %1 was issued from the %2. |
Cancel waiting |
- |
o |
o |
||||||
apisv |
Information |
4350 |
There was a request to start resource(%1) from the %2(IP=%3). |
Resource start |
- |
o |
o |
||||||
apisv |
Information |
4351 |
There was a request to start all resources from the %1(IP=%2). |
All resource start |
- |
o |
o |
||||||
apisv |
Information |
4352 |
There was a request to stop resource(%1) from the %2(IP=%3). |
Resource stop |
- |
o |
o |
||||||
apisv |
Information |
4353 |
There was a request to stop all resources from the %1(IP=%2). |
All resource stop |
- |
o |
o |
||||||
apisv |
Information |
4354 |
There was a request to restart resource(%1) from the %2(IP=%3). |
Resource restart |
- |
o |
o |
||||||
apisv |
Information |
4355 |
There was a request to restart all resources from the %1(IP=%2). |
All resource restart |
- |
o |
o |
||||||
apisv |
Information |
4360 |
There was a request to suspend monitor resources from the %1(IP=%2). |
Monitor temporary stop |
- |
o |
o |
||||||
apisv |
Information |
4361 |
There was a request to resume monitor resources from the %1(IP=%2). |
Monitor restart |
- |
o |
o |
||||||
apisv |
Information |
4362 |
There was a request to enable Dummy Failure of monitor resource(%1) from the %2(IP=%3). |
Dummy Failure enabled |
- |
o |
o |
||||||
apisv |
Information |
4363 |
There was a request to disable Dummy Failure of monitor resource(%1) from the %2(IP=%3). |
Dummy Failure disabled |
- |
o |
o |
||||||
apisv |
Information |
4364 |
There was a request to disable Dummy Failure of all monitor resources from the %1(IP=%2). |
All Dummy Failure disabled |
- |
o |
o |
||||||
apisv |
Information |
4370 |
There was a request to set CPU frequency from the %1(IP=%2). |
CPU clock control |
- |
o |
o |
||||||
apisv |
Error |
4401 |
A request to stop cluster was failed(%1). |
Cluster stop failure |
Check the cluster status. |
o |
o |
||||||
apisv |
Error |
4402 |
A request to shutdown cluster was failed(%1). |
Cluster shutdown failure |
Check the cluster status. |
o |
o |
||||||
apisv |
Error |
4403 |
A request to reboot cluster was failed(%1). |
Cluster restart failure |
Check the cluster status. |
o |
o |
||||||
apisv |
Error |
4404 |
A request to suspend cluster was failed(%1). |
Cluster suspend failure |
Check the cluster status. |
o |
o |
||||||
apisv |
Error |
4410 |
A request to stop server was failed(%1). |
Cluster service stop failure |
Check the cluster status. |
o |
o |
||||||
apisv |
Error |
4411 |
A request to shutdown server was failed(%1). |
Server shutdown failure |
Check the server status. |
o |
o |
||||||
apisv |
Error |
4412 |
A request to reboot server was failed(%1). |
Server restart failure |
Check the server status. |
o |
o |
||||||
apisv |
Error |
4430 |
A request to start group(%1) was failed(%2). |
Group start failure |
Check the group status. |
o |
o |
||||||
apisv |
Error |
4431 |
A request to start all groups was failed(%1). |
All group start failure |
Check the group status. |
o |
o |
||||||
apisv |
Error |
4432 |
A request to stop group(%1) was failed(%2). |
Group stop failure |
Check the group status. |
o |
o |
||||||
apisv |
Error |
4433 |
A request to stop all groups was failed(%1). |
All group stop failure |
Check the group status. |
o |
o |
||||||
apisv |
Error |
4434 |
A request to restart group(%1) was failed(%2). |
Group restart failure |
Check the group status. |
o |
o |
||||||
apisv |
Error |
4435 |
A request to restart all groups was failed(%1). |
All group restart failure |
Check the group status. |
o |
o |
||||||
apisv |
Error |
4436 |
A request to move group(%1) was failed(%2). |
Group move failure |
Check the group status. |
o |
o |
||||||
apisv |
Error |
4437 |
A request to move all groups was failed(%1). |
All group move failure |
Check the group status. |
o |
o |
||||||
apisv |
Error |
4438 |
A request to failover group(%1) was failed(%2). |
Group failover failure |
Check the group status. |
o |
o |
||||||
apisv |
Error |
4439 |
A request to failover all groups was failed(%1). |
All group failover failure |
Check the group status. |
o |
o |
||||||
apisv |
Error |
4440 |
A request to migrate group(%1) was failed(%2). |
Group migration failure |
Check the group status. |
o |
o |
||||||
apisv |
Error |
4441 |
A request to migrate all groups was failed(%1). |
All group migration failure |
Check the group status. |
o |
o |
||||||
apisv |
Error |
4442 |
A request to failover all groups was failed(%1). |
All group failover failure |
Check the group status. |
o |
o |
||||||
apisv |
Error |
4443 |
A request to cancel waiting for the dependency destination group of group %s has failed(%1). |
Cancel waiting failure |
Check the group status. |
o |
o |
||||||
apisv |
Error |
4450 |
A request to start resource(%1) was failed(%2). |
Resource start failure |
Check the resource status. |
o |
o |
||||||
apisv |
Error |
4451 |
A request to start all resources was failed(%1). |
All resource start failure |
Check the resource status. |
o |
o |
||||||
apisv |
Error |
4452 |
A request to stop resource(%1) was failed(%2). |
Resource stop failure |
Check the resource status. |
o |
o |
||||||
apisv |
Error |
4453 |
A request to stop all resources was failed(%1). |
All resource stop failure |
Check the resource status. |
o |
o |
||||||
apisv |
Error |
4454 |
A request to restart resource(%1) was failed(%2). |
Resource restart failure |
Check the resource status. |
o |
o |
||||||
apisv |
Error |
4455 |
A request to restart all resources was failed(%1). |
All resource restart failure |
Check the resource status. |
o |
o |
||||||
apisv |
Error |
4460 |
A request to suspend monitor resource was failed(%1). |
Monitor temporary stop failure |
Check the monitor resource status. |
o |
o |
||||||
apisv |
Error |
4461 |
A request to resume monitor resource was failed(%1). |
Monitor restart failure |
Check the monitor resource status. |
o |
o |
||||||
apisv |
Error |
4462 |
A request to enable Dummy Failure of monitor resource(%1) was failed(%2). |
Dummy Failure enabled |
Check the monitor resource status. |
o |
o |
||||||
apisv |
Error |
4463 |
A request to disable Dummy Failure of monitor resource(%1) was failed(%2). |
Dummy Failure disabled |
Check the monitor resource status. |
o |
o |
||||||
apisv |
Error |
4464 |
A request to disable Dummy Failure of all monitor resource was failed(%1). |
All Dummy Failure disabled |
Check the monitor resource status. |
o |
o |
||||||
apisv |
Error |
4470 |
A request to set CPU frequency was failed(%1). |
CPU clock control failure |
Check if the server handles CPU clock control. |
o |
o |
||||||
apisv |
Error |
4480 |
Initializing internal communication (%1) failed (port=%2). |
Initializing internal communication failed. |
Check if an application other than EXPRESSCLUSTER uses the port. |
o |
o |
||||||
userw |
Warning |
5001 |
Monitor %1 was delayed. (timeout=%2 response time=%3 rate=%4) |
Monitor delayed |
- |
o |
o |
o |
o |
||||
genw |
Warning |
5151 |
Since loss of the target script (%1) has been detected, it was rebooted. |
Since loss of the target script (%1) has been detected, it was rebooted |
- |
o |
o |
||||||
db2
ftp
http
imap4
odbc
oracle
otx
pop3
psql
smtp
sqlserver
tux
was
wls
|
Warning |
10001 |
%1 |
Error message for each monitored application. |
Take appropriate action for the application failure by following the error message. |
o |
x |
x |
x |
x |
x |
x |
x |
db2w
ftpw
httpw
imap4w
odbcw
oraclew
otxw
pop3w
psqlw
smtpw
sqlserverw
tuxw
wasw
wlsw
db2
ftp
http
imap4
odbc
oracle
otx
pop3
psql
smtp
sqlserver
tux
was
wls
|
Warning |
10002 |
The API Error of Windows occurred.%1 |
API error of Windows has occurred. %1 is API error code. |
Take appropriate action for the OS failure by following the error code. |
o |
x |
x |
x |
x |
x |
x |
x |
mrw |
Warning |
4901 |
Monitor %1 is in the warning status. (%2 : %3) |
Monitor warn |
Check the cause of Warning. |
o |
o |
o |
o |
||||
mrw |
Warning |
4902 |
Configuration of %1 is invalid. (%2 : %3) |
invalid monitor resource |
Check the cluster configuration data. |
o |
o |
o |
o |
||||
mrw |
Error |
4903 |
Failed to start monitor %1. |
monitor starting failed |
The system may not be able to operate properly. |
o |
o |
o |
o |
o |
o |
o |
|
mrw |
Error |
4904 |
Failed to stop monitor %1. |
monitor stopping failed |
The system may not be able to operate properly. |
o |
o |
o |
o |
||||
mrw |
Error |
4905 |
Monitor %1 detected an error. (%2 : %3) |
monitor failed |
Check the cause for monitor error. |
o |
o |
o |
o |
o |
o |
o |
|
mrw |
Information |
4906 |
Monitor resource has not been registered. |
unregistered monitor resource |
- |
o |
o |
o |
|||||
mrw |
Information |
4907 |
%1 was stopped for failure in monitor %2. |
relation stop |
- |
o |
o |
o |
|||||
mrw |
Information |
4908 |
%1 was restarted for failure in monitor %2. |
relation restart |
- |
o |
o |
o |
|||||
mrw |
Information |
4909 |
%1 was failed over for failure in monitor %2. |
relation group failover |
- |
o |
o |
o |
|||||
mrw |
Information |
4910 |
There was a request to stop cluster for failure in monitor %1. |
cluster stop |
- |
o |
o |
o |
|||||
mrw |
Information |
4911 |
There was a request to shut down the system for failure in monitor %1. |
system shutdown |
- |
o |
o |
o |
|||||
mrw |
Information |
4912 |
There was a request to restart the system for failure in monitor %1. |
system reboot |
- |
o |
o |
o |
|||||
mrw |
Information |
4913 |
Failed to stop %1 due to error detection of %2. |
relation stop failure |
Check the status of resources. |
o |
o |
o |
o |
||||
mrw |
Error |
4914 |
Failed to restart %1 due to error detection of %2. |
relation restart failure |
Check the status of resources. |
o |
o |
o |
o |
||||
mrw |
Error |
4915 |
Failed to fail over %1 due to error detection of %2. |
relation group failover failure |
Check the status of resources. |
o |
o |
o |
o |
||||
mrw |
Error |
4916 |
Failed to stop the cluster due to error detection of %1. |
cluster stop failure |
The system may not be able to operate properly. |
o |
o |
o |
o |
||||
mrw |
Error |
4917 |
Failed to shut down the system due to error detection of %1. |
os shutdown failure |
The system may not be able to operate properly. |
o |
o |
o |
o |
||||
mrw |
Error |
4918 |
Failed to restart the system due to error detection of %1. |
os reboot failure |
The system may not be able to operate properly. |
o |
o |
o |
o |
||||
mrw |
Error |
4919 |
The group of monitor %1 is unknown. |
unknown group |
Check the cluster configuration data. |
o |
o |
o |
o |
||||
mrw |
Warning |
4920 |
No action is taken because %1 is not online. |
not perform failure action |
- |
o |
o |
o |
o |
||||
mrw |
Information |
4921 |
Status of monitor %1 was returned to normal. |
status changed into normal |
- |
o |
o |
o |
|||||
mrw |
Information |
4922 |
Status of monitor %1 was changed into unknown. |
status changed into unknown |
The system may not be able to operate properly. |
o |
o |
o |
|||||
mrw |
Error |
4923 |
Initialization error has occurred (%1 : %2) |
process initialize error |
The system may not be able to operate properly. |
o |
o |
o |
o |
||||
mrw |
Information |
4924 |
Causing intentional stop error was required because an error is detected by %1. |
intentional panic |
- |
o |
o |
o |
|||||
mrw |
Error |
4925 |
Causing intentional stop error has failed because an error is detected by %1. |
intentional panic failure |
The system may not be able to operate properly. |
o |
o |
o |
o |
||||
mrw |
Warning |
4926 |
Recovery will not be executed since server is suspending. |
not recovery(server suspending) |
Monitor resource is not recovered if the server is suspended (Network Partition Unsolved). Check the cause for being suspended (Network Partition Unsolved) and recover network partition resources to the normal status. |
o |
o |
o |
o |
||||
mrw |
Warning |
4927 |
Shutdown count reached the maximum number (%1). Final action of monitor %2 was ignored. |
reached OS shutdown limit |
- |
o |
o |
o |
o |
o |
o |
o |
|
mrw |
Information |
4928 |
Script before action(%1) upon failure in %2 monitor resource started. |
Script before final action upon monitor resource failure started. |
- |
o |
o |
o |
|||||
mrw |
Information |
4929 |
Script before action(%1) upon failure in %2 monitor resource completed. |
Script before final action upon monitor resource failure completed. |
- |
o |
o |
o |
|||||
mrw |
Information |
4930 |
Script before action(%1) upon failure in %2 monitor resource failed. |
Script before final action upon monitor resource failure has failed. |
- |
o |
o |
o |
|||||
mrw |
Information |
4931 |
Recovery script has executed because an error was detected in monitoring %1. |
Recovery script upon monitor resource failure executed |
o |
o |
o |
||||||
mrw |
Error |
4932 |
Attempted to execute recovery script due to the error detected in monitoring %1, but failed. |
failed to execute recovery script |
Check the cause of the recovery script failure and take measures. |
o |
o |
o |
|||||
mrw |
Warning |
4933 |
Ignored the recovery action in monitoring %1 because recovery action caused by monitor resource error is disabled. |
not recovery (recovery action caused by monitor resource error has disabled) |
- |
o |
o |
o |
|||||
mrw |
Information |
4934 |
There was a notification (%1) from external. (detail: %2) |
An error notification from external was received. |
- |
o |
o |
o |
|||||
tuxw |
Warning |
10004 |
The API Error of Application occurred.%1 |
API error of application has occurred. %1 is API error code. |
Take appropriate action for the application failure by following the error code. |
o |
|||||||
jra |
Error |
20251 |
Internal processing has failed. (%1) |
An internal error occurred.
%1: Internal error code
|
Check if JVM monitor resource is running. If not, restart the server. |
o |
|||||||
jra |
Error |
20252 |
Startup has failed due to an error of the setting value. (%1) |
Specified setting valueis invalid.
%1: Internal error code
|
Check if the Java installation path is correct. |
o |
|||||||
sra |
Error |
20301 |
Service was terminated because reading an SG file failed. |
An error occurred in reading the setting file. |
Check the message separately issued. |
o |
|||||||
sra |
Error |
20302 |
The installation folder name could not be acquired. |
The installation folder name could not be acquired. |
Restart the cluster, or execute the suspend and resume. |
o |
|||||||
sra |
Error |
20305 |
No IModules could be loaded. |
Some files required to execute this product do not exist. So, this product failed to start. |
Install this product again. |
o |
|||||||
sra |
Error |
20306 |
An unexpected error occurred. |
An attempt was made to start this product, but failed for some reason or another. |
Restart the cluster, or execute the suspend and resume. |
o |
|||||||
sra |
Error |
20307 |
Internal error occurred. |
This product has terminated abnormally. |
See the system log message issued last. |
o |
|||||||
sra |
Error |
20308 |
An error has occurred in issuing WMI. %1(ErrorID:0x%2 class:%3)
%1: Message
%2: Error code
%3: Information that could not be acquired
|
Statistics information could not be acquired.
%1: Message
%2: Error code
%3: Information that could not be acquired
|
Restart the cluster, or execute the suspend and resume. |
o |
|||||||
sra |
Warning |
20336 |
Script is timeout. (%1 %2)
%1: Script file name
%2: Argument
|
An internal error has occurred. |
Check the load status of the server and remove the load. |
o |
|||||||
sra |
Information |
20346 |
%1 event succeeded.
%1: Event type (Boot, Shutdown, Stop, Start, or Flush)
|
The operation management command has been executed.
The executed event type %1 (boot, shutdown, stop, start, or flush) is output.
|
- |
o |
|||||||
sra |
Warning |
20347 |
%1 was smaller than %2, it changed to minimum value(%3). |
The configuration value of the monitoring is not correct.
%1:Variable name
%2:Variable name
%3:configured value
|
Check the configured value on the Cluster WebUI. |
o |
|||||||
sra |
Warning |
20348 |
%1 was too long compared with %2, it changed to %1(%3). |
The configuration value of the monitoring is not correct.
%1:Variable name
%2:Variable name
%3:configured value
|
Check the configured value on the Cluster WebUI. |
o |
|||||||
sra |
Warning |
20349 |
%1 was smaller than %2, it changed to %2 value(%3). |
The configuration value of the monitoring is not correct.
%1:Variable name
%2:Variable name
%3:configured value
|
Check the configured value on the Cluster WebUI. |
o |
|||||||
sra |
Warning |
20350 |
%1 was larger than %2, it changed to %2 value(%3). |
The configuration value of the monitoring is not correct.
%1:Variable name
%2:Variable name
%3:configured value
|
Check the configured value on the Cluster WebUI. |
o |
|||||||
sra |
Warning |
20351 |
%1 was over than Total disk size, %2. |
The configuration value of the monitoring is not correct.
%1:Variable name
%2:configured value
|
Check the configured value on the Cluster WebUI. |
o |
|||||||
sra |
Warning |
20352 |
%1 was over than Total disk size, %2. |
The configuration value of the monitoring is not correct.
%1:Variable name
%2:configured value
|
Check the configured value on the Cluster WebUI. |
o |
|||||||
sra |
Warning |
20353 |
Delete MOUNT[%1] in DiskCapacity list. |
The configuration value of the monitoring is not correct.
%1:configured value
|
Check the configured value on the Cluster WebUI. |
o |
|||||||
sra |
Warning |
20354 |
%1 was illegal value (%2). |
The configuration value of the monitoring is not correct.
%1:Variable name
%2:configured value
|
Check the configured value on the Cluster WebUI. |
o |
|||||||
sra |
Warning |
20355 |
The DriveLetter of %1 is not ready, or Drive type was not fixed.(DriveLetter = %2) |
The configuration value of the monitoring is not correct.
%1:Variable name
%2:configured value
|
Check the configured value on the Cluster WebUI. |
o |
|||||||
sra |
Error |
20358 |
A process resource error was detected. (type = cpu, pid = %1, %2) |
An error was detected in monitoring the CPU usage rate of the specific process.
%1:Process ID
%2:Process name
|
Check the possible causes of the monitoring failure. |
o |
o |
||||||
sra |
Error |
20358 |
A process resource error was detected. (type = memory leak, pid = %1, %2) |
An error was detected in monitoring the memory usage of the specific process.
%1:Process ID
%2:Process name
|
Check the possible causes of the monitoring failure. |
o |
o |
||||||
sra |
Error |
20358 |
A process resource error was detected. (type = file leak, pid = %1, %2) |
An error was detected in monitoring the number of the open files of the specific process.
%1:Process ID
%2:Process name
|
Check the possible causes of the monitoring failure. |
o |
o |
||||||
sra |
Error |
20358 |
A process resource error was detected. (type = thread leak, pid = %1, %2) |
An error was detected in monitoring the number of the threads of the specific process.
%1:Process ID
%2:Process name
|
Check the possible causes of the monitoring failure. |
o |
o |
||||||
sra |
Error |
20358 |
A process resource error was detected. (type = same name process, pid = %1, %2) |
An error was detected in monitoring a process with the same name.
%1:Process ID
%2:Process name
|
Check the possible causes of the monitoring failure. |
o |
o |
||||||
sra |
Error |
20359 |
A system resource error was detected. (type = cpu) |
An error was detected in monitoring the CPU usage rate of the system. |
Check the possible causes of the monitoring failure. |
o |
o |
||||||
sra |
Error |
20359 |
A system resource error was detected. (type = memory) |
An error was detected in monitoring the usage amount of the total memories of the system. |
Check the possible causes of the monitoring failure. |
o |
o |
||||||
sra |
Error |
20359 |
A system resource error was detected. (type = swap) |
An error was detected in monitoring the usage amount of the total virtual memories of the system. |
Check the possible causes of the monitoring failure. |
o |
o |
||||||
sra |
Error |
20360 |
A disk resource error was detected. (type = used rate, level = NOTICE, %1) |
A notice-level error was detected in monitoring the disk usage rate.
%1:Logical drive
|
Check the possible causes of the monitoring failure. |
o |
o |
||||||
sra |
Error |
20360 |
A disk resource error was detected. (type = used rate, level = WARNING, %1) |
A warning-level error was detected in monitoring the disk usage rate.
%1:Logical drive
|
Check the possible causes of the monitoring failure. |
o |
o |
||||||
sra |
Error |
20360 |
A disk resource error was detected. (type = free space, level = NOTICE, %1) |
A notice-level error was detected in monitoring the free space of disks.
%1:Logical drive
|
Check the possible causes of the monitoring failure. |
o |
o |
||||||
sra |
Error |
20360 |
A disk resource error was detected. (type = free space, level = WARNING, %1) |
A warning-level error was detected in monitoring the free space of disks.
%1:Logical drive
|
Check the possible causes of the monitoring failure. |
o |
o |
||||||
webmgr |
Warning |
5121 |
HTTPS configuration isn't correct, HTTPS mode doesn't work. Please access WebManager by HTTP mode. |
Invalid HTTPS setting |
- |
o |
o |
o |
|||||
sss |
Error |
20004 |
Failed to get the system drive letter. |
The system drive letter could not be acquired. |
The system may not be able to operate properly. |
o |
|||||||
sss |
Error |
20005 |
Failed to get the server name. |
The server name could not be acquired. |
The system may not be able to operate properly. |
o |
|||||||
sss |
Info |
20006 |
The server name has been updated. |
The server name has been updated. |
- |
o |
o |
||||||
sss |
Error |
20007 |
Failed to update the configuration file. |
The configuration file could not be updated. |
Check the configuration data. |
o |
o |
||||||
sss |
Info |
20008 |
The configuration file has been updated. |
The configuration file has been updated. |
- |
o |
|||||||
sss |
Error |
20009 |
The content of the configuration file is invalid. |
The content of the configuration file is invalid. |
Check the configuration data. |
o |
|||||||
sss |
Error |
20010 |
Failed to start %1 service. |
The %1 service could not be started. |
The system may not be able to operate properly. |
o |
o |
||||||
sss |
Info |
20012 |
%1 service has been started. |
The %1 service has been started. |
- |
o |
|||||||
sss |
Info |
20013 |
%1 service has been stopped. |
The %1 service has been stopped. |
- |
o |
|||||||
sss |
Info |
20014 |
The redundant module of the LAN board has been started. |
The redundant module of the LAN board has been started. |
Memory or OS resources may not be sufficient. Check them. |
o |
|||||||
sss |
Error |
20015 |
Failed to start the redundant module of the LAN board. |
The redundant module of the LAN board could not be started. |
- |
o |
o |
||||||
ncctl |
Error |
20101 |
An error was detected in LAN board %1. |
An error was detected in LAN board %1. |
Check whether the settings of the standby LAN board are correct. |
o |
o |
||||||
ncctl |
caution |
20102 |
Changing LAN board %1 to LAN board %2. |
LAN board %1 will now be switched to LAN board %2. |
- |
o |
o |
||||||
ncctl |
Error |
20103 |
The operation of LAN board %1 failed. |
The operation of LAN board %1 failed. |
- |
o |
o |
4.3. Driver event log messages
4.3.1. Kernel mode LAN heartbeat driver
The following events are recorded in system event log as the source "clphb".
Module Type |
Event Type |
Event ID |
Message |
Description |
Solution |
|---|---|---|---|---|---|
clphb |
Error |
3001 |
Fatal error occurred in the driver. |
Fatal error occurred in the driver. |
Kernel memory or OS resource may not be sufficient. Check with performance monitor. |
clphb |
Info |
1001 |
Signal has been set to the shutdown event due to the keep alive timeout. |
User mode is stalled. |
Kernel memory or OS resource may not be sufficient. Check with performance monitor. |
clphb |
Info |
1002 |
Signal has been set to the shutdown event due to the FILTER closing action. |
Received FILTER closing action. |
Kernel memory or OS resource may not be sufficient. Check with performance monitor. |
4.4. Detailed information in activating and deactivating group resources
The following information is displayed in the messages recorded in event logs or alert logs as detail information when the resource activation / deactivation fails.
4.4.1. Application resource
Module Type |
Type |
Return Value |
Message |
Description |
Solution |
|---|---|---|---|---|---|
appli |
Error |
5 |
The application path is invalid. |
The application path is invalid. |
Check if the application path is correct. |
appli |
Error |
7 |
Failed to start application. |
Failed to start application. |
Memory or OS resources may not be sufficient. Check them. |
appli |
Error |
8 |
Failed to stop application. |
Failed to stop application. |
Memory or OS resources may not be sufficient. Check them. |
appli |
Error |
10 |
Timeout occurred. |
Timeout occurred. |
Check if the application terminates within the timeout period. |
appli |
Error |
11 |
Failed to log on as a user. |
Failed to log on as a user. |
Check if a domain, an account and a password of the logon user are set properly. |
appli |
Error |
12 |
Returned exit code %1. |
The non-resident type application returned abnormal error code. |
Check the cause for the abnormal error code. |
appli |
Error |
Others |
Internal error occurred. |
Internal error occurred. |
Memory or OS resources may not be sufficient. Check them. |
4.4.2. Script resource
Module Type |
Type |
Return Value |
Message |
Description |
Solution |
|---|---|---|---|---|---|
script |
Error |
6 |
Failed to execute start script. |
Failed to execute start script. |
Memory or OS resources may not be sufficient. Check them. |
script |
Error |
7 |
Failed to execute stop script. |
Failed to execute stop script. |
Memory or OS resources may not be sufficient. Check them. |
script |
Error |
8 |
Returned exit code %1. |
The synchronous type script returned abnormal error code. |
Check the cause for the abnormal error code. |
script |
Error |
9 |
Timeout occurred. |
Timeout occurred. |
Check if the script terminates within the timeout period. |
script |
Error |
10 |
Failed to log on as a user. |
Logon as a user failed |
Check if the domain, account and password of the execution user are correctly set. |
script |
Error |
Others |
Internal error occurred. |
Internal error occurred. |
Memory or OS resources may not be sufficient. Check them. |
4.4.3. Service resource
Module Type |
Type |
Return Value |
Message |
Description |
Solution |
|---|---|---|---|---|---|
service |
Error |
5 |
Failed to get service control right. |
Failed to get service control right. |
Check if the service name is correct. |
service |
Error |
6 |
Failed to start service. |
Failed to start service. |
Check the status of the service. |
service |
Error |
7 |
Failed to stop service. |
Failed to stop service. |
Check the status of the service. |
service |
Error |
8 |
Service has already been running. |
Service has already been running. |
Check the status of the service. It is possible to configure settings not to make it an error when the service is already running. |
service |
Error |
10 |
Timeout occurred. |
Timeout occurred. |
Check if the service starts or stops within the timeout period. |
service |
Error |
13 |
Computer name related to service that is running is different from virtual computer name of target VCOM resource. |
Computer name related to service that is running is different from virtual computer name of target VCOM resource. |
When you set the same service to more than one service, do not set the target VCOM resource name. |
service |
Error |
Others |
Internal error occurred. |
Internal error occurred. |
Memory or OS resources may not be sufficient. Check them. |
4.4.4. Virtual machine resource
Module Type |
Type |
Return Value |
Message |
Description |
Solution |
|---|---|---|---|---|---|
vm |
Error |
5 |
Virtual Machine configuration data is invalid. |
The configuration file of the virtual machine may be invalid. |
Check if VM configuration file path is correct. |
vm |
Error |
6 |
Virtual machine has been already started. |
The virtual machine failed to start because the virtual machine has been already started. |
Check the status of the virtual machine. |
vm |
Error |
7 |
Hyper-V Virtual Machine Management service has not started yet. |
Hyper-V Virtual Machine Management has not started yet. |
Check the status of Hyper-V Virtual Machine Management service. |
vm |
Error |
8 |
Failed to start virtual machine. |
Failed to start virtual machine. |
Check the status of the virtual machine and if the configuration file is valid. |
vm |
Error |
9 |
Failed to stop virtual machine. |
Failed to stop virtual machine. |
Check the status of the virtual machine. |
vm |
Error |
10 |
Failed to save virtual machine. |
Failed to temporarily stop and export the virtual machine. |
Check if the status of the virtual machine is Running on Hyper-V manager. |
vm |
Error |
11 |
Failed to resume virtual machine. |
Failed to import and restart the virtual machine. |
Check if VM configuration file path is correct. |
vm |
Error |
13 |
Timeout occurred. |
It took much time to import, export, start or stop the virtual machine. |
Check if the timeout value is proper. |
vm |
Error |
Others |
Internal error occurred. |
Internal error occurred. |
Memory or OS resources may not be sufficient. Check them. |
4.5. Detailed information of monitor resource errors
The following information is displayed in the message recorded in event logs or alert logs as detail information when monitor resource detects an error.
4.5.1. Application monitor resource
Module Type |
Type |
Return Value |
Message |
Description |
Solution |
|---|---|---|---|---|---|
appliw |
Error |
9 |
Process did not exist. (Stop code : %1) |
Process did not exist. (The stop code is displayed only if it can be acquired.) |
Process of the monitoring target application resource was cleared due to some error. Check it. |
appliw |
Error |
11 |
Failed to log on as a user. |
Failed to log on as a user. |
Check if a domain, an account and a password of the logon user are set properly. |
appliw |
Warning |
Others |
Internal error occurred. |
Internal error occurred. |
Memory or OS resources may not be sufficient. Check them. |
4.5.2. DB2 monitor resource
Module Type |
Type |
Return Value |
Message |
Description |
Solution |
|---|---|---|---|---|---|
db2w |
Warning |
190 |
Initialization has failed[%1]. |
Initialization process has failed. It may be due to memory allocation failure.
Information on the initialization may be displayed on %1.
|
OS itself may have errors.
Restart the server or take other actions.
|
db2w |
Warning |
102 |
The configured value is not correct. |
The configured value of the monitoring is not correct. |
Check the configured value on the Cluster WebUI because they may not be correct. |
db2w |
Warning |
110 |
A function error was detected. |
A function error occurred. |
Monitor applications or OS may have errors. Check the status of the system. |
db2w |
Error |
11 |
An error was detected in accessing the monitor target. |
Accessing the database failed. |
Check configured values on the Cluster WebUI (such as a database name). If there is no error, check the database has errors. |
db2w |
Warning |
112 |
An error was detected in user authentication. |
Accessing the database failed. |
Check configured values on the Cluster WebUI (such as a user name or a password). If there is no error, check the database has errors. |
db2w |
Warning |
113 |
An application error was detected. |
A database error was detected. |
Refer to error messages for database described separately to fix errors. |
db2w |
Error |
14 |
An error was detected in executing SQL statement [%1]. |
Executing SQL statement failed.
The executed SQL statement is displayed on %1.
|
Refer to error messages for database described separately to fix errors. |
db2w |
Error |
15 |
A data error was detected. |
A value on the table of database has an error. |
Database may be corrupt. Stop the database operation and investigate it. This error may occur when more than one monitoring is performed with the same monitor table name concurrently. Check if the values set in the multi-directional environment are appropriate. |
db2w |
Warning |
140 |
No license is registered. |
The license has not been registered. |
Register the license. |
db2w |
Warning |
160 |
Failed to obtain the configuration data. |
The configured value could not be obtained. |
OS may have errors. Restart the server or take other actions. |
db2w |
Warning |
190 |
Internal error. |
Internal error occurred. |
Memory or OS resources may not be sufficient. Check them. |
4.5.3. Disk RW monitor resource
Module Type |
Type |
Return Value |
Message |
Description |
Solution |
|---|---|---|---|---|---|
diskw |
Error |
5 |
Failed to open the file. |
Failed to open the file. |
Check if the disk driver of the monitoring target disk is loaded, the disk is connected properly, the disk is powered on, or no other errors are occurred on the disk. Memory or OS resources may not be sufficient. Check them. |
diskw |
Error |
6 |
Failed to write in the file. |
Failed to write in the file. |
Check if the monitoring target disk is connected properly, the disk is powered on, or no other errors are occurred on the disk. Memory or OS resources may not be sufficient. Check them. |
diskw |
Error |
7 |
Failed to synchronize the disk of the file. |
Failed to synchronize the disk of the file. |
Check if the monitoring target disk is connected properly, the disk is powered on, or no other errors are occurred on the disk. Memory or OS resources may not be sufficient. Check them. |
diskw |
Error |
8 |
Failed to close the file. |
Failed to close the file. |
Check if the monitoring target disk is connected properly, the disk is powered on, or no other errors are occurred on the disk. Memory or OS resources may not be sufficient. Check them. |
diskw |
Error |
71 |
Timeout has occurred when opening the file. |
Timeout has occurred when opening the file. |
Check if the monitoring target disk is connected properly, the disk is powered on, or no other errors are occurred on the disk. The system may be under high load, or memory or OS resources may not be sufficient. Check them. |
diskw |
Error |
72 |
Timeout has occurred when writing in the file. |
Timeout has occurred when writing in the file. |
Check if the monitoring target disk is connected properly, the disk is powered on, or no other errors are occurred on the disk. The system may be under high load, or memory or OS resources may not be sufficient. Check them. |
diskw |
Error |
73 |
Timeout has occurred when synchronizing the disk of the file. |
Timeout has occurred when synchronizing the disk of the file. |
Check if the monitoring target disk is connected properly, the disk is powered on, or no other errors are occurred on the disk. The system may be under high load, or memory or OS resources may not be sufficient. Check them. |
diskw |
Error |
74 |
Timeout has occurred when closing the file. |
Timeout has occurred when closing the file. |
Check if the monitoring target disk is connected properly, the disk is powered on, or no other errors are occurred on the disk. The system may be under high load, or memory or OS resources may not be sufficient. Check them. |
diskw |
Warning |
100 |
Failed to add keep alive drive when initializing keep alive driver. |
Failed to add keep alive drive when initializing keep alive driver. |
Memory or OS resources may not be sufficient. Check them. |
diskw |
Warning |
101 |
There is not enough disk space. |
There is not enough disk space. |
Secure free space on the monitoring target disk. |
diskw |
Warning |
102 |
Timeout has occurred when initializing internal resources. |
Timeout has occurred when initializing internal resources. |
Memory or OS resources may not be sufficient. Check them. |
diskw |
Warning |
103 |
Timeout has occurred when other timing. |
Timeout has occurred when other timing. |
The system may be under high load, or memory or OS resources may not be sufficient. Check them. |
diskw |
Warning |
104 |
Failed to allocate memory. |
Failed to allocate memory. |
Memory or OS resources may not be sufficient. Check them. |
diskw |
Warning |
105 |
Internal error occurred. |
Internal error occurred. |
Memory or OS resources may not be sufficient. Check them. |
diskw |
Warning |
190 |
Initialization error has occurred in internal resource. |
Initialization error has occurred in internal resource. |
Memory or OS resources may not be sufficient. Check them. |
4.5.4. FTP monitor resource
Module Type |
Type |
Return Value |
Message |
Description |
Solution |
|---|---|---|---|---|---|
ftpw |
Error |
11 |
An error was detected in accessing the monitor target. |
The access to the monitor application failed. |
Check configured values on the Cluster WebUI (such as an IP address). If there is no error, check if the monitor application has errors. |
ftpw |
Error |
12 |
An error was detected in user authentication. |
The user authentication failed. |
Check configured values on the Cluster WebUI (such as a user name or a password). If there is no error, check if the monitor application has errors |
ftpw |
Warning |
110 |
A function error was detected. |
A function error occurred. |
Monitor applications or OS may have errors. Check the status of the system. |
ftpw |
Warning |
113 |
An application error was detected. |
A monitor application error was detected. |
Refer to error messages for monitor applications described separately to fix errors. |
ftpw |
Warning |
115 |
A data error was detected. |
A value of the response data has an error. |
Refer to error messages for monitor applications described separately to fix errors. |
ftpw |
Warning |
140 |
No license is registered. |
The license has not been registered. |
Register the license. |
ftpw |
Warning |
188 |
Internal error. |
Internal error occurred. |
Memory or OS resources may not be sufficient. Check them. |
ftpw |
Warning |
190 |
Initialization has failed[%1]. |
Initialization process has failed. It may be due to memory allocation failure or a failure in obtaining the configured value.
Information on the initialization may be displayed on %1.
|
The configured value of the Cluster WebUI may be incorrect. Check the value. If there is no problem with the value, OS itself may have errors. Restart the server or take other actions |
4.5.5. Custom monitor resource
Module Type |
Type |
Return Value |
Message |
Description |
Solution |
|---|---|---|---|---|---|
genw |
Error |
5 |
Failed to start script. |
Failed to start script. |
Check if the script can be executed. |
genw |
Error |
6 |
Script did not exist. |
The asynchronous type script terminated abnormally. |
Check the cause of the termination of the script. |
genw |
Error |
8 |
Returned exit code %1. |
The synchronous type script returned abnormal error code. |
Check the cause for the abnormal error code. |
genw |
Error |
9 |
Failed to log on as a user. |
Logon as a user failed |
Check if the domain, account and password of the execution user are correctly set. |
genw |
Warning |
100 |
Timeout occurred. |
The synchronous type script did not terminate within the timeout period. |
Check the cause of the delay of the script. |
genw |
Warning |
100 |
Returned exit code %1. |
The synchronous type script returned abnormal error code. |
Check the cause for the abnormal error code. |
genw |
Warning |
100
190
|
Script path is invalid. |
The configured value of the script path is not correct. |
Check the configured value on the Cluster WebUI. |
genw |
Warning |
100
190
|
Internal error occurred. |
Internal error occurred. |
Memory or OS resources may not be sufficient. Check them. |
genw |
Warning |
190 |
Parameter is invalid. |
The configured value of the monitoring is not correct. |
Check the configured value on the Cluster WebUI. |
genw |
Warning |
190 |
Resource does not exist in cluster configuration data. |
The cluster configuration data is not correct. |
Check the cluster configuration data on the Cluster WebUI. |
genw |
Warning |
190 |
Failed to get the value from cluster configuration data. |
The cluster configuration data is not correct. |
Check the cluster configuration data on the Cluster WebUI. |
genw |
Warning |
190 |
Script did not exist. |
The asynchronous type script terminated abnormally. |
Check the cause of the termination of the script. |
genw |
Error |
200 |
Failed to start script. |
Failed to start script. |
Check if the script can be executed. |
4.5.6. HTTP monitor resource
Module Type |
Type |
Return Value |
Message |
Description |
Solution |
|---|---|---|---|---|---|
httpw |
Error |
11 |
An error was detected in accessing the monitor target. |
The access to the monitor application failed. |
Check configured values on the Cluster WebUI (such as an IP address). If there is no error, check if the monitor application has errors. |
httpw |
Warning |
110 |
A function error was detected. |
A function error occurred. |
Monitor applications or OS may have errors. Check the status of the system. |
httpw |
Warning |
113 |
An application error was detected. |
A monitor application error was detected. |
Refer to error messages for monitor applications described separately to fix errors. |
httpw |
Warning |
115 |
A data error was detected. |
A value of the response data has an error. |
Refer to error messages for monitor applications described separately to fix errors. |
httpw |
Warning |
140 |
No license is registered. |
The license has not been registered. |
Register the license. |
httpw |
Warning |
188 |
Internal error. |
Internal error occurred. |
Memory or OS resources may not be sufficient. Check them. |
httpw |
Warning |
190 |
Initialization has failed[%1]. |
Initialization process has failed. It may be due to memory allocation failure or a failure in obtaining the configured value.
Information on the initialization may be displayed on %1.
|
The configured value of the Cluster WebUI may be incorrect. Check the value. If there is no problem with the value, OS itself may have errors. Restart the server or take other actions. |
4.5.7. IMAP4 monitor resource
Module Type |
Type |
Return Value |
Message |
Description |
Solution |
|---|---|---|---|---|---|
imap4w |
Error |
11 |
An error was detected in accessing the monitor target. |
The access to the monitor application failed. |
Check configured values on the Cluster WebUI (such as an IP address). If there is no error, check if the monitor application has errors. |
imap4w |
Error |
12 |
An error was detected in user authentication. |
The access to the monitor application failed. |
Check configured values on the Cluster WebUI (such as a user name or a password). If there is no error, check if the monitor application has errors. |
imap4w |
Warning |
110 |
A function error was detected. |
A function error occurred. |
Monitor applications or OS may have errors. Check the status of the system. |
imap4w |
Warning |
113 |
An application error was detected. |
A monitor application error was detected. |
Refer to error messages for monitor applications described separately to fix errors. |
imap4w |
Warning |
115 |
A data error was detected. |
A value of the response data has an error. |
Refer to error messages for monitor applications described separately to fix errors. |
imap4w |
Warning |
140 |
No license is registered. |
The license has not been registered. |
Register the license. |
imap4w |
Warning |
188 |
Internal error. |
Internal error occurred. |
Memory or OS resources may not be sufficient. Check them. |
imap4w |
Warning |
190 |
Initialization has failed[%1]. |
Initialization process has failed. It may be due to memory allocation failure or a failure in obtaining the configured value.
Information on the initialization may be displayed on %1.
|
The configured value of the Cluster WebUI may be incorrect. Check the value. If there is no problem with the value, OS itself may have errors. Restart the server or take other actions |
4.5.8. IP monitor resource
Module Type |
Type |
Return Value |
Message |
Description |
Solution |
|---|---|---|---|---|---|
ipw |
Error |
4 |
Ping could not reach. |
Ping could not reach. |
Check if the ping command to the corresponding IP address succeeds. When the command fails, check the status of the device that has the IP address and the network interface. |
ipw |
Warning |
105 |
Timeout occurred. |
Timeout occurred. |
Memory or OS resources may not be sufficient. Check them. |
ipw |
Warning |
189 |
Internal error occurred. |
Internal error occurred. |
Memory or OS resources may not be sufficient. Check them. |
4.5.9. NIC Link Up/Down monitor resource
Module Type |
Type |
Return Value |
Message |
Description |
Solution |
|---|---|---|---|---|---|
miiw |
Error |
4 |
IP address does not exist. |
IP address does not exist. |
NIC may have been disabled. Check if the IP address of the specified NIC exists by the ipconfig command. |
miiw |
Error |
8 |
Detected NIC Link Down. |
Detected NIC Link Down. |
Check if the LAN cable is connected properly. |
miiw |
Warning |
105 |
Failed to get the IP address list. |
Failed to get the IP address list. |
Memory or OS resources may not be sufficient. Check them. |
miiw |
Warning |
106 |
Failed to get the NIC interface name. |
Failed to get the NIC interface name. |
Memory or OS resources may not be sufficient. Check them. |
miiw |
Warning |
107 |
Failed to get the NIC status. |
Failed to get the NIC status. |
Check if the NIC device is supported by the device I/O controller. |
miiw |
Warning |
189 |
An internal error has occurred. |
An internal error has occurred. |
Memory or OS resources may not be sufficient. Check them. |
4.5.10. Multi target monitor resource
Module Type |
Type |
Return Value |
Message |
Description |
Solution |
|---|---|---|---|---|---|
mtw |
Error |
Other |
Internal error occurred.(status:%1!d!) |
Internal error occurred.(status:%1!d!) |
Memory or OS resources may not be sufficient. Check them. |
mtw |
Error |
5 |
Status of resources is abnormal. |
Status of resources is abnormal. |
Check the status of the monitor resources listed on the monitor resources list. |
mtw |
Error |
1 |
This option is invalid. |
This option is invalid. |
Memory or OS resources may not be sufficient. Check them. |
4.5.11. Process name monitor resource
Module Type |
Type |
Return Value |
Message |
Description |
Solution |
|---|---|---|---|---|---|
psw |
Error |
4 |
Process [%1, pid=%2] down. |
Loss of the process to be monitored has been detected. |
Check whether the process to be monitored is running properly. |
psw |
Error |
5 |
The number of processes is less than the specified minimum process count. %1/%2 (%3) |
The number of running processes to be monitored does not reach the specified lower limit. |
Check whether the process to be monitored is running properly. |
psw |
Warning |
100 |
Internal error occurred. |
An internal error has occurred. |
Check the following possible causes: memory shortage or OS resource insufficiency. Check it. |
psw |
Warning |
190 |
Parameter is invalid. |
The monitor setting value is incorrect. |
The setting value for the Cluster WebUI may be incorrect. Check it. |
4.5.12. ODBC monitor resource
Module Type |
Type |
Return Value |
Message |
Description |
Solution |
|---|---|---|---|---|---|
odbcw |
Warning |
190 |
Initialization has failed[%1]. |
Initialization process has failed. It may be due to memory allocation failure.
Information on the initialization may be displayed on %1.
|
OS itself may have errors. Restart the server or take other actions. |
odbcw |
Warning |
102 |
The configured value is not correct. |
The configured value of the monitoring is not correct. |
Check the configured value on the Cluster WebUI because it may not be correct. |
odbcw |
Warning |
110 |
A function error was detected. |
A function error occurred. |
Monitor applications or OS may have errors. Check the status of the system. |
odbcw |
Error |
11 |
An error was detected in accessing the monitor target. |
The access to the database failed. |
Check configured values on the Cluster WebUI (such as a database name). If there is no error, check the database has errors. |
odbcw |
Warning |
112 |
An error was detected in user authentication. |
The access to the database failed. |
Check configured values on the Cluster WebUI (such as a user name or a password). If there is no error, check if the database has errors. |
odbcw |
Warning |
113 |
An application error was detected. |
The database error was detected. |
Refer to error messages for database described separately to fix errors. |
odbcw |
Error |
14 |
An error was detected in executing SQL statement [%1]. |
Executing SQL statement failed.
The executed SQL statement is displayed on %1.
|
Refer to error messages for database described separately to fix errors. |
odbcw |
Error |
15 |
A data error was detected. |
A value on the table of database has an error. |
Database may be corrupt. Stop the database operation and investigate it. This error may occur when more than one monitoring is performed with the same monitor table name concurrently. Check if the values set in the multi-directional environment are appropriate. |
odbcw |
Warning |
140 |
No license is registered. |
The license has not been registered. |
Register the license. |
odbcw |
Warning |
160 |
Failed to obtain the configuration data. |
The configured value could not be obtained. |
OS may have errors. Restart the server or take other actions |
odbcw |
Warning |
190 |
Internal error. |
Internal error occurred. |
Memory or OS resources may not be sufficient. Check them. |
4.5.13. Oracle monitor resource
Module Type |
Type |
Return Value |
Message |
Description |
Solution |
|---|---|---|---|---|---|
oraclew |
Warning |
190 |
Initialization has failed[%1]. |
Initialization process has failed. It may be due to memory allocation failure.
Information on the initialization may be displayed on %1.
|
OS itself may have errors. Restart the server or take other actions |
oraclew |
Warning |
102 |
The configured value is not correct. |
The configured value of the monitoring is not correct. |
Check the configured value on the Cluster WebUI because it may not be correct. |
oraclew |
Warning |
110 |
A function error was detected. |
A function error occurred. |
Monitor applications or OS may have errors. Check the status of the system. |
oraclew |
Error |
11 |
An error was detected in accessing the monitor target. |
The access to the database failed. |
Check configured values on the Cluster WebUI (such as a database name). If there is no error, check the database has errors. |
oraclew |
Warning |
112 |
An error was detected in user authentication. |
The access to the database failed. |
Check configured values on the Cluster WebUI (such as a user name or a password). If there is no error, check if the database has errors. |
oraclew |
Warning |
113 |
An application error was detected. |
The database error was detected. |
Refer to error messages for database described separately to fix errors. |
oraclew |
Error |
14 |
An error was detected in executing SQL statement [%1]. |
Executing SQL statement failed.
The executed SQL statement is displayed on %1.
|
Refer to error messages for database described separately to fix errors. |
oraclew |
Error |
15 |
A data error was detected. |
A value on the table of database has an error. |
Database may be corrupt. Stop the database operation and investigate it. This error may occur when more than one monitoring is performed with the same monitor table name concurrently. Check if the values set in the multi-directional environment are appropriate. |
oraclew |
Warning |
140 |
No license is registered. |
The license has not been registered. |
Register the license. |
oraclew |
Warning |
160 |
Failed to obtain the configuration data. |
The configured value could not be obtained. |
OS may have errors. Restart the server or take other actions. |
oraclew |
Warning |
190 |
Internal error. |
Internal error occurred. |
Memory or OS resources may not be sufficient. Check them. |
4.5.14. POP3 monitor resource
Module Type |
Type |
Return Value |
Message |
Description |
Solution |
|---|---|---|---|---|---|
pop3w |
Error |
11 |
An error was detected in accessing the monitor target. |
The access to the monitor application failed. |
Check configured values on the Cluster WebUI (such as an IP address). If there is no error, check if the monitor application has errors. |
pop3w |
Error |
12 |
An error was detected in user authentication. |
The access to the monitor application failed. |
Check configured values on the Cluster WebUI (such as a user name or a password). If there is no error, check if the monitor application has errors. |
pop3w |
Warning |
110 |
A function error was detected. |
A function error occurred. |
Monitor applications or OS may have errors. Check the status of the system. |
pop3w |
Warning |
113 |
An application error was detected. |
The monitor application error was detected. |
Refer to error messages for monitor applications described separately to fix errors. |
pop3w |
Warning |
115 |
A data error was detected. |
A value of the response data has an error. |
Refer to error messages for monitor applications described separately to fix errors. |
pop3w |
Warning |
140 |
No license is registered. |
The license has not been registered. |
Register the license. |
pop3w |
Warning |
188 |
Internal error. |
Internal error occurred. |
Memory or OS resources may not be sufficient. Check them. |
pop3w |
Warning |
190 |
Initialization has failed[%1]. |
Initialization process has failed. It may be due to memory allocation failure or a failure in obtaining the configured value.
Information on the initialization may be displayed on %1.
|
The configured value of the Cluster WebUI may be incorrect. Check the value. If there is no problem with the value, OS itself may have errors. Restart the server or take other actions. |
4.5.15. PostgreSQL monitor resource
Module Type |
Type |
Return Value |
Message |
Description |
Solution |
|---|---|---|---|---|---|
psqlw |
Warning |
190 |
Initialization has failed[%1]. |
Initialization process has failed. It may be due to memory allocation failure.
Information on the initialization may be displayed on %1.
|
OS itself may have errors. Restart the server or take other actions. |
psqlw |
Warning |
102 |
The configured value is not correct. |
The configured value of the monitoring is not correct. |
Check the configured value on the Cluster WebUI because it may not be correct. |
psqlw |
Warning |
110 |
A function error was detected. |
A function error occurred. |
Monitor applications or OS may have errors. Check the status of the system. |
psqlw |
Error |
11 |
An error was detected in accessing the monitor target. |
The access to the database failed. |
Check configured values on the Cluster WebUI (such as a database name). If there is no error, check the database has errors. |
psqlw |
Warning |
112 |
An error was detected in user authentication. |
The access to the database failed. |
Check configured values on the Cluster WebUI (such as a user name or a password). If there is no error, check if the database has errors. |
psqlw |
Warning |
113 |
An application error was detected. |
The database error was detected. |
Refer to error messages for database described separately to fix errors. |
psqlw |
Error |
14 |
An error was detected in executing SQL statement [%1]. |
Executing SQL statement failed.
The executed SQL statement is displayed on %1.
|
Refer to error messages for database described separately to fix errors. |
psqlw |
Error |
15 |
A data error was detected. |
A value on the table of database has an error. |
Database may be corrupt. Stop the database operation and investigate it. This error may occur when more than one monitoring is performed with the same monitor table name concurrently. Check if the values set in the multi-directional environment are appropriate. |
psqlw |
Warning |
140 |
No license is registered. |
The license has not been registered. |
Register the license. |
psqlw |
Warning |
160 |
Failed to obtain the configuration data. |
The configured value could not be obtained. |
OS may have errors. Restart the server or take other actions. |
psqlw |
Warning |
190 |
Internal error. |
Internal error occurred. |
Memory or OS resources may not be sufficient. Check them. |
4.5.16. Service monitor resource
Module Type |
Type |
Return Value |
Message |
Description |
Solution |
|---|---|---|---|---|---|
servicew |
Error |
9 |
Service has been stopped. |
Service has been stopped. |
Check the status of the service. |
servicew |
Warning |
100 |
Failed to obtain the service control right. |
Failed to obtain the service control right. |
Check if the service name is correct. |
servicew |
Warning |
Others |
An internal error has occurred. |
An internal error has occurred. |
Memory or OS resources may not be sufficient. Check them. |
4.5.17. SMTP monitor resource
Module Type |
Type |
Return Value |
Message |
Description |
Solution |
|---|---|---|---|---|---|
smtpw |
Error |
11 |
An error was detected in accessing the monitor target. |
The access to the monitor application failed. |
Check configured values on the Cluster WebUI (such as an IP address). If there is no error, check if the monitor application has errors. |
smtpw |
Error |
12 |
An error was detected in user authentication. |
The access to the monitor application failed. |
Check configured values on the Cluster WebUI (such as a user name or a password). If there is no error, check if the monitor application has errors. |
smtpw |
Warning |
110 |
A function error was detected. |
A function error occurred. |
Monitor applications or OS may have errors. Check the status of the system. |
smtpw |
Warning |
113 |
An application error was detected. |
The monitor application error was detected. |
Refer to error messages for monitor applications described separately to fix errors. |
smtpw |
Warning |
115 |
A data error was detected. |
A value of the response data has an error. |
Refer to error messages for monitor applications described separately to fix errors. |
smtpw |
Warning |
140 |
No license is registered. |
The license has not been registered. |
Register the license. |
smtpw |
Warning |
188 |
Internal error. |
Internal error occurred. |
Memory or OS resources may not be sufficient. Check them. |
smtpw |
Warning |
190 |
Initialization has failed[%1]. |
Initialization process has failed. It may be due to memory allocation failure or a failure in obtaining the configured value.
Information on the initialization may be displayed on %1.
|
The configured value of the Cluster WebUI may be incorrect. Check the value. If there is no problem with the value, OS itself may have errors. Restart the server or take other actions. |
4.5.18. SQL Server monitor resource
Module Type |
Type |
Return Value |
Message |
Description |
Solution |
|---|---|---|---|---|---|
sqlserverw |
Warning |
190 |
Initialization has failed[%1]. |
Initialization process has failed. It may be due to memory allocation failure.
Information on the initialization may be displayed on %1.
|
OS itself may have errors. Restart the server or take other actions. |
sqlserverw |
Warning |
102 |
The configured value is not correct. |
The configured value of the monitoring is not correct. |
Check the configured value on the Cluster WebUI because it may not be correct. |
sqlserverw |
Warning |
110 |
A function error was detected. |
A function error occurred. |
Monitor applications or OS may have errors. Check the status of the system. |
sqlserverw |
Error |
11 |
An error was detected in accessing the monitor target. |
The access to the database failed. |
Check configured values on the Cluster WebUI (such as a database name). If there is no error, check the database has errors. |
sqlserverw |
Warning |
112 |
An error was detected in user authentication. |
The access to the database failed. |
Check configured values on the Cluster WebUI (such as a user name or a password). If there is no error, check if the database has errors. |
sqlserverw |
Warning |
113 |
An application error was detected. |
The database error was detected. |
Refer to error messages for database described separately to fix errors. |
sqlserverw |
Error |
14 |
An error was detected in executing SQL statement [%1]. |
Executing SQL statement failed.
The executed SQL statement is displayed on %1.
|
Refer to error messages for database described separately to fix errors. |
sqlserverw |
Error |
15 |
A data error was detected. |
A value on the table of database has an error. |
Database may be corrupt. Stop the database operation and investigate it. This error may occur when more than one monitoring is performed with the same monitor table name concurrently. Check if the values set in the multi-directional environment are appropriate. |
sqlserverw |
Warning |
140 |
No license is registered. |
The license has not been registered. |
Register the license. |
sqlserverw |
Warning |
160 |
Failed to obtain the configuration data. |
The configured value could not be obtained. |
OS may have errors. Restart the server or take other actions. |
sqlserverw |
Warning |
190 |
Internal error. |
Internal error occurred. |
Memory or OS resources may not be sufficient. Check them. |
4.5.19. Tuxedo monitor resource
Module Type |
Type |
Return Value |
Message |
Description |
Solution |
|---|---|---|---|---|---|
tuxw |
Error |
11 |
An error was detected in accessing the monitor target. |
The access to the monitor application failed. |
Check configured values on the Cluster WebUI (such as an application config file). If there is no error, check if the monitor application has errors. |
tuxw |
Warning |
110 |
A function error was detected. |
A function error occurred. |
Monitor applications or OS may have errors. Check the status of the system. |
tuxw |
Warning |
113 |
An application error was detected. |
The monitor application error was detected. |
Refer to error messages for monitor applications described separately to fix errors. |
tuxw |
Warning |
140 |
No license is registered. |
The license has not been registered. |
Register the license. |
tuxw |
Warning |
188 |
Internal error. |
Internal error occurred. |
Memory or OS resources may not be sufficient. Check them. |
tuxw |
Warning |
190 |
Initialization has failed[%1]. |
Initialization process has failed. It may be due to memory allocation failure or a failure in obtaining the configured value.
Information on the initialization may be displayed on %1.
|
The configured value of the Cluster WebUI may be incorrect. Check the value. If there is no problem with the value, OS itself may have errors. Restart the server or take other actions. |
4.5.20. VM monitor resource
Module Type |
Type |
Return Value |
Message |
Description |
Solution |
|---|---|---|---|---|---|
vmw |
Error |
12 |
Virtual machine is unnormal [%1] |
The status of the virtual machine is other than Running. |
Check the status of the virtual machine on Hyper-V manager. |
vmw |
Error |
Others |
Internal error occurred. |
Internal error occurred. |
Memory or OS resources may not be sufficient. Check them. |
4.5.21. WebSphere monitor resource
Module Type |
Type |
Return Value |
Message |
Description |
Solution |
|---|---|---|---|---|---|
wasw |
Error |
12 |
An error was detected in user authentication. |
The access to the monitor application failed. |
Check configured values on the Cluster WebUI (such as a user name or a password). If there is no error, check if the monitor application has errors. |
wasw |
Warning |
110 |
A function error was detected. |
A function error occurred. |
Monitor applications or OS may have errors. Check the status of the system. |
wasw |
Warning |
113 |
An application error was detected. |
The monitor application error was detected. |
Refer to error messages for monitor applications described separately to fix errors. |
wasw |
Warning |
140 |
No license is registered. |
The license has not been registered. |
Register the license. |
wasw |
Warning |
188 |
Internal error. |
Internal error occurred. |
Memory or OS resources may not be sufficient. Check them. |
wasw |
Warning |
190 |
Initialization has failed[%1]. |
Initialization process has failed. It may be due to memory allocation failure or a failure in obtaining the configured value.
Information on the initialization may be displayed on %1.
|
The configured value of the Cluster WebUI may be incorrect. Check the value. If there is no problem with the value, OS itself may have errors. Restart the server or take other actions. |
4.5.22. WebLogic monitor resource
Module Type |
Type |
Return Value |
Message |
Description |
Solution |
|---|---|---|---|---|---|
wlsw |
Error |
11 |
An error was detected in accessing the monitor target. |
The access to the monitor application failed. |
Check configured values on the Cluster WebUI (such as an IP address). If there is no error, check if the monitor application has errors. |
wlsw |
Error |
12 |
An error was detected in user authentication. |
The access to the monitor application failed. |
Check configured values on the Cluster WebUI (such as a user name or a password). If there is no error, check if the monitor application has errors. |
wlsw |
Warning |
110 |
A function error was detected. |
A function error occurred. |
Monitor applications or OS may have errors. Check the status of the system. |
wlsw |
Warning |
113 |
An application error was detected. |
The monitor application error was detected. |
Refer to error messages for monitor applications described separately to fix errors. |
wlsw |
Warning |
140 |
No license is registered. |
The license has not been registered. |
Register the license. |
wlsw |
Warning |
188 |
Internal error. |
Internal error occurred. |
Memory or OS resources may not be sufficient. Check them. |
wlsw |
Warning |
190 |
Initialization has failed[%1]. |
Initialization process has failed. It may be due to memory allocation failure or a failure in obtaining the configured value.
Information on the initialization may be displayed on %1.
|
The configured value of the Cluster WebUI may be incorrect. Check the value. If there is no problem with the value, OS itself may have errors. Restart the server or take other actions. |
4.5.23. WebOTX monitor resource
Module Type |
Type |
Return Value |
Message |
Description |
Solution |
|---|---|---|---|---|---|
otxw |
Error |
11 |
An error was detected in accessing the monitor target. |
The access to the monitor application failed. |
Check configured values on the Cluster WebUI (such as an IP address or an application server name). If there is no error, check if the monitor application has errors. |
otxw |
Error |
12 |
An error was detected in user authentication. |
The access to the monitor application failed. |
Check configured values on the Cluster WebUI (such as a user name or a password). If there is no error, check if the monitor application has errors. |
otxw |
Warning |
110 |
A function error was detected. |
A function error occurred. |
Monitor applications or OS may have errors. Check the status of the system. |
otxw |
Warning |
113 |
An application error was detected. |
The monitor application error was detected. |
Refer to error messages for monitor applications described separately to fix errors. |
otxw |
Warning |
140 |
No license is registered. |
The license has not been registered. |
Register the license. |
otxw |
Warning |
188 |
Internal error. |
Internal error occurred. |
Memory or OS resources may not be sufficient. Check them. |
otxw |
Warning |
190 |
Initialization has failed[%1]. |
Initialization process has failed. It may be due to memory allocation failure or a failure in obtaining the configured value.
Information on the initialization may be displayed on %1.
|
The configured value of the Cluster WebUI may be incorrect. Check the value. If there is no problem with the value, OS itself may have errors. Restart the server or take other actions. |
4.5.24. JVM monitor resource
Module Type |
Type |
Return Value |
Message |
Description |
Solution |
|---|---|---|---|---|---|
jraw |
Error |
11 |
An error was detected in accessing the monitor target. |
Connection to the target to be monitored has failed. |
Check that the Java VM to be monitored is running. |
jraw |
Error |
12 |
%1 to be monitored has become abnormal.
%1:Error generation cause
|
An error in the target to be monitored has been detected. |
Based on the message, check the Java application that is running on Java VM to be monitored. |
jraw |
Warning |
192 |
Internal error occurred. |
An internal error has occurred. |
Execute cluster suspend and cluster resume. |
4.5.25. System monitor resource
Module Type |
Type |
Return Value |
Message |
Description |
Solution |
|---|---|---|---|---|---|
sraw |
Error |
11 |
Monitor sraw has detected an error. (11: Detected an error in monitoring system resource.) |
An error was detected when monitoring system resources. |
There may be an error with the resources. |
4.5.26. Process resource monitor resource
Module Type |
Type |
Return Value |
Message |
Description |
Solution |
|---|---|---|---|---|---|
psrw |
Error |
11 |
Monitor psrw has detected an error. (11: Detected an error in monitoring process resource.) |
An error was detected when monitoring process resources. |
There may be an error with the resources. Check them. |
4.5.27. User space monitoring resource
Module Type |
Type |
Return Value |
Message |
Description |
Solution |
|---|---|---|---|---|---|
userw |
Error |
71 |
Timeout has occurred when creating dummy thread. |
Timeout has occurred when creating dummy thread. |
The system may be under high load, or memory or OS resources may not be sufficient. Check them. |
userw |
Warning |
100 |
A timeout occurred when initializing internal resources. |
A timeout occurred when initializing internal resources. |
Memory or OS resources may not be sufficient. Check them. |
userw |
Warning |
101 |
Timeout has occurred when closing dummy thread handle. |
Timeout has occurred when closing dummy thread handle. |
The system may be under high load, or memory or OS resources may not be sufficient. Check them. |
userw |
Warning |
102 |
Timeout has occurred when other timing. |
Timeout has occurred when other timing. |
The system may be under high load, or memory or OS resources may not be sufficient. Check them. |
userw |
Warning |
190 |
An initialization error has occurred in an internal resource. |
An initialization error has occurred in an internal resource. |
Memory or OS resources may not be sufficient. Check them. |
4.6. STOP codes list of disk RW monitor resources
The following information is the STOP codes list which are generated when selecting Generating of intentional Stop Error on Action when stalling is detected of disk RW monitor resource.
STOP code |
Description |
|---|---|
0xE0000000 |
The STOP error which was generated as the Final action at detection of an error of the monitor resource at activation or deactivation failure of the group resource. |
0xE000FF** |
The STOP error which was generated by keep alive timeout (the timeout of disk RW monitor).
The lower 8 bits (the part of "**") shows the following checkpoint (The chances are high that it was being executed during timeout).
|
0xE000FF00 |
The internal processing of EXPRESSCLUSTER |
0xE000FF01 |
free(), SetWaitableTimer(), GetTickCount(), WaitForMultipleObjects() |
0xE000FF02 |
CreateFile(), _beginthreadex() |
0xE000FF03 |
malloc(), WriteFile() |
0xE000FF04 |
FlushFileBuffers() |
0xE000FF05 |
CloseHandle() |
0xE000FF06 |
The internal processing of EXPRESSCLUSTER |
4.7. JVM monitor resource log output messages
The following messages belong to the JVM operation and JVM load balancer linkage log files that are specific to the JVM monitor resources.
The file is created in the following location:
JVM operation log: <EXPRESSCLUSTER_install_path>\log\ha\jra\jragent*.log (* indicates a number starting at 0.)
JVM load balancer linkage log: <EXPRESSCLUSTER_install_path>\log\ha\jra\lbadmin.log
4.7.1. JVM operation log
Message |
Cause of generation |
Action |
|---|---|---|
Failed to write the %1.stat. |
Writing to the JVM statistics log has failed.
%1 .stat: JVM statistics log file name
|
Check whether there is sufficient free disk space. |
%1: analyze finish[%4]. state = %2, cause = %3 |
(When the status of the Java VM to be monitored is abnormal) the resource use amount has exceeded the threshold in the Java VM to be monitored.
%1: Name of the Java VM to be monitored
%2: Status of Java VM to be monitored
(1=normal, 0=abnormal)
%3: Error generation location at abnormality occurrence
%4: Measurement thread name
|
Review the Java application that runs on the Java VM to be monitored. |
thread stopped by UncaughtException. |
The thread of the JVM monitor resource has stopped. |
Execute cluster suspend/cluster resume and then restart the JVM monitor resource. |
thread wait stopped by Exception. |
The thread of the JVM monitor resource has stopped. |
Execute cluster suspend/cluster resume and then restart the JVM monitor resource. |
%1: monitor thread can't connect to JVM. |
The Java VM to be monitored could not be connected.
%1: Name of the Java VM to be monitored
|
Check that the Java VM to be monitored is running. |
%1: monitor thread can't get the JVM state. |
The resource use amount could not be acquired from Java VM to be monitored.
%1: Name of the Java VM to be monitored
|
Check that the Java VM to be monitored is running. |
%1: JVM state is changed [abnormal -> normal]. |
The status of the Java VM to be monitored has changed from abnormal to normal.
%1: Name of the Java VM to be monitored
|
- |
%1: JVM state is changed [normal -> abnormal]. |
The status of the Java VM to be monitored has changed from normal to abnormal.
%1: Name of the Java VM to be monitored
|
Review the Java application that runs on the Java VM to be monitored. |
%1: Failed to connect to JVM. |
The Java VM to be monitored could not be connected. |
Check that the Java VM to be monitored is running.
%1: Name of the Java VM to be monitored
|
Failed to write exit code. |
The JVM monitor resource failed to write data to the file for recording the exit code. |
Check whether there is sufficient free disk space. |
Failed to be started JVM Monitor. |
Starting of the JVM monitor resource has failed. |
Check the JVM operation log, remove the cause preventing the start, execute cluster suspend/cluster resume, and then restart the JVM monitor resource. |
JVM Monitor already started. |
The JVM monitor resource has already been started. |
Execute cluster suspend/cluster resume and then restart the JVM monitor resource. |
%1: GARBAGE_COLLECTOR_MXBEAN_DOMAIN_TYPE is invalid. |
GC information could not be acquired from the Java VM to be monitored.
%1: Name of the Java VM to be monitored
|
Check whether the operating environment of the Java VM to be monitored is correct. |
%1: GarbageCollectorMXBean is invalid. |
GC information could not be acquired from the Java VM to be monitored.
%1: Name of the Java VM to be monitored
|
Check whether the operating environment of the Java VM to be monitored is correct. |
%1: Failed to measure the GC stat. |
GC information could not be acquired from the Java VM to be monitored.
%1: Name of the Java VM to be monitored
|
Check whether the operating environment of the Java VM to be monitored is correct. |
%1: GC stat is invalid. last.getCount = %2, last.getTime = %3, now.getCount = %4, now.getTime = %5. |
The GC generation count and GC execution time could not be measured for the Java VM to be monitored.
%1: Name of the Java VM to be monitored
%2: GC generation count at last measurement
%3: Total GC execution time at last measurement
%4: GC generation count at this measurement
%5: Total GC execution time at this measurement
|
Check whether the operating environment of the Java VM to be monitored is correct. |
%1: GC average time is too long. av = %6, last.getCount = %2, last.getTime = %3, now.getCount = %4, now.getTime = %5. |
The average GC execution time has exceeded the threshold in the Java VM to be monitored.
%1: Name of the Java VM to be monitored
%2: GC generation count at last measurement
%3: Total GC execution time at last measurement
%4: GC generation count at this measurement
%5: Total GC execution time at this measurement
%6: Average of the GC execution time used from the last measurement to this measurement
|
Review the Java application that runs on the Java VM to be monitored. |
%1: GC average time is too long compared with the last connection. av = %6, last.getCount = %2, last.getTime = %3, now.getCount = %4, now.getTime = %5. |
After the Java VM to be monitored was reconnected, the average of the GC execution time has exceeded the threshold in the Java VM to be monitored.
%1: Name of the Java VM to be monitored
%2: GC generation count at last measurement
%3: Total GC execution time at last measurement
%4: GC generation count at this measurement
%5: Total GC execution time at this measurement
%6: Average of the GC execution time used from the last measurement to this measurement
|
Review the Java application that runs on the Java VM to be monitored. |
%1: GC count is too frequently. count = %4 last.getCount = %2, now.getCount = %3. |
The GC generation count has exceeded the threshold in the Java VM to be monitored.
%1: Name of the Java VM to be monitored
%2: GC generation count at last measurement
%3: GC generation count at this measurement
%4: GC generation count from the last measurement to this measurement
|
Review the Java application that runs on the Java VM to be monitored. |
%1: GC count is too frequently compared with the last connection. count = %4 last.getCount = %2, now.getCount = %3. |
After the Java VM to be monitored was reconnected, the GC generation count has exceeded the threshold in the Java VM to be monitored.
%1: Name of the Java VM to be monitored
%2: GC generation count at last measurement
%3: GC generation count at this measurement
%4: GC generation count from the last measurement to this measurement
|
Review the Java application that runs on the Java VM to be monitored. |
%1: RuntimeMXBean is invalid. |
Information could not be acquired from the Java VM to be monitored.
%1: Name of the Java VM to be monitored
|
Check whether the operating environment of the Java VM to be monitored is correct. |
%1: Failed to measure the runtime stat. |
Information could not be acquired from the Java VM to be monitored.
%1: Name of the Java VM to be monitored
|
Check whether the operating environment of the Java VM to be monitored is correct.
Check whether the processing load is high in the Java VM to be monitored.
|
%1: MEMORY_MXBEAN_NAME is invalid. %2, %3. |
Memory information could not be acquired from the Java VM to be monitored.
%1: Name of the Java VM to be monitored
%2: Memory pool name
%3: Memory name
|
Check whether the operating environment of the Java VM to be monitored is correct. |
%1: MemoryMXBean is invalid. |
Memory information could not be acquired from the Java VM to be monitored.
%1: Name of the Java VM to be monitored
|
Check whether the operating environment of the Java VM to be monitored is correct. |
%1: Failed to measure the memory stat. |
Memory information could not be acquired from the Java VM to be monitored.
%1: Name of the Java VM to be monitored
|
Check whether the operating environment of the Java VM to be monitored is correct.
Check whether the processing load is high in the Java VM to be monitored.
|
%1: MemoryPool name is undefined. memory_name = %2. |
Memory information could not be acquired from the Java VM to be monitored.
%1: Name of the Java VM to be monitored
%2: Name of the Java memory pool to be measured
|
Check whether the operating environment of the Java VM to be monitored is correct. |
%1: MemoryPool capacity is too little. memory_name = %2, used = %3, max = %4, ratio = %5. |
The Java memory pool free space has fallen below the threshold in the Java VM to be monitored.
%1: Name of the Java VM to be monitored
%2: Name of the Java memory pool to be measured
%3: Use amount of the Java memory pool
%4: Maximum usable amount of the Java memory pool
%5: Use rate of the Java memory pool
|
Review the Java application that runs on the Java VM to be monitored. |
%1: THREAD_MXBEAN_NAME is invalid. |
Thread information could not be acquired from the Java VM to be monitored.
%1: Name of the Java VM to be monitored
|
Check whether the operating environment of the Java VM to be monitored is correct. |
%1: ThreadMXBean is invalid. |
Thread information could not be acquired from the Java VM to be monitored. |
Check whether the operating environment of the Java VM to be monitored is correct.
%1: Name of the Java VM to be monitored
|
%1: Failed to measure the thread stat. |
Thread information could not be acquired from Java VM to be monitored.
%1: Name of the Java VM to be monitored
|
Check whether the operating environment of the Java VM to be monitored is correct. |
%1: Detect Deadlock. threads = %2. |
Thread deadlock has occurred in the Java VM to be monitored.
%1: Name of the Java VM to be monitored
%2: ID of the deadlock thread
|
Review the Java application that runs on the Java VM to be monitored. |
%1: Thread count is too much(%2). |
The number of activated threads has exceeded the threshold in the Java VM to be monitored.
%1: Name of the Java VM to be monitored
%2: Number of activated threads at measurement
|
Review the Java application that runs on the Java VM to be monitored. |
%1: ThreadInfo is null.Thread count = %2. |
Thread information could not be acquired in the Java VM to be monitored.
%1: Name of the Java VM to be monitored
%2: Number of activated threads at measurement
|
Check whether the operating environment of the version of the Java VM to be monitored is correct. |
%1: Failed to disconnect. |
Disconnection from the Java VM to be monitored has failed.
%1: Name of the Java VM to be monitored
|
- |
%1: Failed to connect to WebLogicServer. |
WebLogic Server to be monitored could not be connected.
%1: Name of the Java VM to be monitored
|
Review the Java application that runs on the WebLogic Server to be monitored. |
%1: Failed to connect to Sun JVM. |
Java VM and WebOTX to be monitored could not be connected.
%1: Name of the Java VM to be monitored
|
Review the Java application that runs on the Java VM and WebOTX to be monitored. |
Failed to open the %1. |
The JVM statistics log could not be output.
%1: Name of the HA/JVMSaverJVM statistics log file
|
Check whether the disk has sufficient free space or whether the number of open files has exceeded the upper limit. |
%1: Can't find monitor file. |
No monitoring
%1: Name of the Java VM to be monitored
|
- |
%1: Can't find monitor file, monitor stopped[thread:%2]. |
Monitoring stops.
%1: Name of the Java VM to be monitored
%2: Type of the measurement thread
|
- |
%1: Failed to create monitor status file. |
An internal file could not be created.
%1: Name of the Java VM to be monitored
|
Check whether the disk free space and the maximum number of volume files are sufficient. |
%1: Failed to delete monitor status file. |
An internal file could not be deleted.
|
Check whether there is a problem with the hard disk. |
%1: com.bea:Type=ServerRuntime is invalid. |
Information could not be acquired from the Java VM to be monitored.
%1: Name of the Java VM to be monitored
|
Check whether the operating environment of the Java VM to be monitored is correct. |
%1: WorkManagerRuntimeMBean or ThreadPoolRuntimeMBean is invalid. |
Information could not be acquired from the WebLogic Server to be monitored.
%1: Name of the Java VM to be monitored
|
Check whether the operating environment of the WebLogic Server to be monitored is correct. |
%1: Failed to measure the WorkManager or ThreadPool stat. |
Information could not be acquired from the WebLogic Server to be monitored.
%1: Name of the Java VM to be monitored
|
Check whether the operating environment of the WebLogic Server to be monitored is correct. |
%1: ThreadPool stat is invalid. last.pending = %2, now.pending = %3. |
The number of waiting requests could not be measured in the thread pool of the WebLogic Server to be monitored.
%1: Name of the Java VM to be monitored
%2: Number of waiting requests at last measurement
%3: Number of waiting requests at this measurement
|
Check whether the operating environment of the version of the WebLogic Server to be monitored is correct. |
%1: WorkManager stat is invalid. last.pending = %2, now.pending = %3. |
The number of waiting requests could not be measured in the work manager of the WebLogic Server to be monitored.
%1: Name of the Java VM to be monitored
%2: Number of waiting requests at last measurement
%3: Number of waiting requests at this measurement
|
Check whether the operating environment of the version of the WebLogic Server to be monitored is correct. |
%1: PendingRequest count is too much. count = %2. |
The number of waiting requests has exceeded the threshold in the thread pool of the WebLogic Server to be monitored.
%1: Name of the Java VM to be monitored
%2: Number of waiting requests at this measurement
|
Review the Java application that runs on the WebLogic Server to be monitored. |
%1: PendingRequest increment is too much. increment = %4, last.pending = %2, now.pending = %3. |
The increment of the number of waiting requests has exceeded the threshold in the thread pool of the WebLogic Server to be monitored.
%1: Name of the Java VM to be monitored
%2: Number of waiting requests at last measurement
%3: Number of waiting requests at this measurement
%4: Increment of the number of waiting requests from the last measurement to this measurement
|
Review the Java application that runs on the WebLogic Server to be monitored. |
%1: PendingRequest increment is too much compared with the last connection. increment = %4, last.pending = %2, now.pending = %3. |
After the WebLogic Server to be monitored was reconnected, the increment of the number of waiting requests has exceeded the threshold in the thread pool of the WebLogic Server to be monitored.
%1: Name of the Java VM to be monitored
%2: Number of waiting requests at last measurement
%3: Number of waiting requests at this measurement
%4: Increment of the number of waiting requests from the last measurement to this measurement
|
Review the Java application that runs on the WebLogic Server to be monitored. |
%1: Throughput count is too much. count = %2. |
The number of requests executed per unit time has exceeded the threshold in the thread pool of the WebLogic Server to be monitored.
%1: Name of the Java VM to be monitored
%2: Number of requests executed per unit time at this measurement
|
Review the Java application that runs on the WebLogic Server to be monitored. |
%1: Throughput increment is too much. increment = %4, last.throughput = %2, now.throughput = %3. |
The increment of the number of requests executed per unit time has exceeded the threshold in the thread pool of the WebLogic Server to be monitored.
%1: Name of the Java VM to be monitored
%2: Number of requests executed per unit time at last measurement
%3: Number of requests executed per unit time at this measurement
%4: Increment of the number of requests executed per unit time from the last measurement to this measurement
|
Review the Java application that runs on the WebLogic Server to be monitored. |
%1: Throughput increment is too much compared with the last connection. increment = %4:, last.throughput = %2, now.throughput = %3. |
After the WebLogic Server to be monitored was reconnected, the increment of the number of requests executed per unit time has exceeded the threshold in the thread pool of the WebLogic Server to be monitored.
%1: Name of the Java VM to be monitored
%2: Number of requests executed per unit time at last measurement
%3: Number of requests executed per unit time at this measurement
%4: Increment of the number of requests executed per unit time from the last measurement to this measurement
|
Review the Java application that runs on the WebLogic Server to be monitored. |
%1: PendingRequest count is too much. appName = %2, name = %3, count = %4. |
The number of waiting requests has exceeded the threshold in the work manager of the WebLogic Server to be monitored.
%1: Name of the Java VM to be monitored
%2: Application name
%3: Work manager name
%4: Number of waiting requests
|
Review the Java application that runs on the WebLogic Server to be monitored. |
%1: PendingRequest increment is too much. appName = %2, name = %3, increment = %6, last.pending = %4, now.pending = %5. |
The increment of the number of waiting requests has exceeded the threshold in the work manager of the WebLogic Server to be monitored.
%1: Name of the Java VM to be monitored
%2: Application name
%3: Work manager name
%4: Number of waiting requests at last measurement
%5: Number of waiting requests at this measurement
%6: Increment of the number of waiting requests from the last measurement to this measurement
|
Review the Java application that runs on the WebLogic Server to be monitored. |
%1: PendingRequest increment is too much compared with the last connection. AppName = %2, Name = %3, increment = %6, last.pending = %4, now.pending = %5. |
After the WebLogic Server to be monitored was reconnected, the increment of the number of waiting requests has exceeded the threshold in the work manager of the WebLogic Server to be monitored.
%1: Name of the Java VM to be monitored
%2: Application name
%3: Work manager name
%4: Number of waiting requests at last measurement
%5: Number of waiting requests at this measurement
%6: Increment of the number of waiting requests from the last measurement to this measurement
|
Review the Java application that runs on the WebLogic Server to be monitored. |
%1: Can't find WorkManager. appName = %2, name = %3. |
The work manager which was set could not be acquired from the WebLogic Server.
%1: Name of the Java VM to be monitored
%2: Application name
%3: Work manager name
|
Review the setting of Target WebLogic Work Managers. |
%1: analyze of average start[%2]. |
Analyzing of the average value has started.
%1: Name of the Java VM to be monitored
%2: Thread name
|
- |
%1: analyze of average finish[%2].state = %3. |
Analyzing of the average value has been completed.
%1: Name of the Java VM to be monitored
%2: Thread name
%3: Status of the target to be monitored
|
- |
%1: Average of PendingRequest count is too much. count = %2. |
The average of the number of waiting requests has exceeded the threshold in the thread pool of the WebLogic Server to be monitored.
%1: Name of the Java VM to be monitored
%2: Number of waiting requests at this measurement
|
Review the Java application that runs on the WebLogic Server to be monitored. |
%1: Average of Throughput count is too high. count = %2. |
The average of the number of requests executed per unit time has exceeded the threshold in the thread pool of the WebLogic Server to be monitored.
%1: Name of the Java VM to be monitored
%2: Number of requests executed per unit time at this measurement
|
Review the Java application that runs on the WebLogic Server to be monitored. |
%1: Average of PendingRequest count is too high. AppName = %2, Name = %3, count = %4. |
The average of the number of waiting requests has exceeded the threshold in the work manager of the WebLogic Server to be monitored.
%1: Name of the Java VM to be monitored
%2: Application name
%3: Work manager name
%4: Number of waiting requests at this measurement
|
Review the Java application that runs on the WebLogic Server to be monitored. |
Error: Failed to operate clpjra_bigip.[%1] |
%1: Error code |
Review the setting. |
4.7.2. JVM load balancer linkage log
Message |
Cause of generation |
Action |
|---|---|---|
lbadmin command start. |
Execution of the load balancer linkage command has started. |
- |
lbadmin command finish. |
Execution of the load balancer linkage command has been completed. |
- |
Into HealthCheck mode. |
The health check function is enabled. |
- |
Into Weight mode. |
The load calculation function of the Java VM to be monitored is valid. |
- |
The PID of lbadmin.jar is "%1". |
ID of the process relating to the load balancer linkage
%1: Process ID of lbadmin.jar
|
- |
Thread wait stopped by Exception |
Waiting for down judgment has been stopped. |
- |
Rename Command succeeded. |
Renaming of the HTML file has been successful. |
- |
Rename Command failed. |
Renaming of the HTML file has failed. |
Check the HTML file name and HTML rename destination file name. |
%1 doesn't exist. |
The rename source HTML file does not exist.
%1: HTML file name
|
Check the HTML file name. |
%1 already exists. |
The rename destination HTML file already exists.
%1: HTML rename destination file name
|
Check the HTML rename destination file name. |
Can't rename file:%1. |
Renaming of the HTML file has failed.
%1: HTML file name
|
Check the HTML rename destination file name. |
The number of retries exceeded the limit. |
The retry count for renaming the HTML file has exceeded the upper limit. |
Check the HTML rename destination file name. |
The percent of the load is "%1". |
Load calculation for the Java VM to be monitored has been successful.
%1: Load of Java VM to be monitored
|
- |
stat log (%1) doesn't exist. |
There is no JVM statistics log file.
%1: JVM statistics log file name
|
Execute cluster suspend/cluster resume and then restart the JVM monitor resource. |
stat log(%1:) cannot be opened for reading. |
The JVM statistics log file could not be opened.
%1: JVM statistics log file name
|
Execute cluster suspend/cluster resume and then restart the JVM monitor resource. |
format of stat log (%1) is wrong. |
The contents of the JVM statistics log file are invalid.
%1: Statistics log file name
|
After deleting the JVM statistics log file, execute cluster suspend/cluster resume and then restart the JVM monitor resource. |
Failed to get load of application server. |
Data for load calculation could not be acquired from the JVM statistics log file. |
Review whether the load calculation setting of the Java VM to be monitored is correct. |
Can't find lock file(%1s*.stat.lck), maybe HA/JVMSaver did not start yet. |
JVM monitoring has not yet started.
%1: Internal file name
|
Start the JVM monitor resource. |
4.8. STOP codes list of user space monitor resources
The following information is a list of the STOP codes which are generated upon the selection of Generate an intentional stop error for Action When Timeout Occurs of the user space monitor resource.
STOP code |
Description |
|---|---|
0xE0000000 |
The STOP error which was generated as the final action upon the detection of an error of the monitor resource |
0xE000FF** |
The STOP error which was generated by keep alive timeout (the timeout of user space monitor)
The lower 8 bits (the part of "**") shows the following checkpoint (The chances are high that it was being executed during timeout).
|
0xE000FF00 |
The internal processing of EXPRESSCLUSTER |
0xE000FF01 |
SetWaitableTimer(), GetTickCount(), WaitForMultipleObjects() |
0xE000FF02 |
_beginthreadex(),WaitForMultipleObjects() |
0xE000FF05 |
CloseHandle() |
0xE000FF06 |
The internal processing of EXPRESSCLUSTER |