The Configuration Guide is intended for system engineers who intend to introduce a system and system administrators who will operate and maintain the introduced system.
3.Creating configuration data: Describes how to start the Cluster WebUI / WebManager and the procedures to create the configuration data with a sample configuration.
5.Group resource details: Provides details on group resources, which are used as a unit for controlling an application by using EXPRESSCLUSTER X SingleServerSafe.
6.Monitor resource details: Provides details on monitor resources, which are used as a unit when EXPRESSCLUSTER X SingleServerSafe executes monitoring.
EXPRESSCLUSTER X SingleServerSafe, which is described in this guide, uses windows and commands common to those of the clustering software EXPRESSCLUSTER X to ensure high compatibility with EXPRESSCLUSTER X in terms of operation and other aspects. Therefore, cluster-related terms are used in parts of the guide.
The terms used in this guide are defined below.
Cluster, cluster system
A single server system using EXPRESSCLUSTER X SingleServerSafe
Cluster shutdown, reboot
Shutdown or reboot of a system using EXPRESSCLUSTER X SingleServerSafe
Cluster resource
A resource used in EXPRESSCLUSTER X SingleServerSafe
Cluster object
A resource object used in EXPRESSCLUSTER X SingleServerSafe
Failover group
A group of group resources (such as applications and services) used in EXPRESSCLUSTER X SingleServerSafe
1.4. EXPRESSCLUSTER X SingleServerSafe Documentation Set
The EXPRESSCLUSTER X SingleServerSafe documentation consists of the three guides below. The title and purpose of each guide is described below:
This guide is intended for system engineers who intend to introduce a system using EXPRESSCLUSTER X SingleServerSafe and describes how to install EXPRESSCLUSTER X SingleServerSafe.
EXPRESSCLUSTER X SingleServerSafe Configuration Guide
This guide is intended for system engineers who intend to introduce a system using EXPRESSCLUSTER X SingleServerSafe and system administrators who will operate and maintain the introduced system. It describes how to set up EXPRESSCLUSTER X SingleServerSafe.
This guide is intended for system administrators who will operate and maintain an introduced system that uses EXPRESSCLUSTER X SingleServerSafe. It describes how to operate EXPRESSCLUSTER X SingleServerSafe.
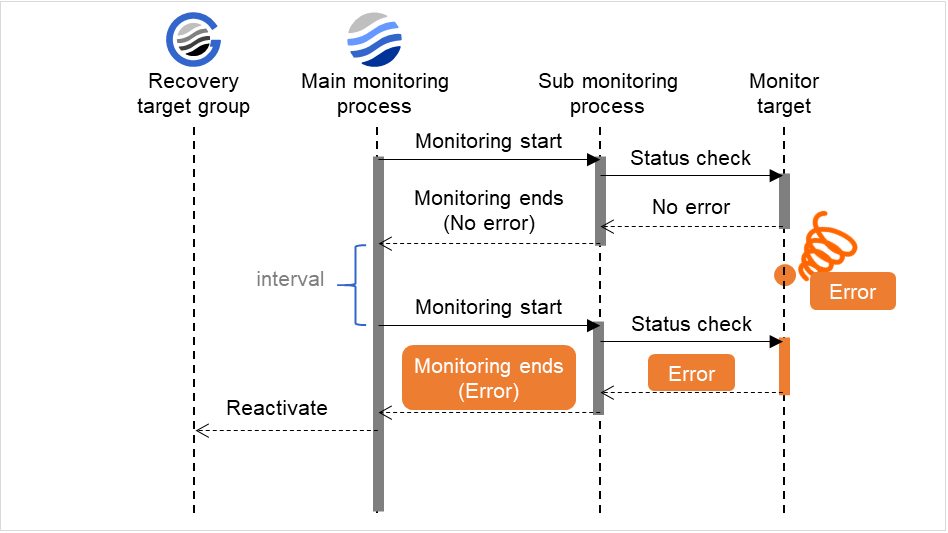
EXPRESSCLUSTER X SingleServerSafe is set up on a server. It monitors for application errors and hardware failures on the server and, upon detecting an error or failure, automatically restarts the failed application or reboots the server so as to ensure greater server availability.
With an ordinary server, if an application has ended abnormally, you need to restart it when you realize that it has ended abnormally.
There are also cases in which an application is not running stably but has not ended abnormally. Usually, such an error condition is not easy to identify.
For a hardware error, rebooting the server might achieve recovery if the error is temporary. However, hardware errors are difficult to notice. The abnormal behavior of an application often turns out to be due to a hardware error when the application is checked.
With EXPRESSCLUSTER X SingleServerSafe, specify the applications and hardware components to be monitored for automatic error detection. Upon detecting an error, EXPRESSCLUSTER X SingleServerSafe automatically restarts the application or server that caused the error to recover from the error.
Note
As indicated above, in many cases, a physical hardware failure cannot be recovered from just by rebooting the server. To protect against physical hardware failure, consider implementing hardware redundancy or introducing clustering software.
2.2. How an error is detected in EXPRESSCLUSTER X SingleServerSafe
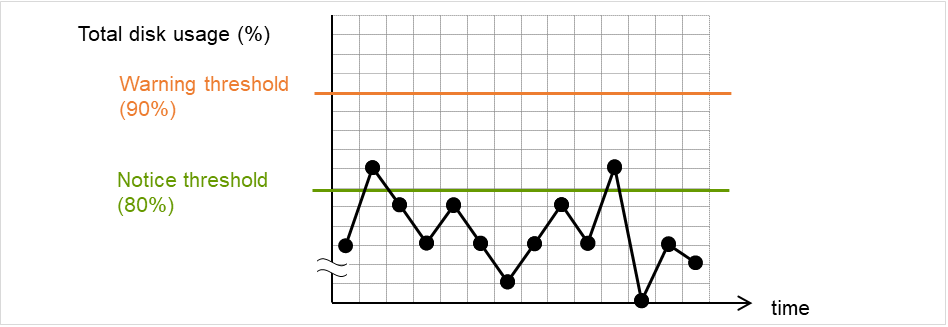
EXPRESSCLUSTER X SingleServerSafe performs several different types of monitoring to ensure quick and reliable error detection. The details of the monitoring functions are described below.
Monitoring activation status of applications
An error can be detected by starting up an application by using an application-starting resource (called application resource and service resource) of EXPRESSCLUSTER and regularly checking whether the process is active or not by using application-monitoring resource (called application monitor resource and service monitor resource). It is effective when the factor for application to stop is due to error termination of an application.
Note
If an application started directly by EXPRESSCLUSTER X SingleServerSafe starts and then ends a resident process to be monitored, EXPRESSCLUSTER X SingleServerSafe cannot detect an error in that resident process.
Note
An internal application error (for example, application stalling and result error) cannot be detected.
Monitoring applications and/or protocols to see if they are stalled or failed by using the monitoring option.
You can monitor for the stalling and failure of applications including specific databases (such as Oracle, DB2), protocols (such as FTP, HTTP), and application servers (such as WebSphere, WebLogic) by introducing optional monitoring products of EXPRESSCLUSTER X SingleServerSafe. For details, see "Monitor resource details."
Resource monitoring
An error can be detected by monitoring the resources (applications, services, etc.) and LAN status by using the monitor resources of EXPRESSCLUSTER X SingleServerSafe. It is effective when the factor for application to stop is due to an error of a resource that is necessary for an application to operate.
2.2.1. Errors that can and cannot be monitored for
For EXPRESSCLUSTER X SingleServerSafe, some errors can be monitored for, and others cannot. It is important to know what can or cannot be monitored when building and operating a cluster system.
2.2.2. Errors that can be detected and those that cannot through application monitoring
Monitoring conditions: Termination of application with errors, continuous resource errors, disconnection of a path to the network devices.
Example of errors that can be monitored:
Abnormal termination of an application
LAN NIC problem
Example of errors that cannot be monitored:
Application stalling and resulting in error.
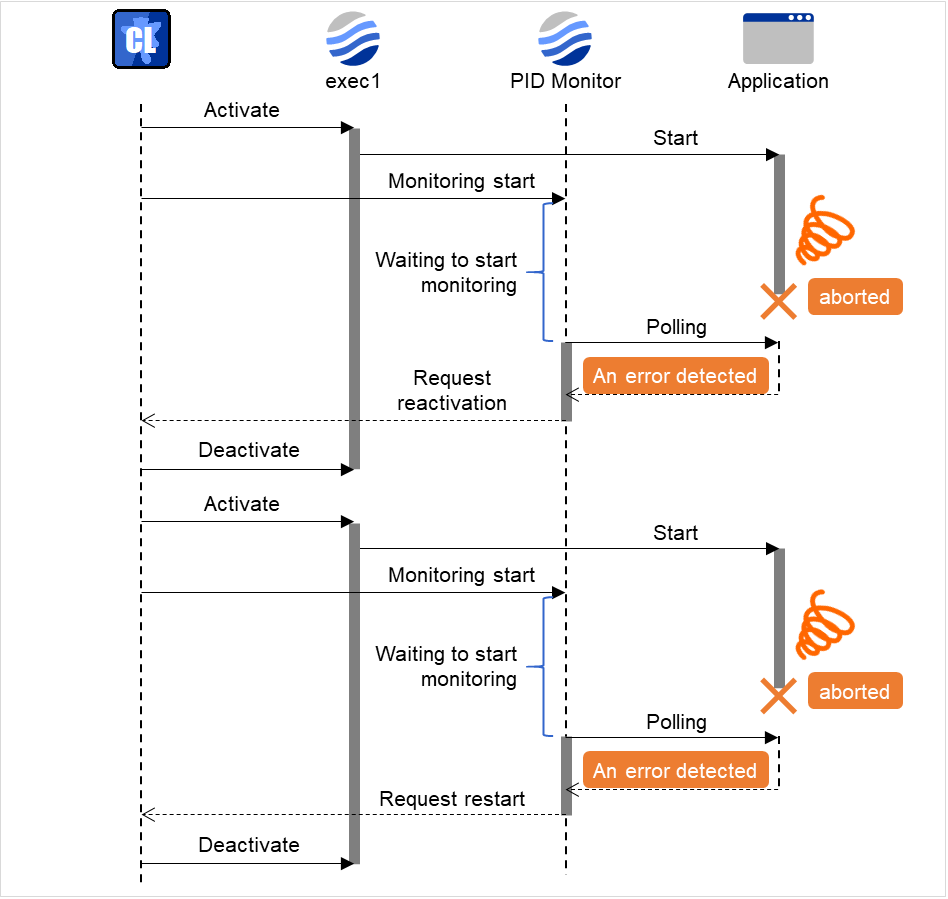
EXPRESSCLUSTER X SingleServerSafe cannot directly monitor for application stalling or resulting errors. However, it is possible to make EXPRESSCLUSTER X restart by creating an application monitoring program to make EXPRESSCLUSTER X terminate if an error is detected, running the program by using the EXEC resource, and monitoring by using a PID monitor resource.
In EXPRESSCLUSTER X SingleServerSafe, data describing how a system is set up is called configuration data. Configuration data is created by using the Cluster WebUI. This chapter describes how to start the Cluster WebUI and the procedure for creating configuration data with a sample cluster configuration.
Before creating configuration data by using the Cluster WebUI, check the values you are going to specify as the configuration data. Write down the values to make sure there is no missing information.
Sample configuration data values are shown below. The following sections describe step-by-step procedures for creating configuration data based on these conditions. When actually specifying the values, you might need to modify them according to the cluster you intend to create. For details about how to decide on the values, see "5.Group resource details " and "6.Monitor resource details".
Sample values of configuration data
Target
Parameter
Value
Server information
Server Name
server1
Monitor Resource Count
3
Group
Type
Failover
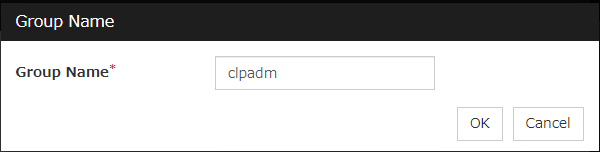
Group Name
failover1
Startup Server
server1
First group resource
Type
EXEC resource
Group Resource Name
exec1
Resident Type
Resident
Start Path
Path of execution file
First monitor resource
(created by default)
Type
User mode monitor
Monitor Resource Name
userw1
Second monitor resources
Type
IP monitor
Monitor Resource Name
ipw1
Monitor IP Address
192.168.0.254 (gateway)
Recovery Target
LocalServer
Reactivation Threshold
-
Final Action
Stop service and reboot OS
Third monitor resources
Type
PID monitor
Monitor Resource Name
Pidw1
Target Resource
Exec1
Recovery Target
failover1
Reactivation Threshold
3
Final Action
Stop service and reboot OS
Note
"User mode monitor" is automatically specified for the first monitor resource.
The configuration data can be created by accessing the Cluster WebUI. This section describes the overview of the Cluster WebUI and how to create the configuration data.
The Cluster WebUI is a function for monitoring the server status, starting and stopping servers and groups, and collecting operation logs through a web browser. The overview of the Cluster WebUI is shown in the following figure.
Creating the configuration data involves three steps: setting up the server, creating groups, and creating monitor resources. Use the cluster creation wizard to create new configuration data. The procedure is described below.
Note
Most of the created configuration data can be modified later by using the rename function or property viewing function.
Set up groups. Starting and stopping an application is controlled by a group. Create as many groups as necessary. Generally, you need as many groups as the number of applications you want to control. However, when you use script resources, you can combine more than one application into a single group.
The server settings are automatically created when you reboot the OS after installing EXPRESSCLUSTER X SingleServerSafe. When you switch from the Cluster WebUI's operation mode window to the config mode window, you will see the created data.
Add a monitor resource that monitors the specified target.
3.3.3.1. 3-1 Adding a monitor resource (IP monitor resource)
Click Add monitor resource in Monitors. The Monitor Resource Definitions is displayed.
Select the monitor resource type IP monitor in the Type box, and enter the monitor resource name ipw1 in the Name box. Click Next.
Note
Monitor resources are displayed in Type. Select the resource you want to monitor.
If the licenses for optional products have not been installed, the resources and monitor resources corresponding to those licenses are not shown in the list on the Cluster WebUI.
Enter the monitoring settings. Click Nextwithout changing the default value.
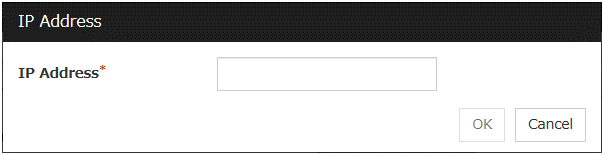
The IP Addresses is displayed. Click Add.
Enter the IP address to be monitored 192.168.0.254 in the IP Address box, and then click OK.
Note
For the monitoring target of the IP monitor resource, specify the IP address of a device (such as a gateway) that is assumed to always be active on the LAN.
The entered IP address is set in the IP Addresses. Click Next.
Set Recovery Target. Select LocalServer on the tree view being displayed, and click OK. LocalServer is set to Recovery Target.Click Browse. click Finish without changing the default values.
3.3.3.2. 3-2 Adding a monitor resource (PID monitor resource)
A monitor resource can be set up when the EXEC resource activation script type is set to Asynchronous.
Click Add monitor resource in Monitors. Select the monitor resource type PID monitor in the Type box, and then enter the monitor resource name pidw1 in the Name box. Click Next.
Enter the monitoring settings. Click Browse.
Click exec1 in the displayed tree view, and then click OK. Exec1 is specified for Target Resource. Click Next.
Set the recovery target. Click Browse.
Click failover1 in the displayed tree view. Click OK. failover1 is set in the Recovery Target.
Click Finish.
After the settings are specified, the window appears as follows.
The configuration data can be saved in a directory on your PC or in external media.
To save the configuration data, follow the procedure below.
Click Export in the config mode of Cluster WebUI.
Select a location to save the data and save it.
Note
A zip file containing one file (clp.conf) and one directory (scripts) is saved. If any of these are missing, the attempt to apply the configuration data will fail. Make sure to treat these two as a set. When new configuration data is edited, clp.conf.bak is created in addition to these two.
Note
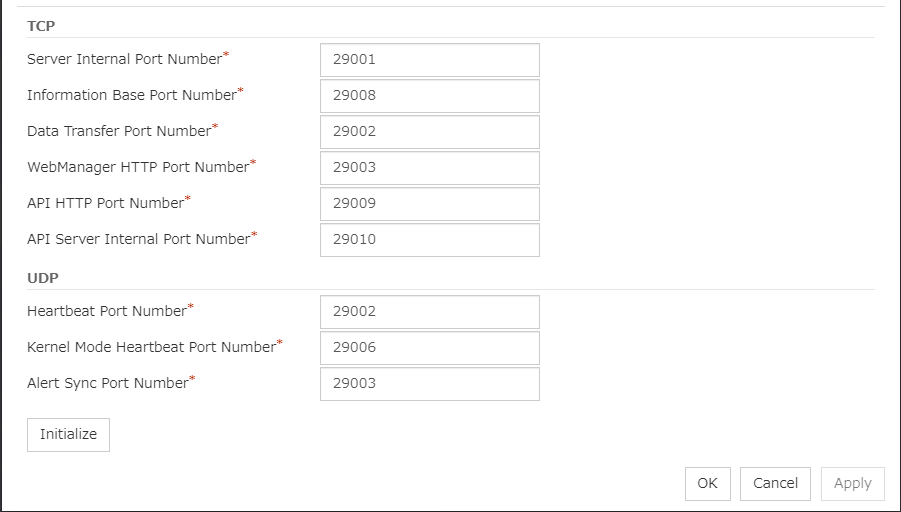
If you specified a port number for Port Number that differed from the default value when installing EXPRESSCLUSTER X SingleServerSafe, click Cluster Properties and then the Port No. tab and change the value of WebManager HTTP Port Number to the same value as that specified at the time of installation, before saving the configuration data.
Before applying the cluster configuration data created on Cluster WebUI to the cluster servers, the cluster configuration data can be checked.
In the config mode of Cluster WebUI, click Cluster Configuration Information Check.
After the check is completed, the results are displayed in another window. It may take time for the check to be completed, depending on the settings for the created cluster configuration data.
Details of what is checked are as follows:
Cluster Properties
Check item
Description
Port No. tab : port number check
Checks whether the range of automatically assigned communication port numbers managed by the OS does not overlap with that used by EXPRESSCLUSTER.
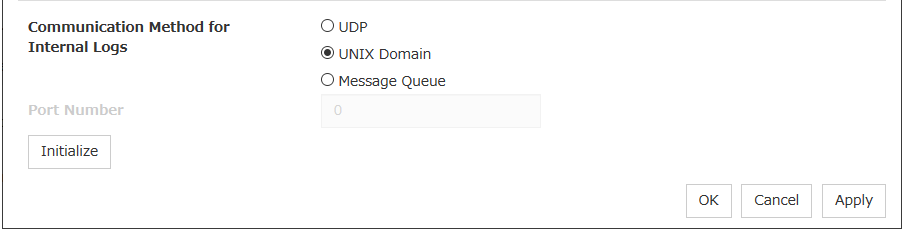
Port No.(Log) tab : port number check
Checks whether the range of automatically assigned communication port numbers managed by the OS does not overlap with that used by EXPRESSCLUSTER.
Heartbeat Resources
Check item
Description
Ping check on hb
Checks whether the IP address specified as a heartbeat resource can be used, by pinging the IP address.
Others
Check item
Description
Checking the configuration of SELinux
Checks whether SELinux is properly set.
Kernel check
Checks the kernel version.
Presence check for tar command
Checks whether the tar command has been installed.
Presence check for zip command
Checks whether the zip command has been installed.
Secure Boot check
Checks whether the secure boot has been disabled.
Unrecommended settings check
Check item
Description
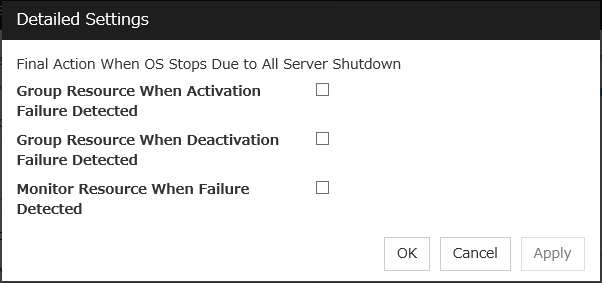
Recovery action check for deactivation failure
Checks whether any setting other than No operation is set for the final action on the deactivation failure of each group resource.
After creating configuration data by using the Cluster WebUI, apply the configuration data to the server.
To apply the configuration data, follow the procedure below.
Click Apply the Configuration File in the Cluster WebUI config mode.
Depending on the difference between the existing configuration data and the configuration data you are applying, a pop-up window might be displayed to prompt you to check the operation necessary to apply the data.
If there is no problem with the operation, click OK.
When the upload ends successfully, a popup message saying "The application finished successfully." is displayed. Click OK.
If the upload fails, perform the operations by following the displayed message.
The status will be displayed on the Cluster WebUI.
For how to operate and check the Cluster WebUI, see the online manual from the button on the upper right of the screen.
Note
When setting the firewall using the clpfwctrl command, it is necessary to execute the command even after applying the configuration data.
4.1. Checking the operation by using the Cluster WebUI
The Cluster WebUI or command line can be used to check the set up system operation. This section describes how to check the system operation by using the Cluster WebUI. The Cluster WebUI is installed at the time of the EXPRESSCLUSTER Server installation. Therefore, it is not necessary to install it separately. This section first provides a summary of the Cluster WebUI, and then describes how to access the Cluster WebUI and check the server status.
This chapter provides details about group resources.
EXPRESSCLUSTER X SingleServerSafe uses windows common to those of the clustering software EXPRESSCLUSTER X to ensure high compatibility with EXPRESSCLUSTER X in terms of operation and other aspects.
EXPRESSCLUSTER allows registration of applications and shell scripts that are managed by EXPRESSCLUSTER and executed upon activation or deactivation of the group. You can also possible to register your own programs and shell scripts in EXEC resources. You can write codes as required for respective application because shell scripts are in the same format as sh shell script.
Start script and stop script are provided in EXEC resources. EXPRESSCLUSTER runs a script for each EXEC resource when the server needs to change its status. Activation, deactivation, and restoration procedures must be written in the scripts.
5.2.2. Environment variables used in EXEC resource scripts
When EXPRESSCLUSTER runs a script, it records information such as condition when the script was run (script starting factor) in environment variables.
You can use the environment variables on the table below as branching condition to write code for your system operation.
The environment variable of a stop script returns the content of the start script that was run immediately before as a value. Start script does not set environment variables of CLP_FACTOR and CLP_PID.
The environment variable of CLP_LASTACTION is set only when the environment variable CLP_FACTOR is CLUSTERSHUTDOWN or SERVERSHUTDOWN.
Environment variable
Value of environment variable
Meaning
CLP_EVENT
...script starting factor
START
by starting a group;
on the same server by restarting a group due to the detection of a monitor resource error; or
on the same server by restarting a group resource due to the detection of a monitor resource error.
FAILOVER
Not used.
CLP_FACTOR
...group stopping factor
CLUSTERSHUTDOWN
The group was stopped by stopping the server.
SERVERSHUTDOWN
The group was stopped by stopping the server.
GROUPSTOP
The group was stopped by stopping the group.
GROUPMOVE
Not used.
GROUPFAILOVER
Not used.
GROUPRESTART
The group was restarted because an error was detected in monitor resource.
RESOURCERESTART
The group resource was restarted because an error was detected in monitor resource.
CLP_LASTACTION
...processing after stopping
REBOOT
In case of rebooting OS.
HALT
In case of halting OS.
NONE
No action was taken.
CLP_SERVER
HOME
Not used.
OTHER
Not used.
CLP_DISK
SUCCESS
Not used.
FAILURE
Not used.
CLP_PRIORITY
1 to the number of servers in the cluster
Not used.
CLP_GROUPNAME
...Group name
Group name
Represents the name of the group to which the script belongs.
CLP_RESOURCENAME
...Resource name
Resource Name:
Represents the name of the resource to which the script belongs.
CLP_PID
...Process ID
Process ID
Represents the process ID of the start script when the properties of the start script are set to asynchronous. This environment variable is null when the start script is set to synchronous.
CLP_VERSION_FULL
...EXPRESSCLUSTER full version
EXPRESSCLUSTER X SingleServerSafe full version
Represents the EXPRESSCLUSTER X SingleServerSafe full version.
(Example) 5.3.1-1
CLP_VERSION_MAJOR
...EXPRESSCLUSTER major version
EXPRESSCLUSTER X SingleServerSafe major version
Represents the EXPRESSCLUSTER X SingleServerSafe major version.
(Example) 5
CLP_PATH
...EXPRESSCLUSTER install path
EXPRESSCLUSTER X SingleServerSafe install path
Represents the path where EXPRESSCLUSTER X SingleServerSafe is installed.
(Example) /opt/nec/clusterpro
CLP_OSNAME
...Server OS name
Server OS name
Represents the OS name of the server where the script was executed.
(Example)
(1) When the OS name could be acquired:
Red Hat Enterprise Linux Server release 6.8 (Santiago)
(2) When the OS name could not be acquired:
Linux
CLP_OSVER
...Server OS version
Server OS version
Represents the OS version of the server where the script was executed.
(Example)
(1) When the OS version could be acquired: 6.8
(2) When the OS version could not be acquired: *Blank
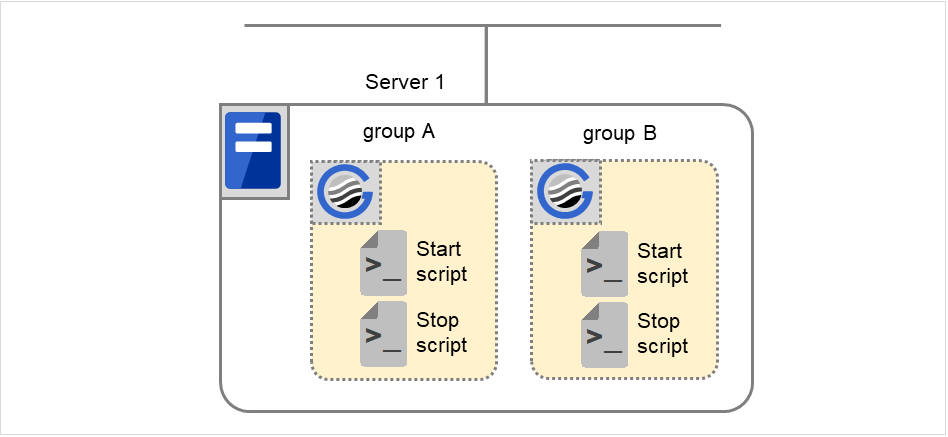
5.2.2.1. Execution timing of EXEC resource scripts
The timings at which the start script and stop script are executed and how the environment variables are associated with the execution are described below with diagrams of status transitions.
In the figure below, the server is in the following status:
Server
Server status
Normal
Stopped
(Example) Group A is running in Server 1 that is in a normal status.
Numbers (1) and (2) in the diagram correspond to descriptions as follows.
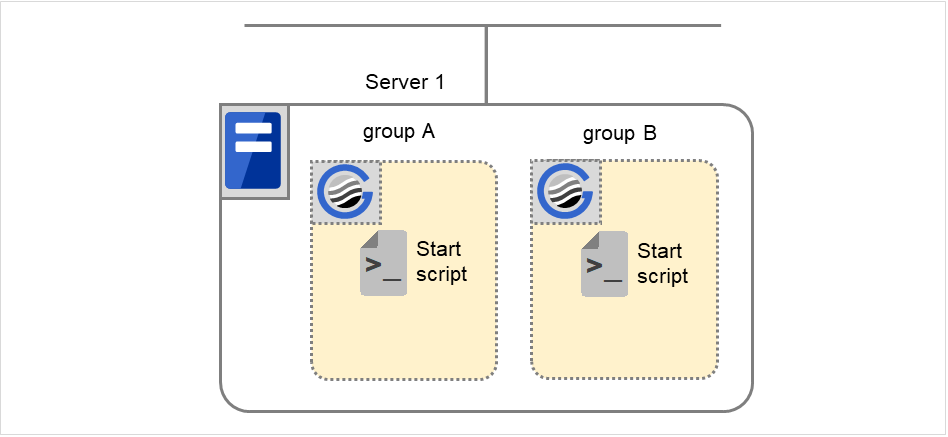
Normal startup
The normal startup in this context indicates when the start script is normally executed on the server.
Fig. 5.3 The state and script execution (normal startup)
Environment variable for Start
Group A
Group B
CLP_EVENT
START
START
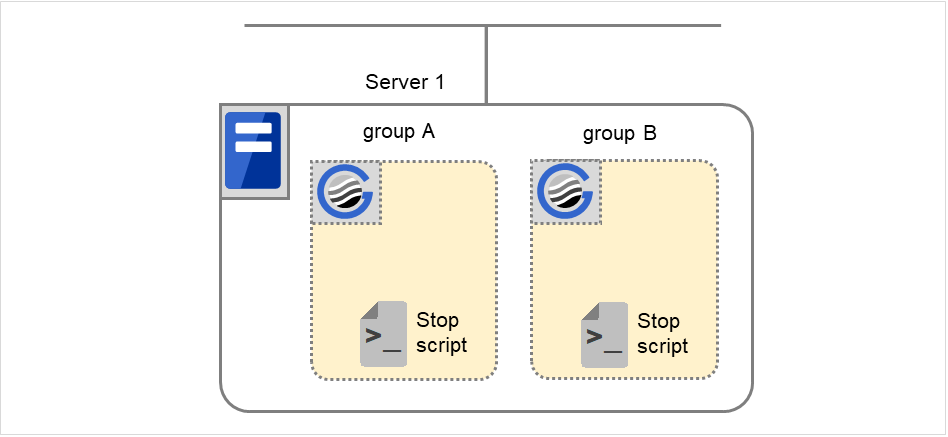
Normal shutdown
The normal shutdown in this context indicates the shutdown immediately after the start script corresponding to the stop script is executed for normal startup.
Fig. 5.4 The state and script execution (normal shutdown)
This section describes how you actually write script codes in association with timing to run scripts as mentioned in the previous topic. Numbers in brackets "(number)" in the following example script code represent the actions described in "5.2.2.1.Execution timing of EXEC resource scripts".
Group A start script: A sample of start.sh
#!/bin/sh# ***************************************# * start.sh *# ***************************************# Allot a process by referencing environment variables for script starting factors.if["$CLP_EVENT"="START"]then# Write the normal startup process of the operation here.# This process is executed at the following timing:## (1) Normal startup#else# EXPRESSCLUSTER is not running.fi# If an exit code is 0, then the activation process of the EXEC resource is determined as successful.# If an error occurs in the script, write the script by which a non-zero exit code is returned.exit0
Group A stop script: A sample of stop.sh
#!/bin/sh# ***************************************# * stop.sh *# ***************************************# Allot a process by referencing environment variables for script starting factors.if["$CLP_EVENT"="START"]then# Write the normal shutdown process of an operation here. This process is executed at the following timing:## (2) Normal shutdown#else# EXPRESSCLUSTER is not running.fiexit0
Note the following points when creating EXEC resource script.
If your script has a command that requires some time to complete, it is recommended to configure command completion messages to be always produced. This message can be used to determine the error when a problem occurs. There are two ways to produce the message:
Specify the EXEC resource log output path by writing the echo command in the script.
Trace results can be output to the standard output by using the echo command. Specify the log output path in the resource properties that contain the script.
The message is not logged by default. For the log output path setting, see "Maintenance tab" in "Tuning EXEC resource" in "5.2.6.Details tab". If the Rotate Log check box is not selected, pay attention to the available disk space of a file system because messages are sent to the file specified as the log output destination file regardless of the size of available disk space.
(Example: Sample script)
echo"appstart.."appstartecho"OK"
Writing clplogcmd in the script
clplogcmd outputs messages to the alert log or OS syslog. For details about the clplogcmd command, refer to "Output messages (clplogcmd command)" in "EXPRESSCLUSTER X SingleServerSafe command reference" in the "EXPRESSCLUSTER X SingleServerSafe Operation Guide".
When the Script Log Rotate function is enabled, a process is generated to mediate the log output. This intermediate process continues to work until the file descriptor is closed (i.e. until all the logs stop being output from the start and stop scripts and from a descendant process that takes over the standard output and/or the standard error output from the start and stop scripts). To exclude output from the descendant process from the log, redirect the standard output and/or the standard error output when the process is generated with the script.
The start script and the stop script are executed by root user.
To start an application dependent on an environment variable, the script must set the environment variable as needed.
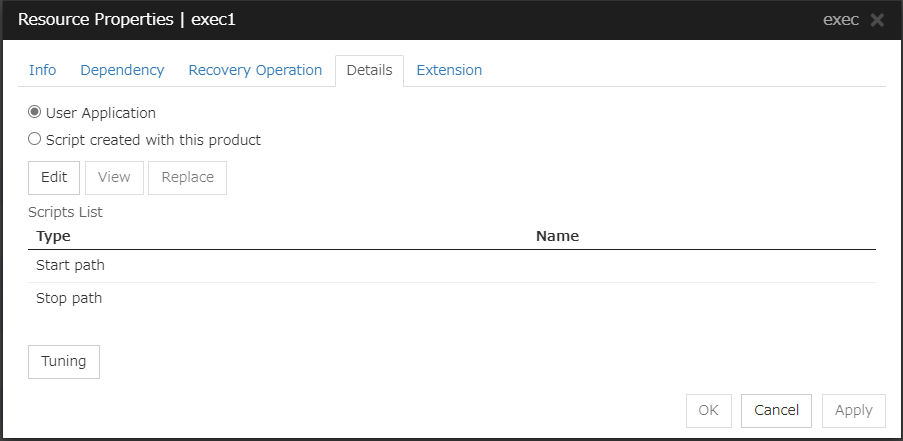
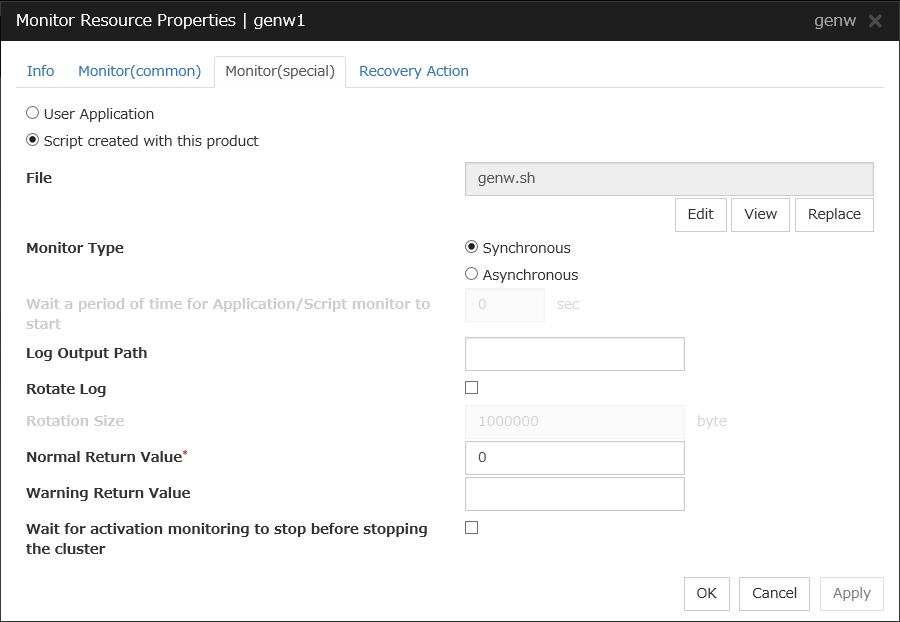
Select this option to use executable files (executable shell scripts and binary files) on your server as scripts. Specify the local disk path on the server for each executable file name.
The configuration data created by the Cluster WebUI does not contain these files. You cannot edit the script files using the Cluster WebUI.
Script created with this product
Use a script file which is prepared by the Cluster WebUI as a script. You can edit the script file with the Cluster WebUI if you need. The script file is included in the configuration data.
View
Click here to display the script file when you select Script created with this product.
Edit
Click here to edit the script file when you select Script created with this product. Click Save the script file to apply the change. You cannot modify the name of the script file.
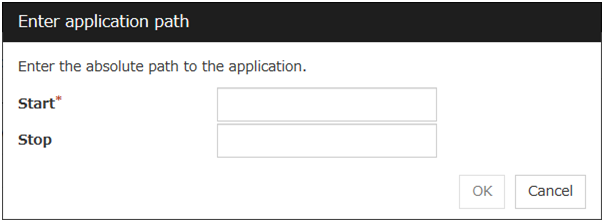
With the User Application option selected, the Enter application path dialog box appears.
Enter application path
Specify an EXEC resource executable file name.
Start (Within 1023 bytes)
Enter an executable file name to be run when the EXEC resource starts. The name should begin with "/". Arguments can also be specified.
Stop (Within 1023 bytes)
Enter an executable file name to be run when the EXEC resource stops. The name should begin with "/". The stop script is optional.
For the executable file name, specify a full path name starting with "/" to a file on your cluster server.
Arguments can also be specified.
Replace
Opens the Open dialog box with the Script created with this product option selected.
The content of the script file selected in the Resource Property is replaced with the one selected in the Open dialog box. You cannot replace the script file if it is currently displayed or edited. Select a script file only. Do not select binary files (applications), and so on.
Tuning
Opens the EXEC resource tuning properties dialog box. You can make advanced settings for the EXEC resource. If you want the PID monitor resource to monitor the EXEC resources, you have to set the start script to asynchronous.
EXEC resource tuning properties
Parameter tab
Common to all start scripts and stop scripts
Synchronous
Select this button to wait for a script to end when it is run. Select this option for executable files that are not resident (the process is returned immediately after the script completion).
Asynchronous
Does not wait for the script to end when it is run. Select this for resident executable files.
The script can be monitored by PID monitor resource if Asynchronous is selected.
Timeout (1 to 9,999)
When you want to wait for a script to end (when selecting Synchronous), specify how many seconds you want to wait before a timeout. The timeout can be specified only when Synchronous is selected. If the script does not complete within the specified time, it is determined as an error.
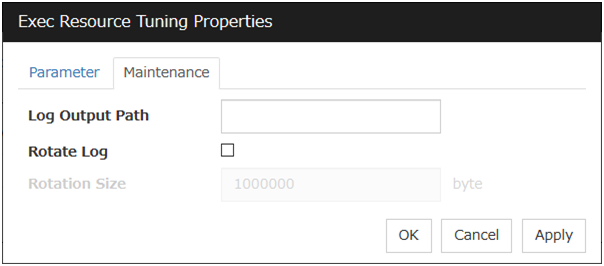
Maintenance tab
Log Output Path (within 1,023 bytes)
Specify the redirect destination path of standard output and standard error output for EXEC resource scripts and executable files. If this box is left blank, messages are directed to /dev/null. The name should begin with "/."
If the Rotate Log check box is off, note the amount of available disk space in the file system because no limit is imposed on message output.
If the Rotate Log check box is on, the log file to be output is rotated. Note the following items.
You must specify a log output path within 1009 bytes. If you specify a path of 1010 bytes or more, the log is not output.
You must specify a log file name within 31 bytes. If you specify a log file name of 32 bytes or more, the log is not output.
Specify a different log file name for each EXEC resource.
If the same log file name is specified with different paths (e.g., /home/foo01/log/exec.log and /home/foo02/log/exec.log): In performing the Script Log Rotate function with two or more EXEC resources, their logs are outputted to one log file in which the rotation size might be incorrectly recorded.
Rotate Log
Clicking Rotate Log when the Rotate Log check box is not checked outputs the execution logs of the EXEC resource script and the executable file without imposing any limit on the file size. Clicking Rotate Log when the Rotate Log check box is selected rotates and outputs messages.
Rotation Size (1 to 999999999)
If the Rotate Log check box is selected, specify a rotation size.
The structures of the log files to be rotated and output are as follows:
File name
Description
file_name for the Log Output Path specification
Newest log
file_name.pre for the Log Output Path specification
This chapter provides details about monitor resources. A monitor resource is the unit used when EXPRESSCLUSTER X SingleServerSafe performs monitoring.
EXPRESSCLUSTER X SingleServerSafe uses windows common to those of the clustering software EXPRESSCLUSTER X to ensure high compatibility with EXPRESSCLUSTER X in terms of operation and other aspects.
The following resources can be defined as monitor resources:
Monitor resource name
Function
Monitor Timing:
(Default values are shown in bold.)
Target Resource
Disk monitor resource
Monitors disk devices.
Always/When activated
All resources
IP monitor resource
Monitors IP addresses and communication paths by using the ping command and checking whether there is a response.
Always/When activated
All resources
NIC Link Up/Down monitor resource
Acquires the NIC link status to monitor whether the link is up or down.
Always/When activated
All resources
PID monitor resource
PID monitor resource monitors a successfully activated EXEC resource.
When activated (Fixed)
exec
resource
User mode monitor resource
Determines a user space stall to be an error.
Always (Fixed)
-
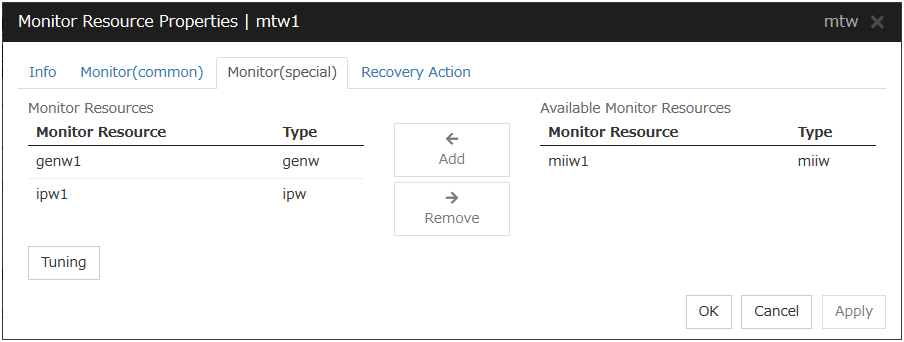
Multi target monitor resource
Performs monitoring by using multiple monitor resources in combination.
Always/When activated
All resources
Software RAID monitor resource
Monitors software RAID devices.
Always (Fixed)
None
Custom monitor resource
Performs monitoring by executing any script.
Always/When activated
All resources
Volume manager monitor resource
Provides a monitoring mechanism for multiple storage devices and disks.
Always/When activated
All
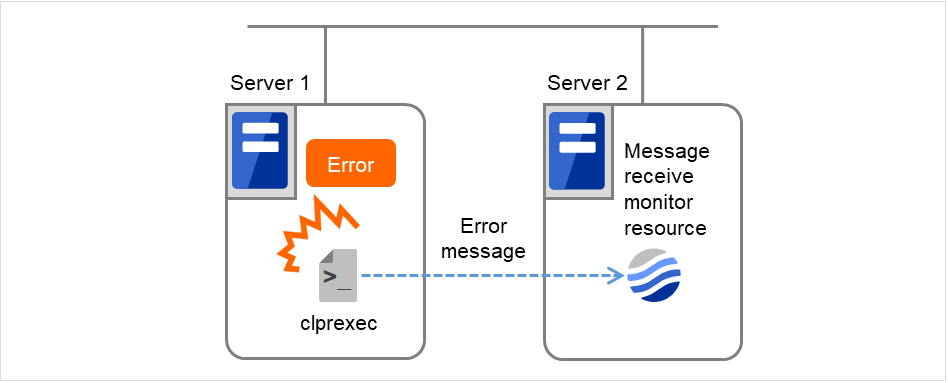
External link monitor resource
Sets up error-handling actions executed on reception of an error message and displays error message in the Cluster WebUI.
Always/When activated
None
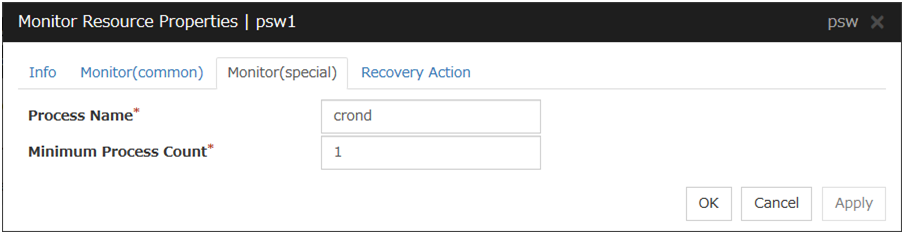
Process Name monitor resource
Monitors monitor the process of specified processes.
Always/When activated
All
resources
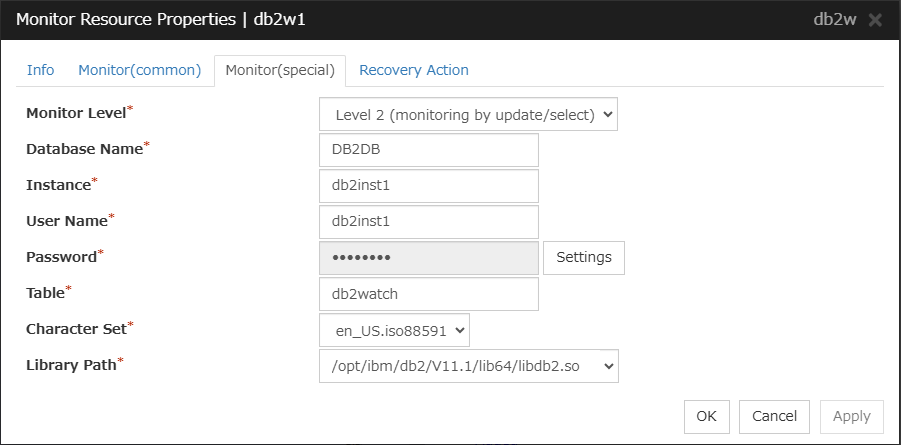
DB2 monitor resource
Provides a mechanism for monitoring an IBM DB2 database.
When activated (Fixed)
All resources
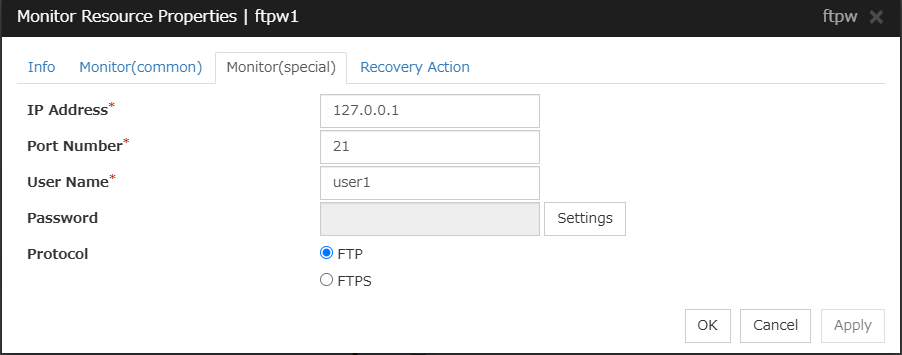
FTP monitor resource
Provides a mechanism for monitoring an FTP server.
Always/When activated
All resources
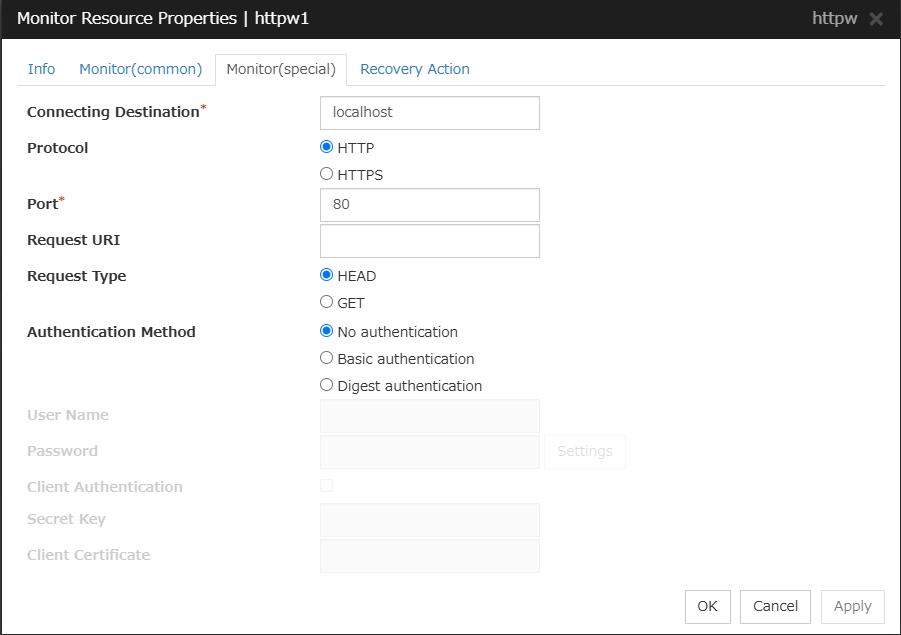
HTTP monitor resource
Provides a mechanism for monitoring an HTTP server.
Always/When activated
All resources
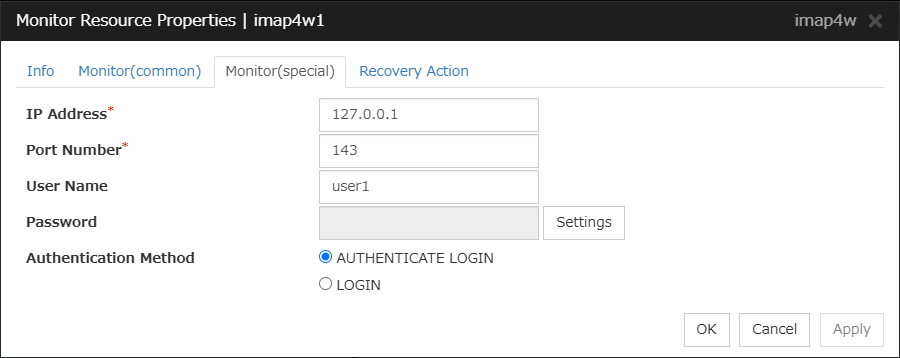
IMAP4 monitor resource
Provides a mechanism for monitoring an IMAP server.
Always/When activated
All resources
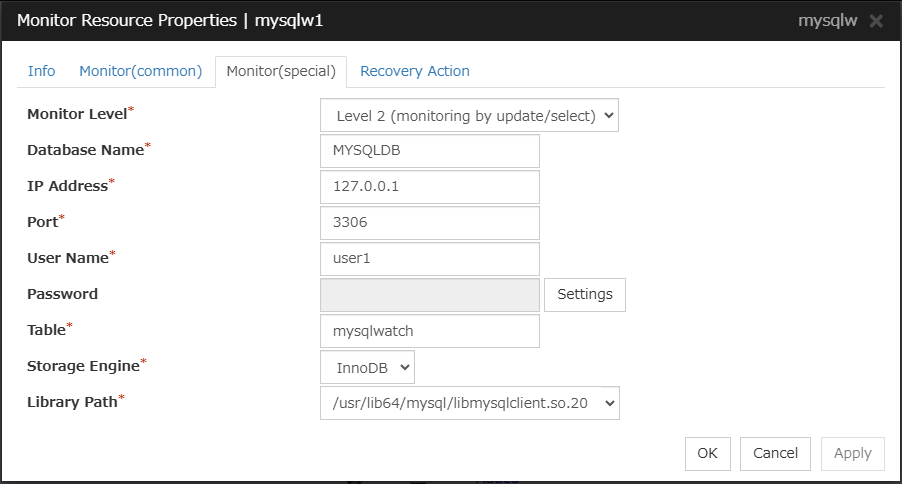
MySQL monitor resource
Provides a mechanism for monitoring a MySQL database.
When activated (Fixed)
All resources
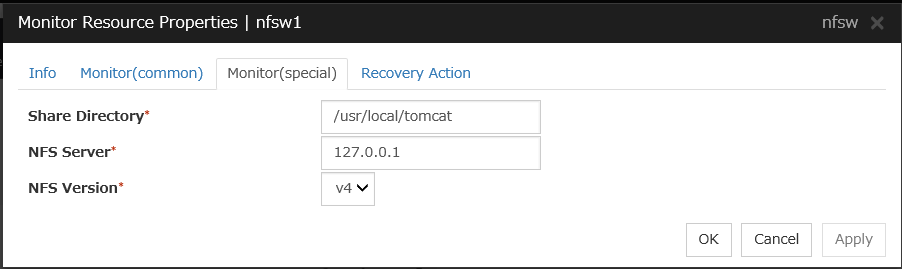
NFS monitor resource
Provides a mechanism for monitoring an NFS file server.
Always/When activated
All resources
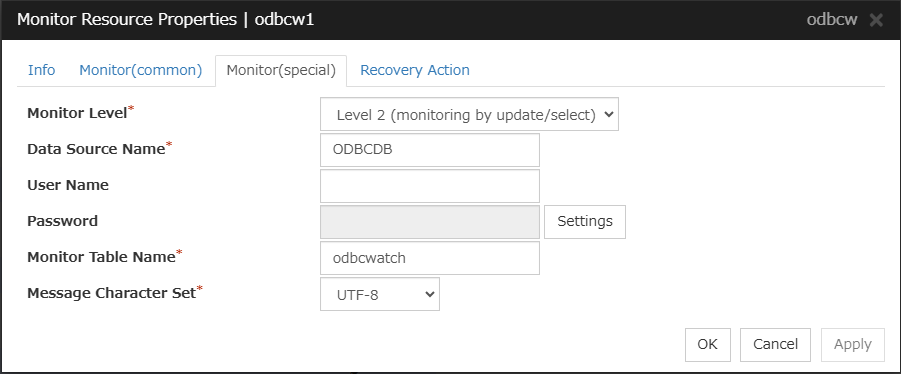
ODBC monitor resources
Provides a mechanism for monitoring a ODBC database.
When activated (Fixed)
All resources
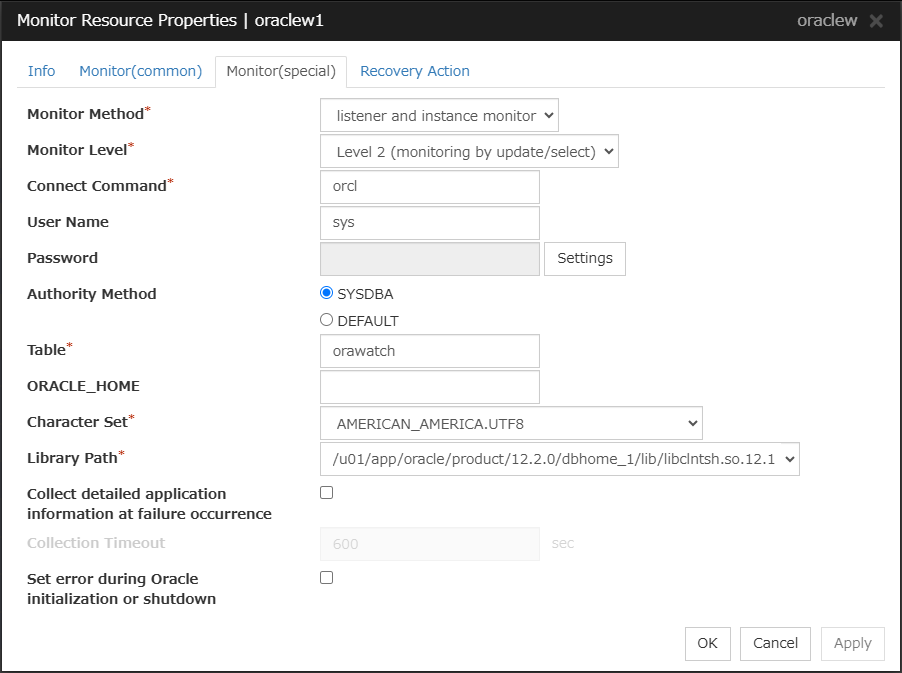
Oracle monitor resource
Provides a mechanism for monitoring an Oracle database.
When activated (Fixed)
All resources
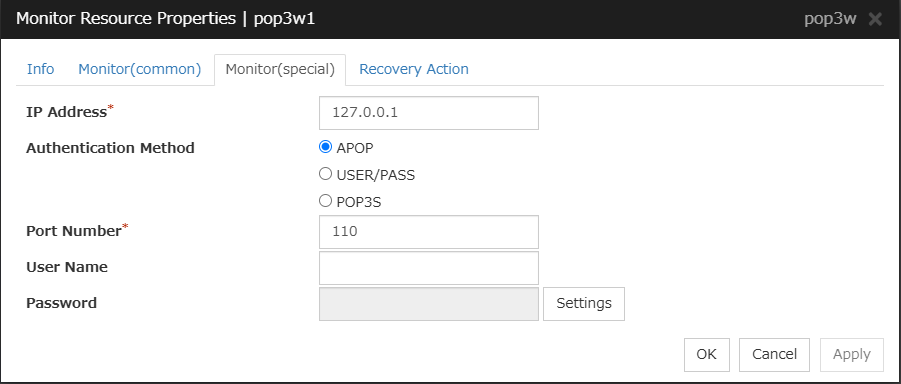
POP3 monitor resource
Provides a mechanism for monitoring a POP server.
Always/When activated
All resources
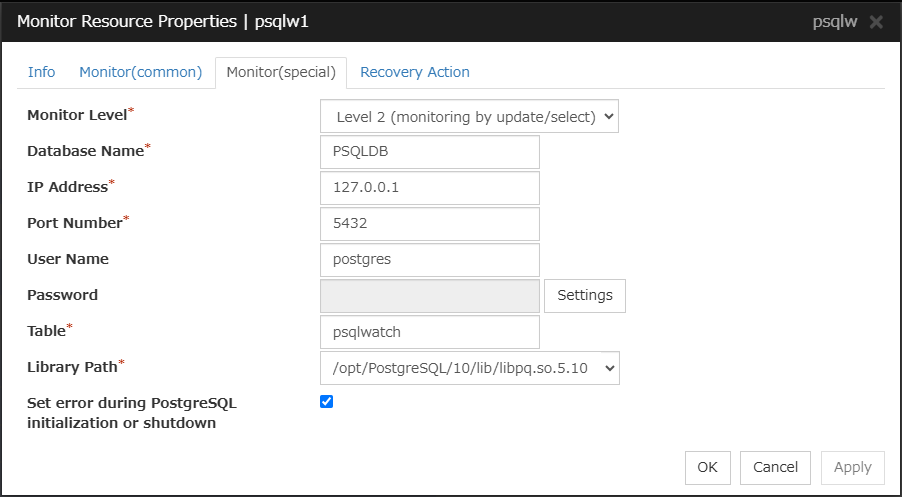
PostgreSQL monitor resource
Provides a mechanism for monitoring a PostgreSQL database.
When activated (Fixed)
All resources
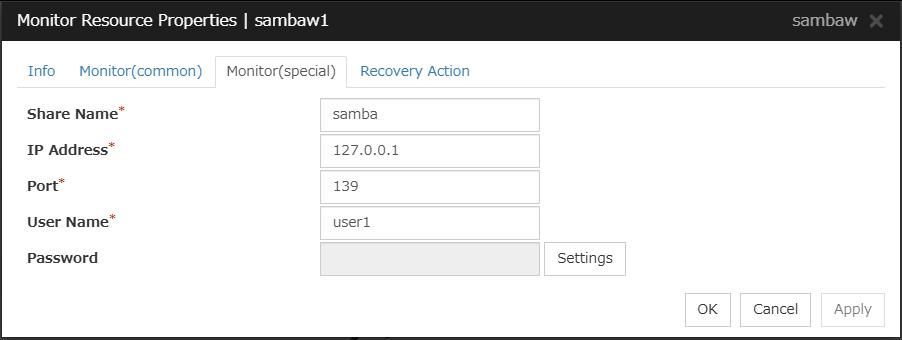
Samba monitor resource
Provides a mechanism for monitoring a samba file server.
Always/When activated
All resources
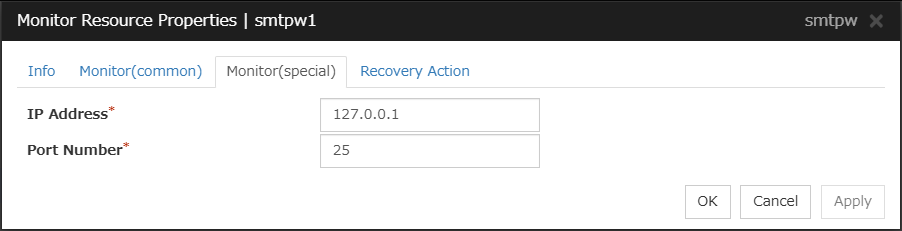
SMTP monitor resource
Provides a mechanism for monitoring an SMTP server.
Always/When activated
All resources
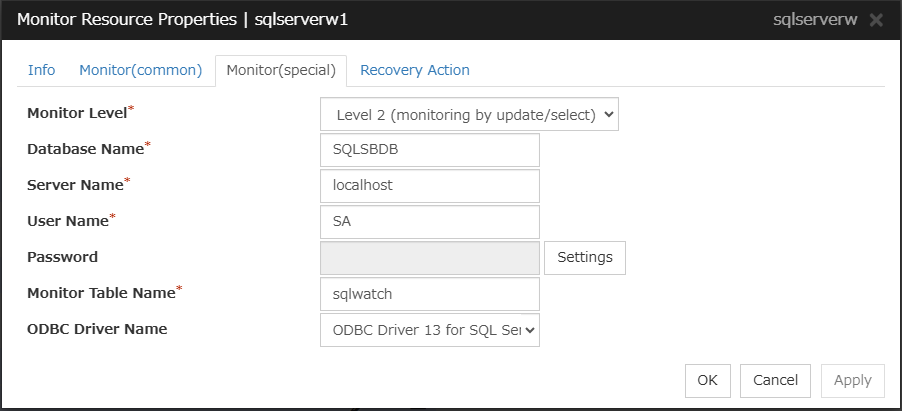
SQL Server monitor resources
Provides a mechanism for monitoring a SQL Server database.
When activated (Fixed)
All resources
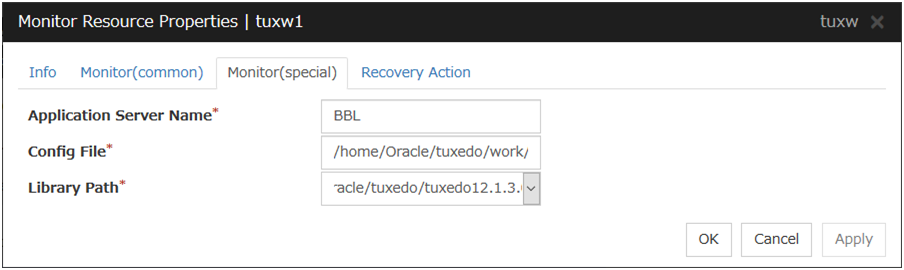
Tuxedo monitor resources
Provides a mechanism for monitoring a Tuxedo application server.
When activated (Fixed)
All resources
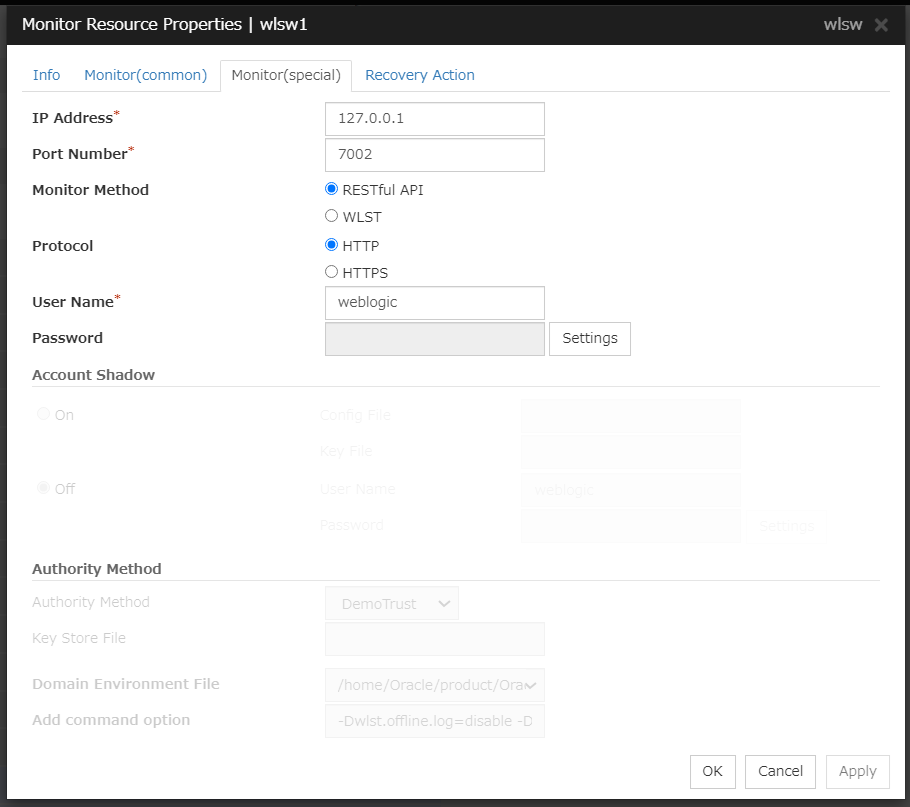
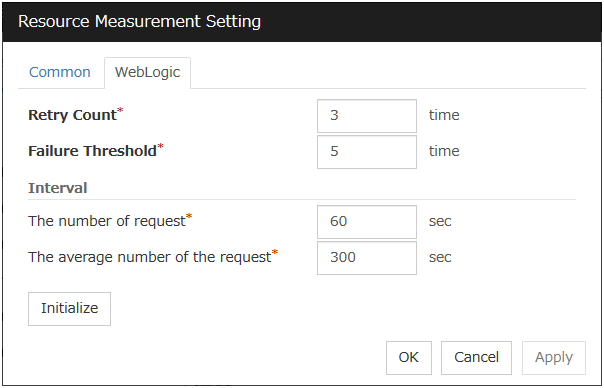
WebLogic monitor resources
Provides a mechanism for monitoring a WebLogic application server.
When activated (Fixed)
All resources
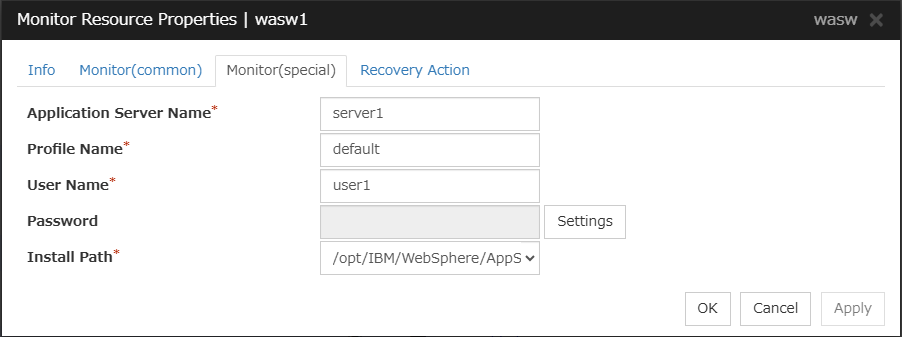
WebSphere monitor resources
Provides a mechanism for monitoring a WebSphere application server.
When activated (Fixed)
All resources
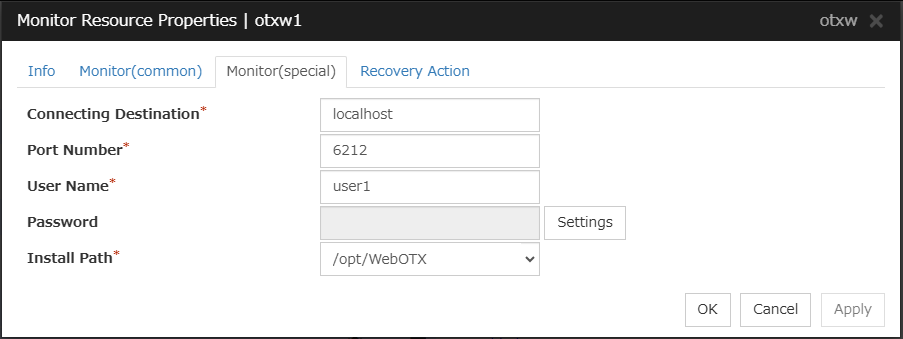
WebOTX monitor resources
Provides a mechanism for monitoring a WebOTX application server.
When activated (Fixed)
All resources
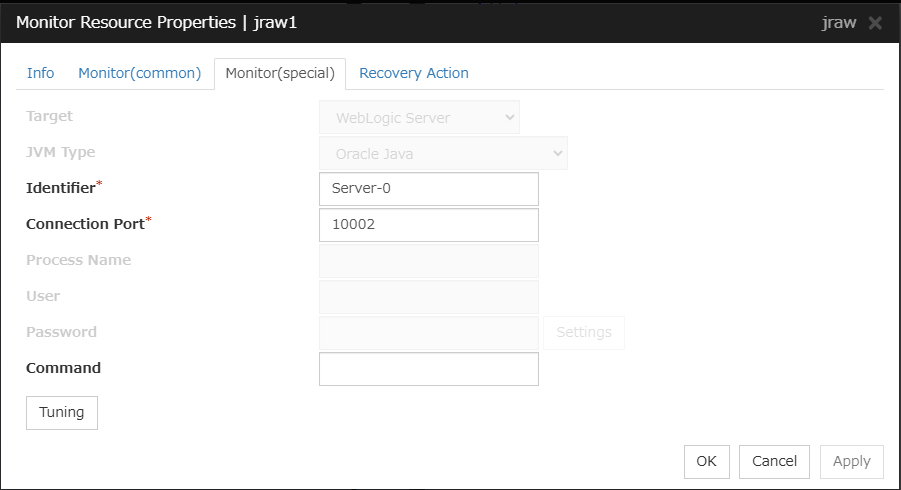
JVM monitor resources
Provides a mechanism for monitoring a Java VM.
Always/When activated
exec
resource
System monitor resources
Provides a mechanism for monitoring a System Resource.
Always (Fixed)
All resources
Process resource monitor resources
Provides a mechanism for monitoring a Process Resource.
Always (Fixed)
All resources
6.1.1. Status of monitor resources after monitoring starts
The status of some monitor resources might be "Caution" if there is a period of time following the start of monitoring in which monitoring of that resource is not yet ready.
Caution status is possible for the following monitor resources.
External Link Monitor Resource
Custom Monitor Resource (whose monitor type is Asynchronous)
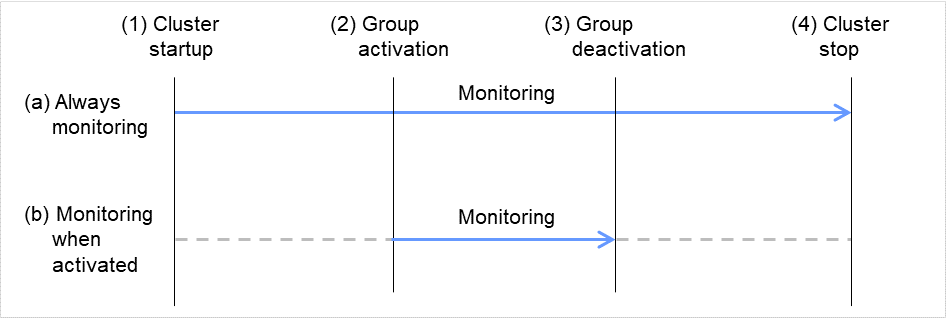
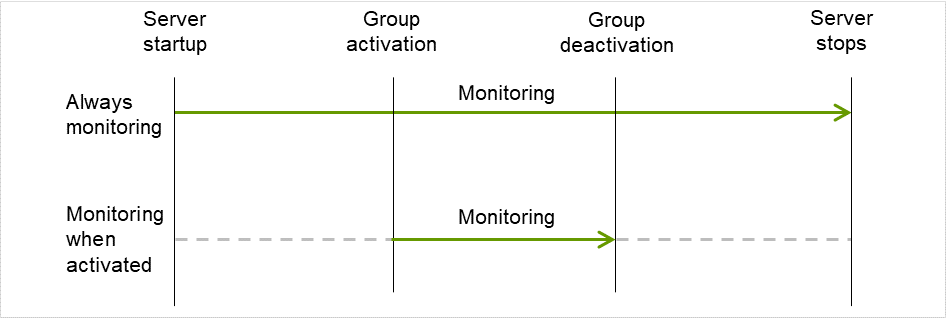
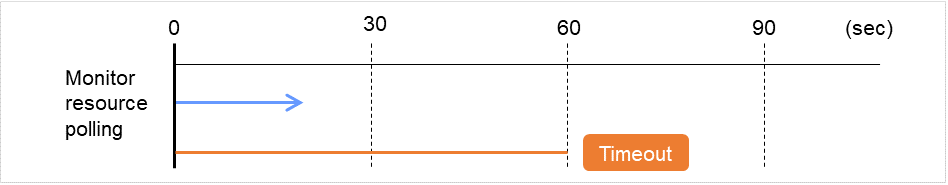
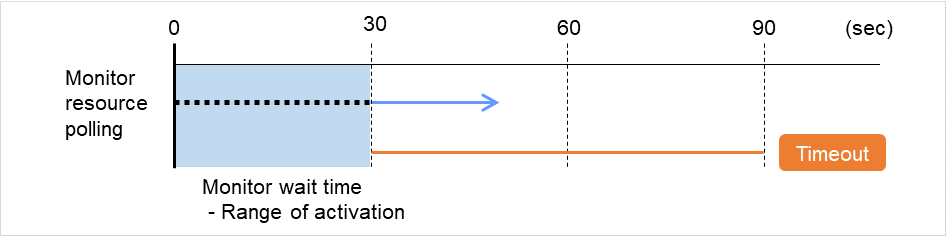
There are two types of monitoring by monitor resources; Always and Active.
The monitoring timing differs depending on monitor resources:
Always:
Monitoring is performed by monitor resource all the time.
Active:
Monitoring is performed by monitor recourse while specified group resource is active.
Monitor resource does not monitor while group resource is not activated.
Fig. 6.1 Always monitor and Monitors while activated for a monitor resource
6.1.3. Suspending and resuming monitoring on monitor resources
Monitor resource can temporarily suspend monitoring and resume it.
Monitoring can be suspended and resumed by the following two methods:
Operation on the Cluster WebUI
Operation by the clpmonctrl command
The clpmonctrl command can control only monitor resources on the server where this command is run.
Some monitor resources can suspend and resume monitoring and others cannot. For details, see the list below.
Monitor Resource
Control
Disk Monitor Resource
Possible
IP Monitor Resource
Possible
User-mode Monitor Resource
Possible
NIC Link Up/Down Monitor Resource
Possible
PID Monitor Resource
Possible
Multi Target Monitor Resource
Possible
Custom Monitor Resource
Possible
DB2 Monitor Resource
Possible
Software RAID Monitor Resource
Possible
Process Name Monitor Resource
Possible
DB2 Monitor resource
Possible
FTP Monitor Resource
Possible
HTTP Monitor Resource
Possible
IMAP4 Monitor Resource
Possible
MySQL Monitor Resource
Possible
NFS Monitor Resource
Possible
ODBC Monitor Resource
Possible
Oracle Monitor Resource
Possible
POP3 Monitor Resource
Possible
PostgreSQL Monitor Resource
Possible
Samba Monitor Resource
Possible
SMTP Monitor Resource
Possible
SQL Server Monitor Resource
Possible
Tuxedo Monitor Resource
Possible
WebLogic Monitor Resource
Possible
WebSphere Monitor Resource
Possible
WebOTX Monitor Resource
Possible
External Link Monitor Resource
Possible
JVM Monitor Resource
Possible
System Monitor Resource
Possible
Process Resource Monitor Resource
Possible
Suspending monitoring on a monitor resource is disabled if one of the following operations is performed.
Resume operation on Cluster WebUI
Resume operation by using the clpmonctrl command
Stop the cluster
Suspend the cluster
6.1.4. Enabling and disabling dummy failure of monitor resources
You can enable and disable dummy failure of monitor resources.
Use one of the following methods to enable or disable dummy failure.
Operation on Cluster WebUI (verification mode)
The verification mode of Cluster WebUI disables you from operating uncontrollable monitor resources.
Operation by using the clpmonctrl command
The clpmonctrl command can control only monitor resources on the server where this command is run. When the clpmonctrl command is executed on monitor resource which cannot be controlled, dummy failure is not enabled even though the command succeeds.
Some monitor resources can enable and disable dummy failure and others cannot.
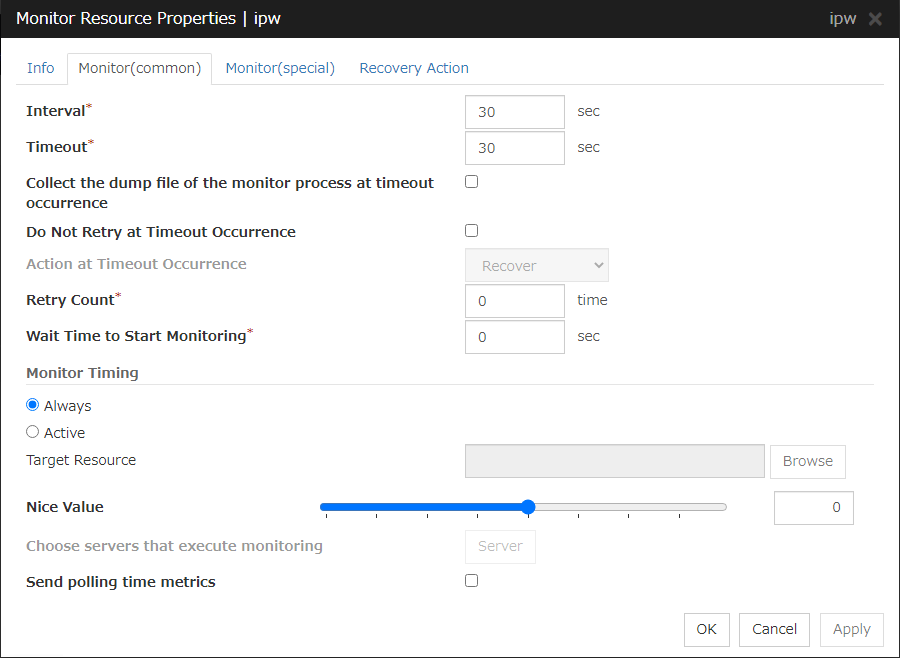
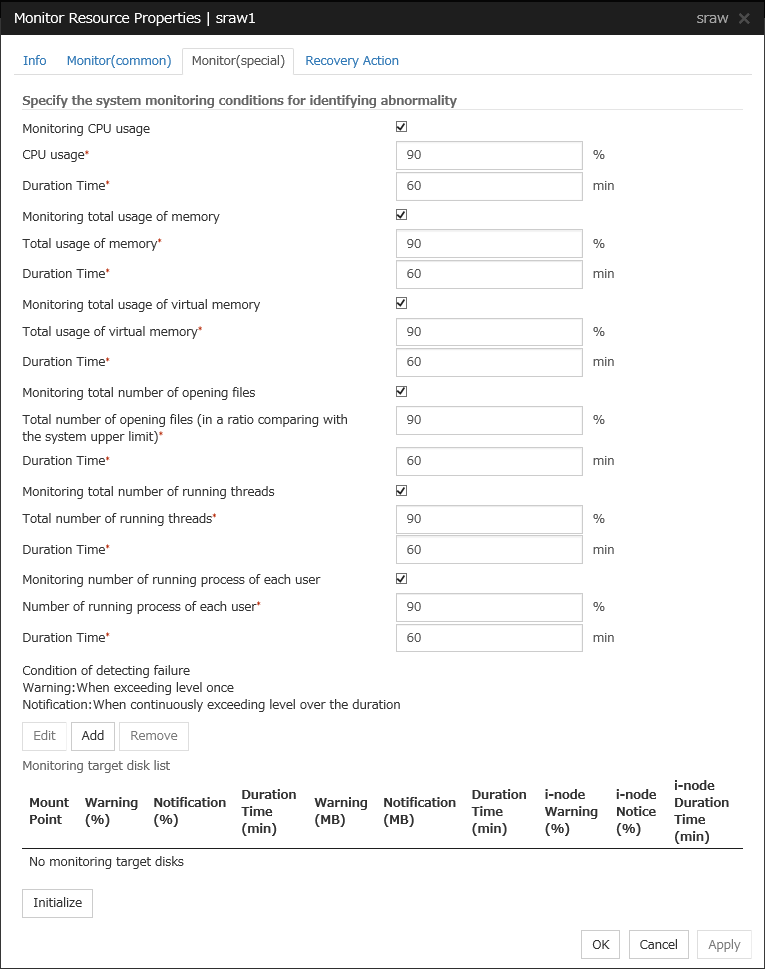
To assign a higher priority for monitor resources to monitor when the operating system is heavily loaded, the nice value can be set to all monitor resources except the user mode monitor resource.
The nice value can be specified through minus 19 (low priority) to plus 20 (high priority). Detection of the monitor timeout can be controlled by setting a higher priority to the nice value.
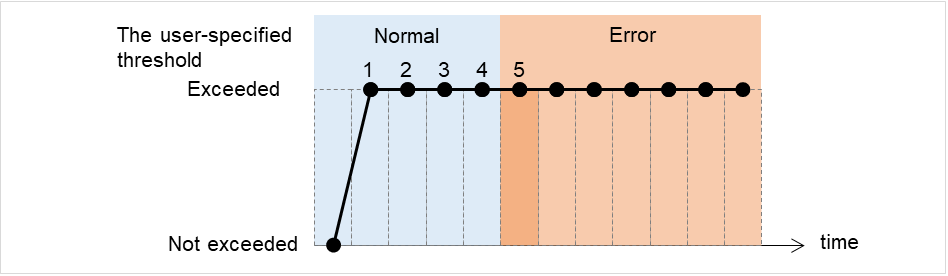
When the normal status cannot be detected within the time specified here, the status is determined to be error.
Collect the dump file of the monitor process at timeout occurrence
In case that this function is enabled, the dump information of the timed out monitor resource is collected when the monitor resource times out. Dump information is collected up to 5 times.
Do Not Retry at Timeout Occurrence
If you enabled this option: Immediately after a timeout of the monitor resource, the action selected in Action at Timeout Occurrence is performed.
Action at Timeout Occurrence
Select an action in response to a timeout of the monitor resource. The timeout occurrence resets the retry counter.
This can be set only when the Do Not Retry at Timeout Occurrence function is enabled.
Recover
Performs a recovery action when the monitor resource times out.
Do not recover
Does not perform a recovery action even if the monitor resource times out.
Keepalive Panic
Performs the keepalive panic.
Sysrq Panic
Performs the sysrq panic.
Note
For the following monitor resources, the Do Not Retry at Timeout Occurrence and Action at Timeout Occurrence functions cannot be set.
user-mode monitor resources
custom monitor resources (whose monitor type is Asynchronous)
multi target monitor resources
external link monitor resources
JVM monitor resources
system monitor resources
process resource monitor resources
Retry Count (0 to 999)
Specify how many times an error should be detected in a row after the first one is detected before the status is determined as error. If this is set to zero (0), the status is determined as error at the first detection of an error.
Wait Time to Start Monitoring (0 to 9999)
Set the wait time to start monitoring.
Monitor Timing
Set the monitoring timing. Select the timing from:
Always:
Monitoring is performed all the time.
Active:
Monitoring is not started until the specified resource is activated.
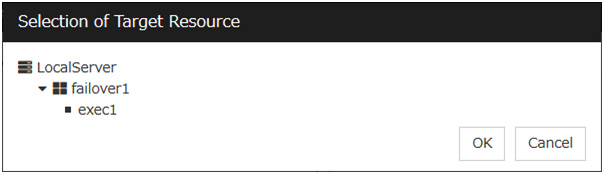
Target Resource
The resource which will be monitored when activated is shown.
Browse
Click this button to open the dialog box to select the target resource. The group names and resource names that are registered in the LocalServer and cluster are shown in a tree view. Select the target resource and click OK.
Nice Value
Set the nice value of a process.
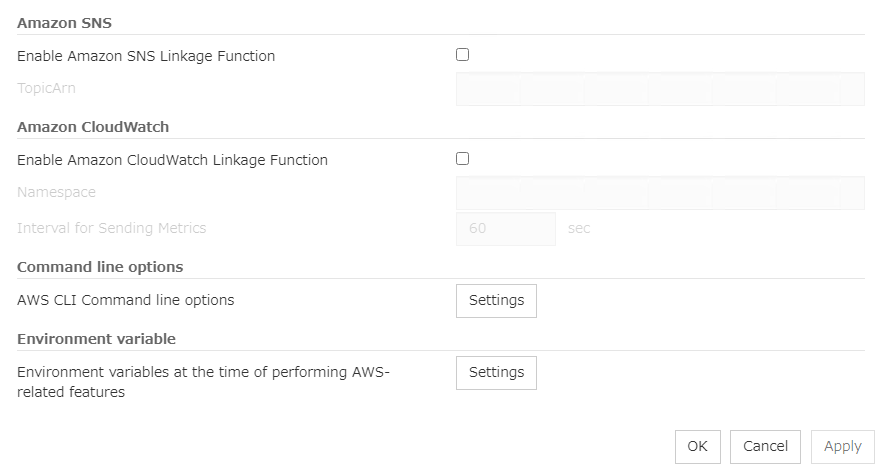
Send polling time metrics
Enable or disable sending metrics: data on the monitoring process time taken by the monitor resource.
If the check box is checked:
The metrics are sent.
If the check box is not checked:
The metrics are not sent.
Note
For using the Amazon CloudWatch linkage function, enabling this option allows you to send data on the monitoring process time taken by any monitor resource.
Send polling time metrics cannot be set for the following monitor resources:
user-mode monitor resources
custom monitor resources (whose monitor type is Asynchronous)
Some monitor resources require the parameters at the monitoring operation to be configured. The parameters are described in the explanation part about each resource.
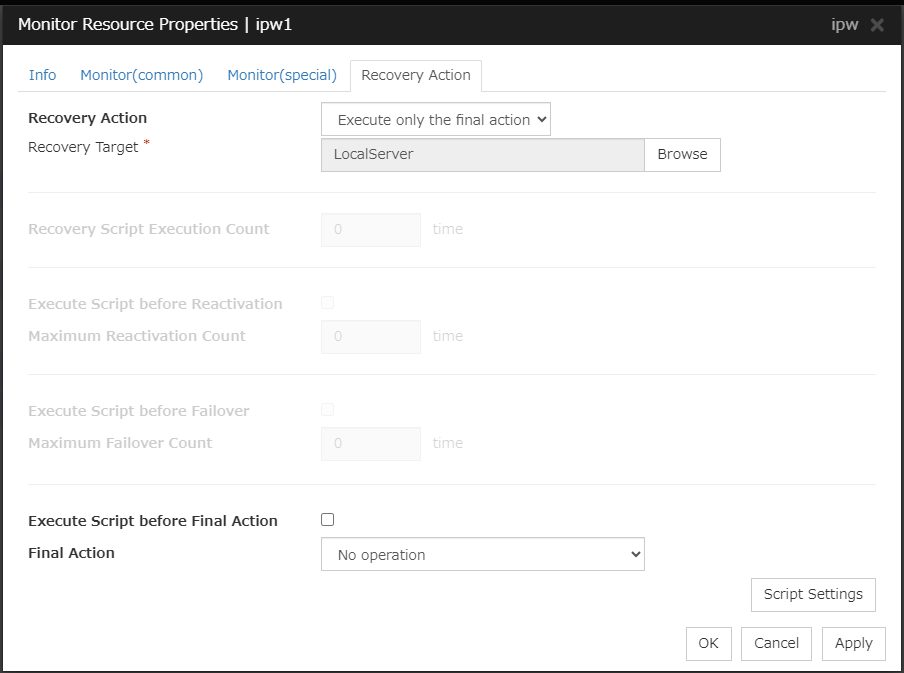
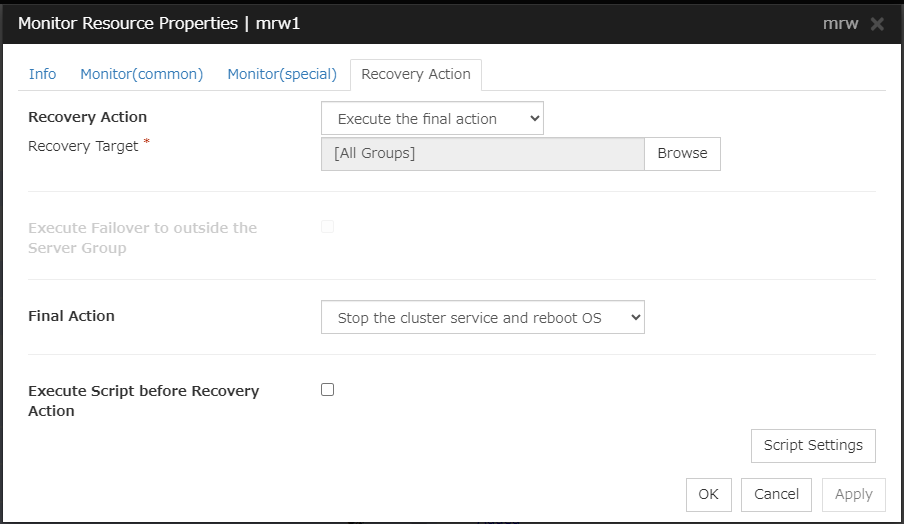
In this dialog box, you can configure the recovery target and an action to be taken at the time when an error is detected. By setting this, it allows restart of the group, restart of the resource, and restart of the server when an error is detected. However, recovery will not occur if the recovery target is not activated.
Recovery Action
Specify the operation to perform when an error is detected.
Restart the recovery target
Reactivate the selected group or group resource as the recovery target. When reactivation fails or the same error is detected after reactivation, execute the selected action as the final action.
Execute only the final action
Execute the selected action as the final action.
Custom setting
Execute the recovery script up until the maximum script execution count. If an error is continuously detected after script execution, reactivate the selected group or group resource as the recovery target up until the maximum reactivation count. If reactivation fails or the same error is continuously detected after reactivation, and the count reaches the maximum reactivation count, execute the selected action as the final action.
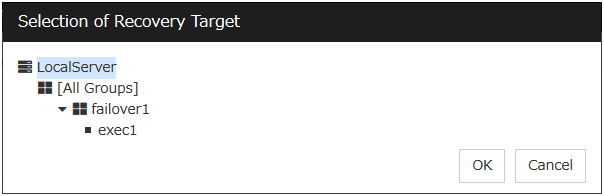
Recovery Target:
A target is shown, which is to be recovered when it is determined as a resource error.
Browse
Click this button to open the dialog box in which the target resource can be selected. The LocalServer, All Groups and group names and resource names that are registered in the cluster are shown in a tree view. Select the target resource and click OK.
Recovery Script Execution Count (0 to 99)
Specify the number of times to allow execution of the script configured by Script Settings when an error is detected. If this is set to zero (0), the script does not run.
Execute Script before Reactivation
When selected:
A script/command is executed before reactivation. To configure the script/command setting, click Script Settings.
When cleared:
Any script/command is not executed.
Maximum Reactivation Count (0 to 99)
Specify how many times you allow reactivation when an error is detected. If this is set to zero (0), no reactivation is executed. This is enabled when a group or group resource is selected as a recovery target.
Execute Script before Failover
Not used.
Maximum Failover Count
Not used.
Execute Script before Final Action
Select whether script is run or not before executing final action.
When selected:
A script/command is run before executing final action. To configure the script/command setting, click Script Settings.
When cleared:
Any script/command is not run.
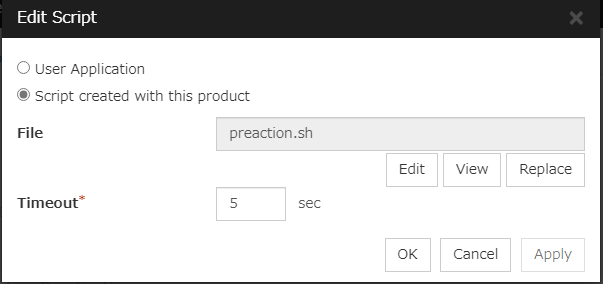
When clicking Script Settings of Execute Script before Final Action, Edit Script dialog box is displayed. Set script or script file, and click OK.
Script Settings
Click here to display the Edit Script dialog box. Configure the recovery or pre-recovery action script or commands.
User Application
Use an executable file (executable shell script file or execution file) on the server as a script. For the file name, specify an absolute path or name of the executable file of the local disk on the server. If there is any blank in the absolute path or the file name, put them in double quotation marks ("") as follows.
Example:
"/tmp/userapplication/script.sh"
These executable files are not included in the configuration data of the Cluster WebUI. As the files cannot be edited or uploaded, they are necessary to be prepared on the server.
Script created with this product
Use a script file which is prepared by the Cluster WebUI as a script. You can edit the script file with the Cluster WebUI if you need. The script file is included in the configuration data.
File (within 1,023 bytes)
Specify the script to be executed (executable shell script file or execution file) when selecting User Application.
View
Click here to display the script file when you select Script created with this product.
Edit
Click here to edit the script file when you select Script created with this product. Click Save to apply the change. You cannot modify the name of the script file.
Replace
Click here to replace the content of the script file with that of the script file you selected in the file selection dialog box, when Script created with this product is selected. You cannot replace the script file if it is currently displayed or edited. Select a script file only. Do not select binary files (applications), and so on.
Timeout (1 to 99)
Specify the maximum time to wait for completion of script to be executed. The default value is set as 5.
Final Action:
Select the recovery action to perform after a recovery attempt through reactivation fails.
Select the final action from the following:
No Operation
No action is taken.
Note
Select No Operation only when temporarily canceling the final action,displaying only an alert when an error is detected, and executing the final action by multi target monitor resource.
Stop Resource
When a group resource is selected as a recovery target, the selected group resource and group resources that depend on the selected group resource are stopped.
This option is disabled when "LocalServer", "All Groups", or a group is selected.
Stop Group
When a group is selected as a recovery target, that group is stopped. When a group resource is selected as a recovery target, the group that the group resource belongs is stopped. When "All Groups" is selected, stop all the groups running on the server of which the monitor resource has detected errors. This option is disabled when a cluster is selected as a recovery target.
Stop cluster service
EXPRESSCLUSTER X SingleServerSafe is stopped.
Stop cluster service and shut down OS
EXPRESSCLUSTER X SingleServerSafe is stopped, and the OS is shut down.
Stop cluster service and reboot OS
EXPRESSCLUSTER X SingleServerSafe is stopped, and the OS is rebooted.
sysrq Panic
Performs the sysrq panic.
Note
If performing the sysrq panic fails, the OS is shut down.
Keepalive Reset
Resets the OS using the clpkhb or clpka driver.
Note
If resetting keepalive fails, the OS is shut down.
Do not select this action on the OS and kernel where the clpkhb and clpka drivers are not supported.
Keepalive Panic
Performs the OS panic using the clpkhb or clpka driver.
Note
If performing the keepalive panic fails, the OS is shut down.
Do not select this action on the OS and kernel where the clpkhb and clpka drivers are not supported.
BMC Reset
Hard-reboots the server.
Note
Failing in this action leads to shutting down the OS.
BMC Power Off
Turns off the server. May shut down the OS due to its ACPI configuration.
Note
Failing in this action leads to shutting down the OS.
BMC Power Cycle
Power-cycles (turns off and then back on again) the server. May shut down the OS due to its ACPI configuration.
Note
Failing in this action leads to shutting down the OS.
BMC NMI
Generates an NMI for the server. The behavior after that depends on the OS configuration.
Note
Failing in this action leads to shutting down the OS.
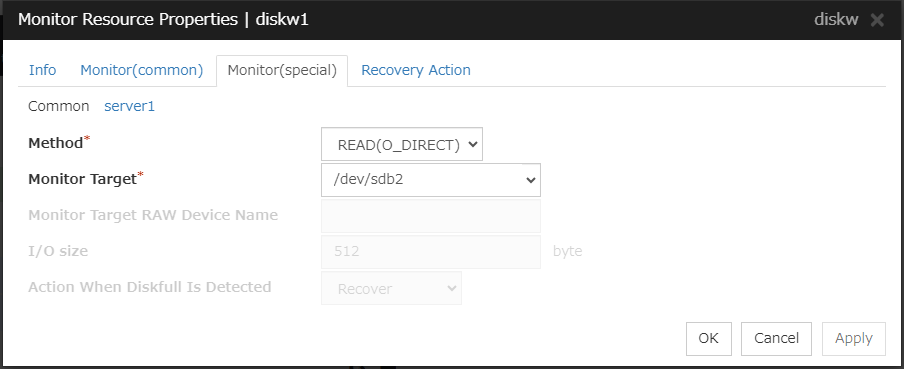
Specify how you want to monitor a disk device from one of the following options.
TUR
TUR(generic)
TUR(legacy)
READ
READ (O_DIRECT)
WRITE (FILE)
READ (RAW)
Monitor Target (within 1,023 bytes)
When the monitoring method is WRITE (FILE):
Specify the path name of the file to be monitored. This must start with "/".
Specify the file name with the absolute path. If you specify the file name of an existing file, it is overwritten and the data in the file is lost.
When the monitoring method is READ (O_DIRECT)
Specify the path name of the file to be monitored. This must start with "/".
Specify the file name with the absolute path. If you specify the file name of an existing file, it is overwritten and the data in the file is lost.
When the monitoring method is READ (RAW)
The monitor target may be omitted. However, the monitor target raw device name must be specified. Specify this mode only when binding and monitoring the device. It is not possible to specify the device name for a partition device that has been mounted or will possible be mounted for monitoring.
In addition, a whole device (whole disk) of a partition device that has been mounted or will possibly be mounted cannot be specified for monitoring. Allocate a partition dedicated to monitoring. (Allocate 10 MB or more to the monitoring partition). The partition must start with "/".
When the monitoring method is other than the above
When the monitoring method is other than the above: This must start with "/".
Monitor Target RAW Device Name (within 1,023 bytes)
This is specifiable only when the monitoring method is READ (RAW).
When the monitoring method is READ (RAW)
Enter a device name for raw accessing. Any raw device already registered with the Disk I/F List of the server properties is unregisterable.
I/O size (1 to 99,999,999)
Specify the size of I/O for reading or reading/writing when READ or WRITE (FILE) is selected as a monitoring method.
When READ (RAW) or READ(O_DIRECT) is specified, the I/O size text box is dim. A single sector is read from the target device.
If TUR, TUR (generic), or TUR (legacy) is specified, this setting is ignored.
Action When Diskfull is Detected
Select the action when diskfull (state in which the disk being monitored has no free space) is detected.
Recover
The disk monitor resource recognizes an error upon the detection of disk full.
Do not recover
The disk monitor resource recognizes a caution upon the detection of disk full.
If READ, READ (RAW), READ (O_DIRECT), TUR, TUR (generic), or TUR (legacy) is specified, the Action when diskfull is detected option is grayed out.
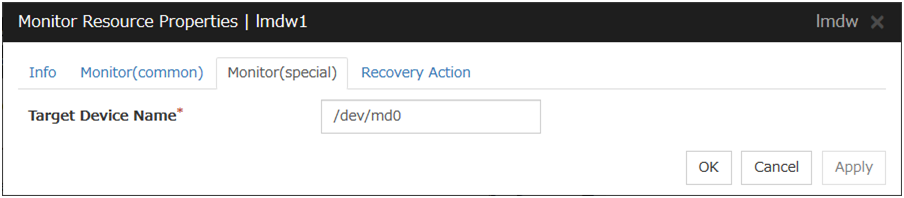
When a local disk is specified in Target Device Name, a local disk on the server can be monitored.
Example of settings to monitor the local disk /dev/sdb by using the READ method, and to reboot the OS when an error is detected:
Setting item
Value
Remarks
Target Device Name:
/dev/sdb
SCSI disk in the second machine.
Monitor Method:
READ
READ method.
Recovery Target:
server
-
Final Action:
The service will be stopped and the OS will be restarted
Reboot the OS.
Example of settings to monitor the local disk /dev/sdb by using the TUR(generic) method and select No Operation (merely show an alert on the Cluster WebUI) when an error is detected:
Two ways of monitoring are employed by the disk monitor resource: READ and TUR.
Notes on TUR:
You cannot run the Test Unit Ready or SG_IO command of SCSI on a disk or disk interface (HBA) that does not support it.
Even if your hardware supports this command, consult the driver specifications because the driver may not support it.
ioctl may be incorrectly executed for an LVM logical volume (LV) device. Use READ for LV monitoring.
A TUR method cannot be used for the IDE interface disk.
In the case of the disk of S-ATA interface, it may be recognized as the IDE interface disk (hd) or as the SCSI interface disk (sd) depending on the type of a disk controller and the distribution to be used. When the disk is recognized as the IDE interface, no TUR methods can be used. If the disk is recognized as the SCSI interface, TUR (genetic) cannot be used but TUR (legacy) can be used.
Test Unit Ready, compared to Read, burdens OS and disks less.
In some cases, Test Unit Ready may not be able to detect actual errors in I/O to media.
You cannot use a partition on the disk by setting it as the target to be monitored. A whole device (whole disk) must be specified.
Some disk devices may temporarily return Unit Attention at TUR issue, depending on the device status.
The temporary return of Unit Attention does not signify a problem. If the TUR retry count is set to 0, however, the above return is determined to be an error and the disk monitor resource becomes abnormal.
To avoid this meaningless error detection, set the retry count to one or more.
TUR monitoring provides the following three choices.
TUR
ioctl is used by the following steps and the status of the device is determined by the result of the command:
Run the ioctl (SG_GET_VERSION_NUM) command. The status is determined by the return value of ioctl and the version of SG driver.
If the ioctl command runs successfully and the version of SG driver is 3.0 or later, execute ioctl TUR (SG_IO) using the SG driver.
If the ioctl command fails or the version of SG driver is earlier than 3.0, execute ioctl TUR which is defined as a SCSI command.
TUR(legacy)
Monitoring is performed by using ioctrl (Test Unit Ready). Test Unit Ready (TUR) which is defined as a SCSI command is used against the specified device, and the status of the device is determined by the result of the command.
TUR(generic)
Monitoring is executed by using ioctl TUR (SG_IO). ioctl TUR (SG_IO) which is defined as a SCSI command is used against the specified device, and the status of the device is determined by the result of the command. Even with a SCSI disk, SG_IO may not work successfully depending on the OS or distribution.
READ monitoring is performed as described below.
The specified size of the specified device (disk device or partition device) or file is read. Judgment is performed by the size that could be read.
Dummy Read reads the specified size data on the specified device (disk device or partition device). Based on the result (the size of data actually read), the status is judged.
Dummy Read is for determining if the specified size of data can be read. Validity of the data read is not judged.
Burden of the load experienced by the OS and disk is proportional to the size of the data on the specified disk to be read.
READ (O_DIRECT) monitoring is performed as described below.
A single sector on the specified device (disk device or partition device) or the file are read without using the cache (O_DIRECT mode), and the result (the size of the data successfully read) is used to make a judgment.
Judgment is based on whether or not reading has been performed successfully. Validity of the read data is not judged.
READ (RAW) monitoring is performed as described below.
Reading is monitored for the specified device without using the OS cache, in the same way as READ (O_DIRECT).
Judgment is based on whether or not reading has been performed successfully. Validity of the read data is not judged.
When the READ (raw) monitoring method is specified, partitions that have been or will possibly be mounted cannot be monitored. In addition, a whole device (whole disk) that includes partitions that have been or will possibly be mounted cannot be monitored. Allocate a partition dedicated to monitoring and specify it as the disk monitor resource. (Allocate 10 MB or more to the monitoring partition).
WRITE (FILE) monitoring is performed as described below.
The file of the specified path is created, written, and deleted to be judged.
Validity of the written data is not judged.
6.3.3. I/O size when READ is selected for disk monitor resources
Enter the size of data when READ is selected as a method of monitoring.
Depending on the shared disk and interfaces in your environment, various caches for reading may be implemented. Because of this, when the specified read size is too small, READ may hit in cache, and may not be able to detect read errors.
When you specify a READ I/O size, verify that READ can detect I/O errors on the disk with that size by intentionally creating I/O errors.
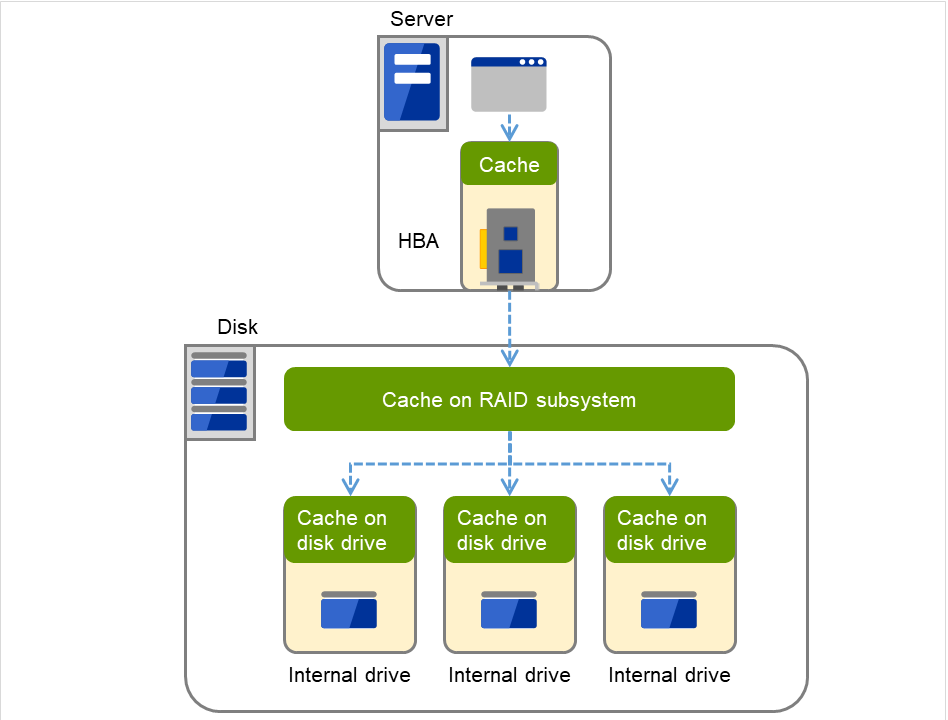
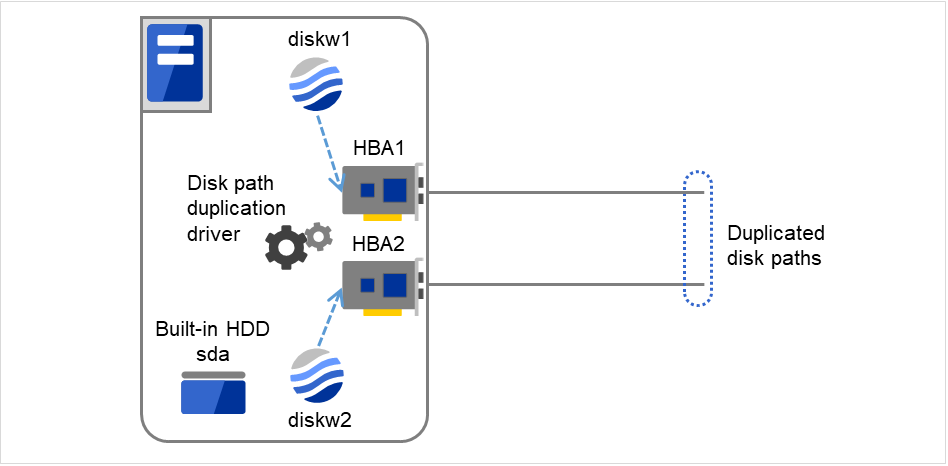
The following diagram shows two servers connected to a shared disk.
There is a cache in the interface adaptor (HBA in the figure) such as SCSI or Fibre Channel.
A cache exists on the RAID subsystem in the shared disk.
There are also caches on each disk drive within the array disk.
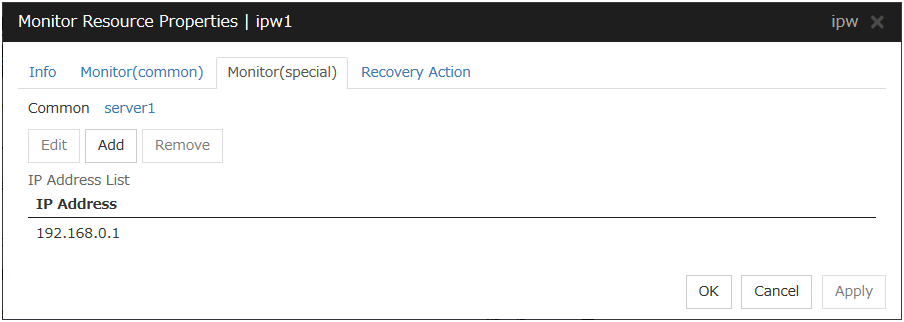
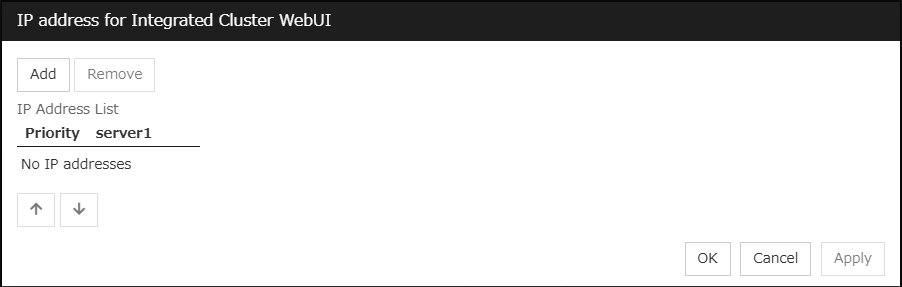
IP addresses to be monitored are listed in IP Addresses.
Add
Click Add to add an IP address to be monitored. Click Edit to display the IP Address Settings dialog box.
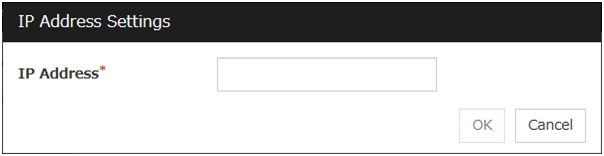
IP Address (within 255 bytes )
Enter an IP address or a host name to be monitored in this field and click OK. The IP address or host name you enter here should be the one that exists on the public LAN. If you set the host name, set the name resolution to OS. (ex. By adding entry to /etc/hosts)
Remove
Click Remove to remove an IP address selected in IP Addresses from the list so that it will no longer be monitored.
Edit
Click Edit to display the IP Address Settings dialog box. The dialog box shows the IP address selected in IP Addresses on the Parameter tab. Edit the IP address and click OK.
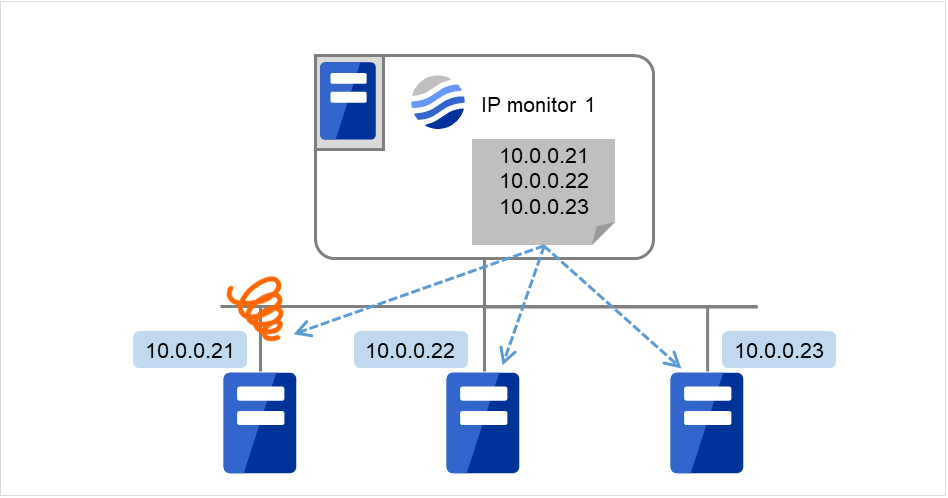
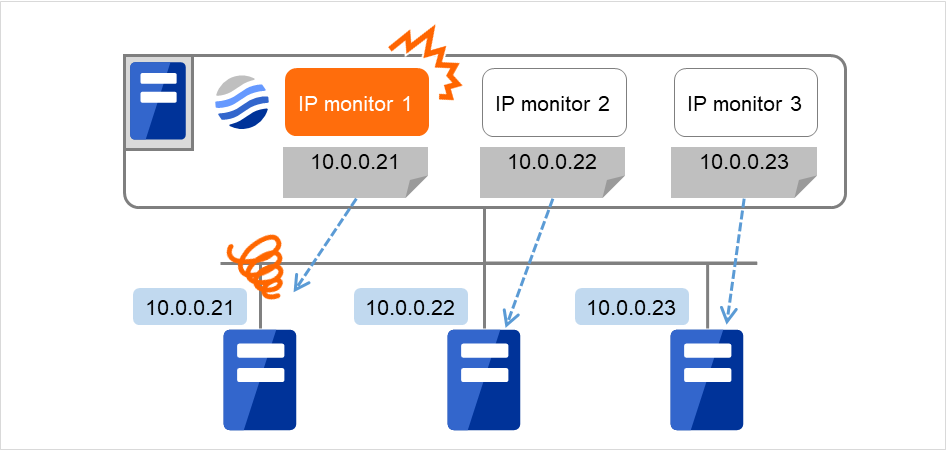
IP monitor resource monitors specified IP addresses by using the ping command. If all IP addresses do not respond, the status is determined to be error.
If you want to establish error when all of the multiple IP addresses have error, register all those IP addresses with one IP monitor resource.
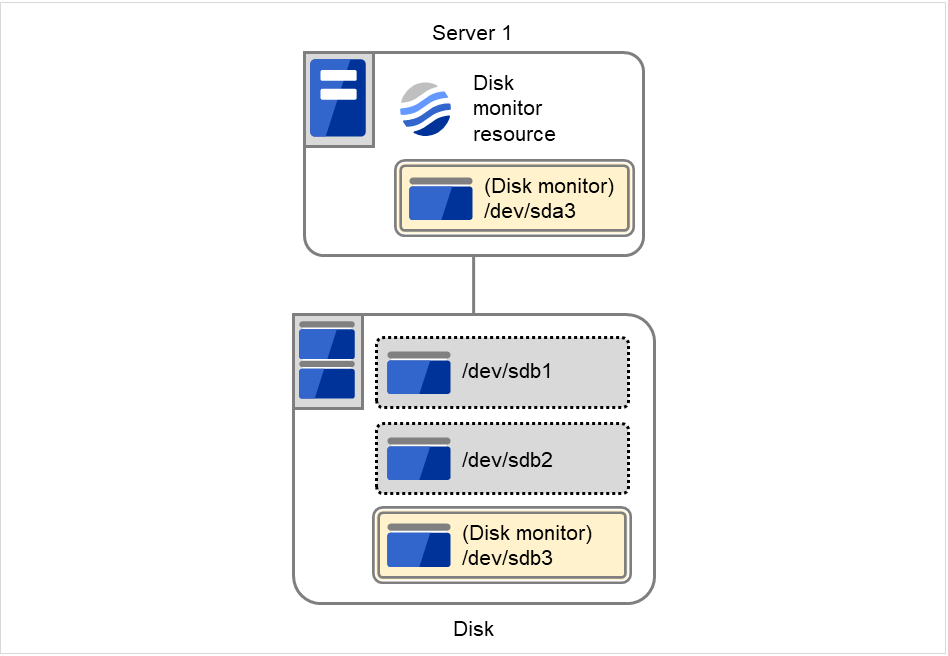
The following figure is an example where all the IP addresses are registered with one IP monitor resource.
If any one of the specified IP addresses is normal, IP monitor 1 is determined to be normal.
Fig. 6.4 Registering all the IP addresses with one IP monitor resource (in a normal case)
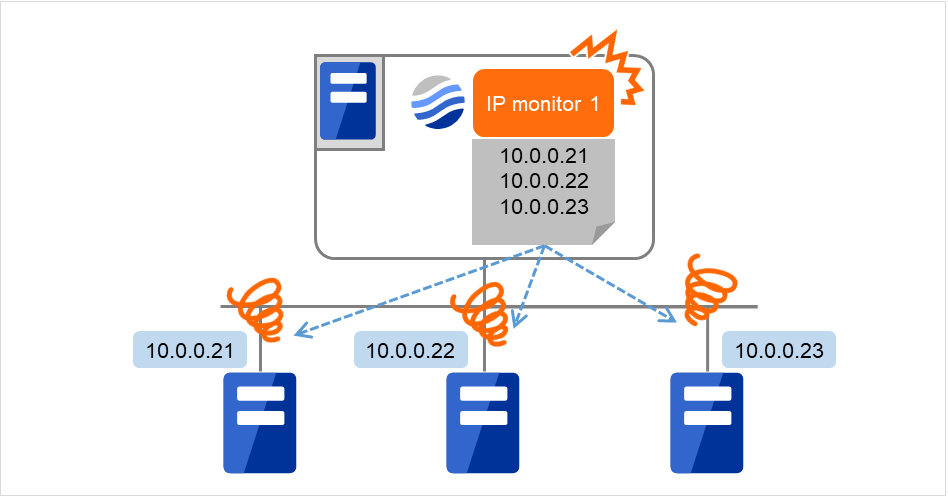
The following figure is an example where all the IP addresses are registered with one IP monitor resource.
If all of the specified IP addresses have an error, IP monitor 1 is determined to have an error.
Fig. 6.5 Registering all the IP addresses with one IP monitor resource (when an error is detected)
If you want to establish error when any one of IP addresses has an error, create one IP monitor resource for each IP address.
The following figure is an example where a different IP address is registered with each of the IP monitor resources.
If the specified IP addresses have an error, the IP monitor (IP monitor 1 in the figure) is determined to have an error.
Fig. 6.6 Registering a different IP address with each of the IP monitor resources (when an error is detected)
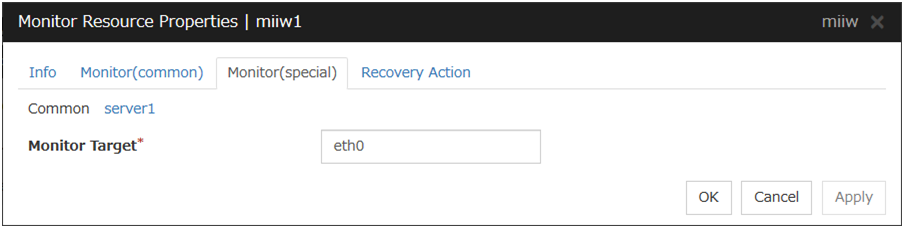
6.6. Setting up NIC Link Up/Down monitor resources
NIC Link Up/Down monitor resource obtains the information on how the specified NIC is linked monitors the linkage is up or down.
Enter the name of the NIC interface you want to monitor. You can monitor Bond devices (e.g. bond.600) and team devices (e.g. team0). You can also monitor VLAN and tagVLAN (setting example: eth0.8).
6.6.2. System requirements for NIC Link Up/Down monitor resources
Network interfaces supporting NIC Link UP/Down monitor resource
NIC Link UP/Down monitor resource has been tested to work in the following network interfaces.
Ethernet Controller(Chip)
Bus
Driver version
Intel 82557/8/9
PCI
3.5.10-k2-NAPI
Intel 82546EB
PCI
7.2.9
Intel 82546GB
PCI
7.3.20-k2-NAPI
7.2.9
Intel 82573L
PCI
7.3.20-k2-NAPI
Intel 80003ES2LAN
PCI
7.3.20-k2-NAPI
Broadcom BCM5721
PCI
7.3.20-k2-NAPI
6.6.3. Notes on NIC Link Up/Down monitor resources
Some NIC boards and drivers do not support required ioctl( ).
The propriety of a NIC Link Up/Down monitor resource of operation can be checked by the ethtool command which each distributor offers.
When the LAN cable link status ("Link detected: yes") is not displayed as the result of the ethtool command:
It is highly likely that NIC Link Up/Down monitor resource of EXPRESSCLUSTER is not operable. Use IP monitor resource instead.
When the LAN cable link status ("Link detected: yes") is displayed as the result of the ethtool command:
In most cases NIC Link Up/Down monitor resource of EXPRESSCLUSTER can be operated, but sometimes it cannot be operated.
Particularly in the following hardware, NIC Link Up/Down monitor resource of EXPRESSCLUSTER may not be operated. Use IP monitor resource instead.
When hardware is installed between the actual LAN connector and NIC chip such as a blade server
When you check if NIC Link Up/Down monitor resource can be used with the use of EXPRESSCLUSTER on a machine for production environment, follow the steps below.
Register NIC Link Up/Down monitor resource with the configuration data.
Select No Operation for the configuration of recovery operation of NIC Link Up/Down monitor resource upon error detection.
Start the server.
Check the status of NIC Link Up/Down monitor resource.
If the status of NIC Link Up/Down monitor resource is abnormal while LAN cable link status is normal, NIC Link Up/Down monitor resource cannot be used.
If NIC Link Up/Down monitor resource status becomes abnormal when LAN cable link status is made abnormal status (link down status), NIC Link Up/Down monitor resource can be used.
If the status remains to be normal, NIC Link Up/Down monitor resource cannot be used.
6.6.4. Configuration and range of NIC link up/down monitoring
An error detected by the NIC Link Up/Down monitoring can be caused by several factors.
If an error occurs when a server and a network device are connected via a LAN cable, the cable may have come out of the server.
On the contrary, the cable may have come out of the network device.
Or, a power supply interruption of the network device may be a cause.
Fig. 6.7 NIC Link Up/Down monitoring and error occurrence factors
The ioctl( ) to the NIC driver is used to find how the server is linked to the network.
(For the IP monitoring, the status is judged by the ping response from the specified IP address.)
When you are monitoring any NIC directly connected to another server by using a LAN cable, an error is detected if the other server goes down (because a link cannot be established).
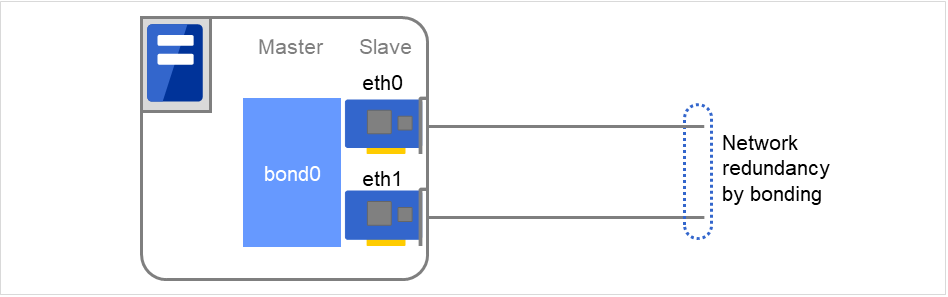
When the network is employing bonding, both the slave interface (eth0, eth1...) and master interface (bond0...) may also be subject to monitoring, making the availability of bonding valid. In that case, the following settings are recommended.
Slave interface
Recovery on error detection: Nothing
If only one cable (eth0) fails, EXPRESSCLUSTER does not perform a recovery action and just outputs an alert.
Network recovery is handled by bonding.
Master interface
Recovery on error detection: Shutdown or another setting
If all slave interfaces fail (the master interface goes down), EXPRESSCLUSTER performs a recovery action.
In the figure below, slave interfaces eth0 and eth1 are combined by bonding to constitute a master interface bond0.
If eth0 is faulty, a bonding driver performs degeneration or switching.
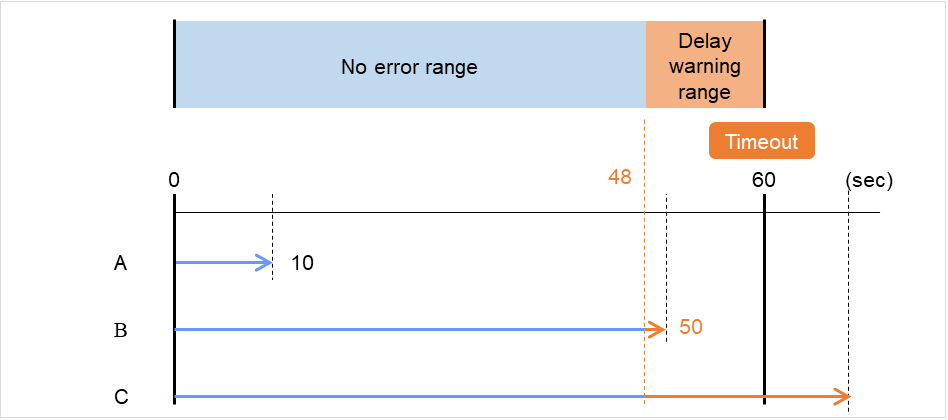
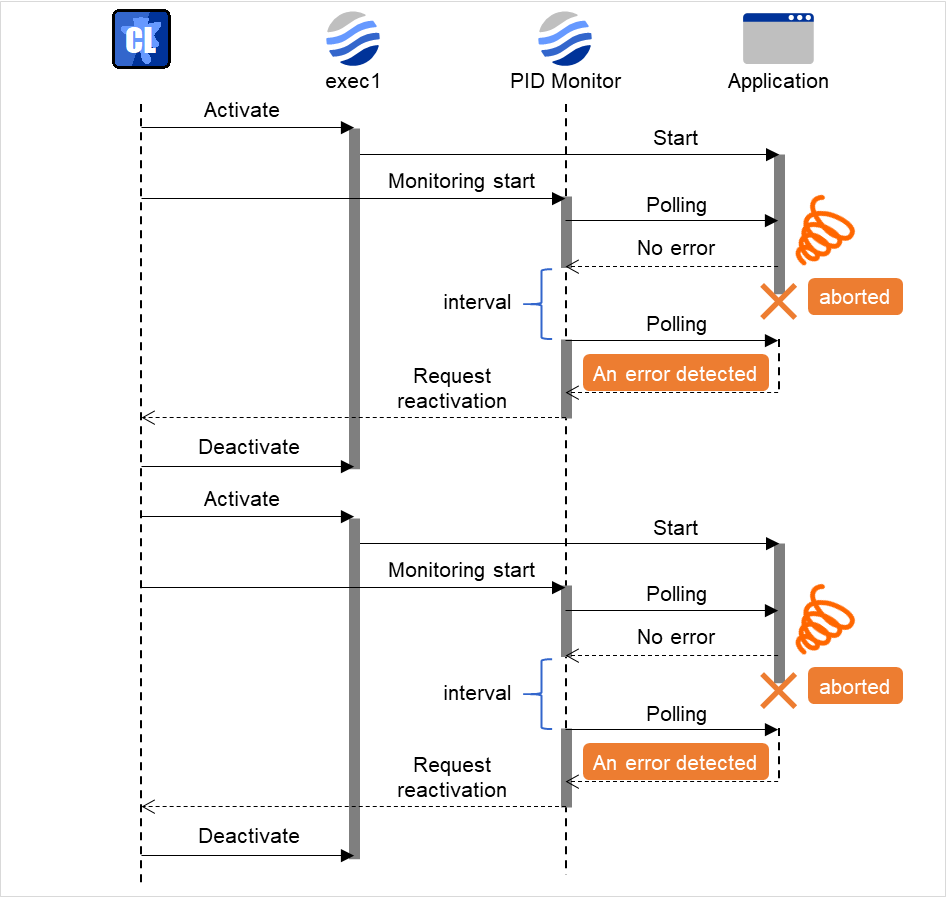
PID monitor resource monitors a successfully activated EXEC resource. By monitoring the presence of process ID, an error is established when the process ID disappears.
The EXEC resource to be monitored is set according to the steps described in "Target Resource" of "6.2.Monitor resource properties". The EXEC resource can be monitored if its settings for activation are configured to Asynchronous. You cannot detect stalled status of the process.
Note
To monitor for the stalling of components such as databases, samba, apache, sendmail, purchase EXPRESSCLUSTER monitoring options.
PID monitor resource monitors a successfully activated EXEC resource. The EXEC resource can be monitored if its settings for activation are configured to Asynchronous.
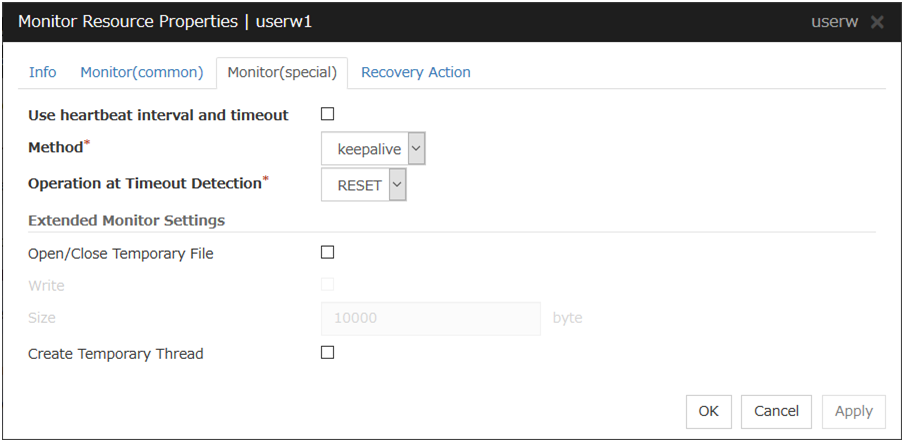
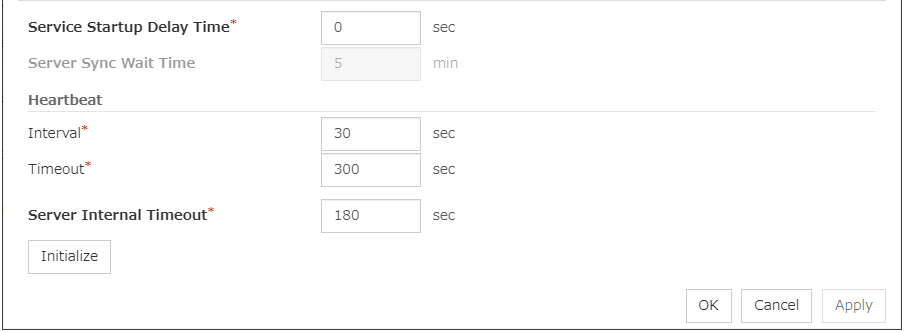
Select this check box if you use heartbeat's interval and timeout for monitor's interval and timeout.
When selected:
Heartbeat interval and timeout are used.
When cleared:
Interval and timeout specified on the Monitor tab are used. You need to set a larger value for timeout than interval. When ipmi is specified as the monitoring method, the timeout time must be 255 or less.
Method
Choose how you want to monitor the user-mode monitor resource from the following. You can not select a method which has already been used for other user-mode monitor resource.
softdog
The softdog driver is used.
ipmi
The OpenIPMI is used.
keepalive
The clpkhb and clpka drivers are used.
none
Uses nothing.
Operation at Timeout Detection
Select the final action.
RESET
Resets the server.
PANIC
Performs a panic of the server. This can be set only when the monitoring method is keepalive.
NMI
NMI occur on the server. This can be set only when the monitoring method is ipmi.
Open/Close Temporary File
Select this check box if you want to Open/Close Temporary File at every interval when you execute monitoring.
When selected:
A temporary file will be opened/closed.
When cleared:
A temporary file will not be opened/closed.
Write:
Select this check box if you have chosen to Open/Close Temporary File and want to write in temporary data.
When selected:
Temporary data is written into a temporary file.
When cleared:
Temporary data is not written into a temporary file.
Size (1 to 9,999,999)
If you have chosen to write temporary data into a temporary file, specify the size to write in.
Create Temporary Thread
Select this check box if you want to create temporary thread when monitoring is performed.
Also check this information before applying a security patch released by the distributor to a server already in operation (kernel upgrade).
Monitor by: none
"none" is a monitoring method is used for evaluation. This only executes operations of the advanced settings of the user-mode monitor resource. Do not use this in a production environment.
6.8.5. Advanced settings for user-mode monitor resources
Opening/closing of a temporary file, writing to a temporary file and creating a temporary thread are the configurations that allow advance user-mode monitor resource. If any of these configurations fail, the timer will not be updated. If a configuration continues to fail for the time period set for the timeout or heartbeat timeout, the OS is reset.
Open/Close Temporary File
A temporary file is created, opened, closed and then deleted at every monitoring interval repeatedly.
When this advanced function is set and there is no free disk space, opening the temporary file fails and the OS is reset.
Write data into a dummy file
A specified size of data is written into a temporary file at every monitoring interval.
This advanced function is not available unless opening/closing a temporary file is set.
Create dummy thread
A temporary thread is created at every monitoring interval.
The following sections describe how processes and features differ by ways of monitoring. For the shutdown monitoring, only Step 1 in each process overview is performed.
Monitor by: ipmi
Process overview
Following steps below from 2 to 7 are repeated.
Set the IPMI timer
Open() a dummy file
Execute write() to the dummy file
Execute fdatasync() to the dummy file
Close() the dummy file
Create a dummy thread
Refresh the IPMI timer
Steps 2 to 6 of the process overview are for advanced settings. To execute these steps, you need to configure each setting.
When a timeout does not occur (steps 2 to 7 above are performed without any problem):
No recovery action, including a reset, is performed.
When a timeout occurs (when any of steps 2 to 7 above is stopped or delayed):
A reset is performed by using BMC (the server's internal management function).
Advantages
BMC (the server's internal management function) is used, so the kernel space is unlikely to fail and the possibility of a successful reset is high.
Disadvantages
Due to the dependency on the hardware, this method is unusable on a server that does not support IPMI or is unable to run OpenIPMI.
This method cannot be used on a server on which ESMPRO/ServerAgent is used.
It might not be possible to use this method together with server monitoring software provided by another server vendor.
Monitor by: softdog
Process overview
Following steps below from 2 to 7 are repeated.
Set up softdog
Open() a dummy file
Execute write() to the dummy file
Execute fdatasync() to the dummy file
Close() the dummy file
Create a dummy thread
Refresh the softdog timer
Steps 2 to 6 of the process overview are for advanced settings. To execute these steps, you need to configure each setting.
When a timeout does not occur (steps 2 to 7 above are performed without any problem):
No recovery action, including a reset, is performed.
When a timeout occurs (when any of steps 2 to 7 above is stopped or delayed):
A reset is performed by softdog.ko.
Advantages
Because it does not depend on the hardware, this method can be used if the softdog kernel module is available.
(Some distributions do not include softdog by default, so check whether softdog exists before setting it up.)
Disadvantages
Because softdog depends on the timer logic of the kernel space, a reset might not be performed if an error occurs in the kernel space.
Monitoring by: keepalive
Process overview
Following steps below from 2 to 7 are repeated.
Set the keepalive timer
Open() a dummy file
Execute write() to the dummy file
Execute fdatasync() to the dummy file
Close() the dummy file
Create a dummy thread
Update the keepalive timer
Steps 2 to 6 of the process overview are for advanced settings. To execute these steps, you need to configure each setting.
When a timeout does not occur (steps 2 to 7 above are performed without any problem):
No recovery action, including a reset, is performed.
When a timeout occurs (i.e. any of Steps 2 to 7 is stopped or delayed):
A reset or panic is generated by clpka.ko according to the action setting.
Advantages
A panic can be specified as the action.
Disadvantages
The distributions, architectures, and kernel versions (provided drivers) for which keepalive can operate are restricted.
Because clpka is dependent on the timer logic of the kernel space, reset may not be performed if an error occurs in the kernel space.
When configuration information is created using the Cluster WebUI, a user-mode monitor resource is automatically created using the softdog monitoring method.
User-mode monitor resources with different monitoring methods can be added. A user-mode monitor resource that was automatically created using the softdog monitoring method can be deleted.
When a user-mode monitor resource fails to activate because, for example, the softdog driver of the OS does not exist, the clpkhb or clpka driver of EXPRESSCLUSTER does not exist, or the OpenIPMI rpm file has not been installed, the message "Monitor userw failed." is displayed in the Alert logs of the Cluster WebUI. In Cluster WebUI or information displayed by the clpstat command, Normal is displayed as the resource status and Offline is displayed as the server status.
When server monitoring software provided by another server vendor such as ESMPRO/ServerAgent is used, do not select IPMI as the monitoring method.
Such server monitoring software and OpenIPMI both use BMC (Baseboard Management Controller) on the server, which causes a conflict and makes monitoring impossible.
Use an executable file (executable shell script file or execution file) on the server as a script. For the file name, specify an absolute path or name of the executable file of the local disk on the server.
These executable files are not included in the configuration data of the Cluster WebUI. They must be prepared on the server because they cannot be edited or uploaded by the Cluster WebUI.
Script created with this product
Use a script file which is prepared by the Cluster WebUI as a script. You can edit the script file with the Cluster WebUI if you need. The script file is included in the configuration data.
File (within 1,023 bytes)
Specify the script to be executed (executable shell script file or execution file) when you select User Application with its absolute path on the local disk of the server.
View
Click here to display the script file when you select Script created with this product.
Edit
Click here to edit the script file when you select Script created with this product. Click Save to apply the change. You cannot modify the name of the script file.
Replace
Click here to replace the content of the script file with that of the script file you selected in the file selection dialog box, when Script created with this product is selected. You cannot replace the script file if it is currently displayed or edited. Select a script file only. Do not select binary files (applications), and so on.
Monitor Type
Select a monitor type.
Synchronous (default)
Custom monitor resources regularly run a script and detect errors from its error code.
Asynchronous
Custom monitor resources run a script upon start monitoring and detect errors if the script process disappears.
Wait a period of time for Application/Script monitor to start (0 to 9999)
Specify the delay time from the start of the application/script and that of monitoring for the Asynchronous monitor type. This delay value must be set smaller than the timeout value specified under the Monitor (common) tab.
Note
The set value becomes valid next time you start the monitor.
Default value: 0
Log Output Path (within 1,023 bytes)
Specify log output path for the script of custom monitor resource.
Pay careful attention to the free space in the file system because the log is output without any limitations when the file name is specified and the Rotate Log check box is unchecked.
When the Rotate Log check box is checked, output log files are rotated.
Rotate Log
Turn this off to output execution logs of scripts and executable files with no limit on the file size. Turn it on to rotate and output the logs. In addition, note the following.
Enter the log path in 1009 bytes or less in Log Output Path. If the path exceeds 1009 bytes, the logs are not output.
The log file name must be 31 bytes or less. If the name exceeded 32 bytes, the logs are not output.
If some custom monitor resources are configured to rotate logs, and the log file names are the same but the log paths are different, the Log Rotate Size may be incorrect.
Specify a file size for rotating files when the Rotate Log check box is checked.
The log files that are rotated and output are configured as described below.
File name
Description
Log Output Path specified_file_name
Latest log file.
Log Output Path specified_file_name.pre
Former log file that has been rotated.
Normal Return Value (within 1,023 bytes)
When Asynchronous is selected for Monitor Type, set the values of script error code to be determined as normal. If you want to set two or more values here, separate them by commas like 0,2,3 or connect them with a hyphen to specify the range like 0-3.
Default value: 0
Warning Return Value (within 1,023 bytes)
When Asynchronous is selected for Monitor Type, set the values of script error code to be determined as warning. If you want to set two or more values here, separate them by commas like 0,2,3 or connect them with a hyphen to specify the range like 0-3.
If Warning Return Value is set to the same value as Normal Return Value, it is regarded as normal.
Wait for activation monitoring to stop before stopping the cluster
The cluster stop waits until the custom monitor resource is stopped. This is effective only when the monitoring timing is set to Active.
When the monitor type is Asynchronous, and the monitoring retry count is set to 1 or more, monitoring cannot be performed correctly. When you set the monitor type to Asynchronous, also specify 0 as the monitoring retry count.
When the Script Log Rotate function is enabled, a process is generated to mediate the log output. This intermediate process continues to work until the file descriptor is closed (i.e. until all the logs stop being output from the start and stop scripts and from a descendant process that takes over the standard output and/or the standard error output from the start and stop scripts). To exclude output from the descendant process from the log, redirect the standard output and/or the standard error output when the process is generated with the script.
Monitor resources are grouped and the status of the group is monitored. You can register up to 64 monitor resources in the Monitor Resources.
When the only one monitor resource set in the Monitor Resources is deleted, the multi target monitor resource is deleted automatically.
Add
Click Add to add a selected monitor resource to Monitor Resources.
Remove
Click Remove to delete a selected monitor resource from Monitor Resources.
Tuning
Open Multi Target Monitor Resource Tuning Properties dialog box. Configure detailed settings for the multi target monitor resource.
Multi Target Monitor Resource Tuning Properties
Parameter tab
Detailed setting for parameter is displayed.
Error Threshold
Select the condition for multi target monitor resources to be determined as an error.
Same as Number of Members
The status of multi target monitor resources becomes "Error" when all monitor resources specified to be under the multi target monitor resource are failed, or when "Error" and "Offline" co-exist.
The status of multi target monitor resources becomes "Normal" when the status of all monitor resources specified to be under the multi target monitor resource are "Offline."
Specify Number
The status of multi target monitor resources becomes "Error" when the number of monitor resources specified in Error Threshold becomes "Error" or "Offline".
Specify how many of the monitor resources specified under the multi target monitor resource need to have the "Error" or "Offline" status before the status of the multi target monitor resource is judged to be "Error."
This can be set when Specify Number is selected for Error Threshold.
Warning Threshold
When selected:
When the status of some monitor resources among those specified to be under the multi target monitor resource, specify how many monitor resources need to be "Error" or "Offline" to determine that the status of multi target monitor resource is "Caution."
When cleared:
Multi target monitor resources do not display an alert.
Initialize
Used for initializing the value to the default value. Click Initialize to initialize all the items to their default values.
The multi target monitor resources regard the offline status of registered monitor resources as being an error. For this reason, for a monitor resource that performs monitoring when the target is active is registered, the multi target monitor resource might detect an error even when an error is not detected by the monitor resource. Do not, therefore, register monitor resources that perform monitoring when the target is active.
The status of the multi target monitor resource is determined by the status of registered monitor resources.
The table below describes status of multi target monitor resource when the multi target monitor resource is configured as follows:
The number of registered monitor resources 2
Error threshold 2
Warning threshold 1
The table below describes status of a multi target monitor resource:
Monitor resource1 status:
normal
(normal)
Monitor resource1 status:
error
(error)
Monitor resource1 status:
Already stopped
(offline)
Monitor resource2 status:
normal
(normal)
normal
(normal)
caution
(caution)
caution
(caution)
Monitor resource2 status:
error
(error)
caution
(caution)
error
(error)
error
(error)
Monitor resource2 status:
Already stopped
(offline)
caution
(caution)
error
(error)
normal
(normal)
Multi target monitor resource monitors status of registered monitor resources.
If the number of the monitor resources with the error status exceeds the error threshold, multi target monitor resource detects an error.
If the number of the monitor resources with the caution status exceeds the caution threshold, the status of the multi target monitor resource becomes caution.
If all registered monitor resources are in the status of stopped (offline), the status of multi target monitor resource becomes normal.
Unless all the registered monitor resources are stopped (offline), the multi target monitor resource recognizes the stopped (offline) status of a monitor resource as error.
If the status of a registered monitor resource becomes error, actions for the error of the monitor resource are not executed.
Actions for error of the multi target monitor resource are executed only when the status of the multi target monitor resource becomes error.
6.12. Example multi target monitor resource configuration
Example of the disk path duplication driver usage
The status can be an error only if disk devices (such as /dev/sdb and /dev/sdc) fail at the same time.
In the figure below, a disk path is duplicated by using two HBAs and a disk path duplication driver.
If one HBA is faulty, the disk path duplication driver performs degeneration or switching of the path.
Fig. 6.9 An example of the disk path duplication driver
Monitor resources to be registered with the multi target monitor resources (mtw1):
diskw1
diskw2
Error Threshold and Warning Threshold of multi target monitor resource (mtw1)
Error threshold 2
Warning threshold 0
Detailed settings of the monitor resource to be registered with the multi target monitor resource (mtw1)
Disk monitor resource (diskw1)
Monitored device name /dev/sdb
Reactivation threshold 0
Failover threshold 0
Final action No Operation
Disk monitor resource (diskw2)
Monitored device name /dev/sdc
Reactivation threshold 0
Failover threshold 0
Final action No Operation
With the settings above, even if either of diskw1 and diskw2, which are registered as monitor resources of the multi target monitor resource detects an error, no actions for the monitor resource having the error are taken.
Actions for an error set to the multi target monitor resource are executed when the status of both diskw1 and diskw2 become error, or when the status of two monitor resources become error and offline.
The software RAID monitor resource is to monitor software RAID devices.
6.13.1. Monitoring by software RAID monitor resources
The software RAID monitor resource is used to monitor software RAID devices by using the md driver. If either disk is faulty and software RAID is degraded, WARNING is issued.
Note
If both disks are faulty, any error cannot be detected; restore the disks when a notification about degradation is posted.
External link monitor resources are passive monitors. They do not perform monitoring by themselves.
When an error message is received from an outside of EXPRESSCLUSTER, the external link monitor resources change their status and perform recovery from the error.
Specify the recovery target and the action upon detecting an error. For external link monitor resources, select Executing recovery script, Restart the recovery target, or Execute the final action as the action to take when an error is detected. However, recovery will not occur if the recovery target is not activated.
Recovery Action
Select the action to take when a monitor error is detected.
Executing the recovery script
Execute the recovery script when a monitor error is detected.
Restart the recovery target
Restart the group or group resource selected as the recovery target when a monitor error is detected.
Execute the final action
Execute the selected final action when a monitor error is detected.
Execute Script before Recovery Action
Executes the script before the operation performed upon error detection selected as the recovery action.
When selected
A script/command is executed before reactivation. To configure the script/command setting, click Settings.
6.14.3. Monitoring by external link monitor resources
When an error message is received from an outside source, the resource recovers the external link monitor resource whose Category and Keyword have been reported. (The Keyword can be omitted.)
If there are multiple external link monitor resources whose monitor types and monitor targets have been reported, each monitor resource is recovered.
The following figure is an example of the configuration where an external link monitor resource is used.
The external link monitor resource, when notified of the occurrence of an error, changes its status and executes the recovery action in response to error detection.
Fig. 6.10 A configuration where an external link monitor resource is used
If an external link monitor resource is paused when an error message is received from outside, error correction is not performed.
If an error message is received from outside, the status of the external link monitor resource becomes "error". The error status of the external link monitor resource is not automatically restored to "normal". To restore the status to normal, use the clprexec command. For details about the clprexec command, see "EXPRESSCLUSTER X SingleServerSafe command reference" in the "EXPRESSCLUSTER X SingleServerSafe Operation Guide".
If an error message is received when the external link monitor resource is already in the error status due to a previous error message, recovery from the error is not performed.
Set the name of the target process. The process name can be obtained by using the ps(1) command.
Wild cards can be used to specify a process name by using one of the following three patterns. No other wild card pattern is permitted.
[prefix search] <string included in the process name>*
[suffix search] *<string included in the process name>
[partial search] *<string included in the process name>*
Minimum Process Count (1 to 999)
Set the process count to be monitored for the monitor target process. If the number of processes having the specified monitor target process name falls short of the set value, an error is recognized.
If you set 1 for Minimum Process Count, and if there are two or more processes having the process name specified for the monitor target, only one process is selected under the following conditions and is subject to monitoring.
When the processes are in a parent-child relationship, the parent process is monitored.
When the processes are not in a parent-child relationship, the process having the earliest activation time is monitored.
When the processes are not in a parent-child relationship and their activation times are the same, the process having the lowest process ID is monitored.
If monitoring of the number of started processes is performed when there are multiple processes with the same name, specify the process count to be monitored for Minimum Process Count. If the number of processes with the same name falls short of the specified minimum count, an error is recognized. You can set 1 to 999 for Minimum Process Count. If you set 1, only one process is selected for monitoring.
Up to 1023 bytes can be specified for the monitor target process name. To specify a monitor target process with a name that exceeds 1023 bytes, use a wildcard (*).
If the name of the target process is 1023 bytes or longer, only the first 1023 bytes can be recognized as the process name. If you use a wild card (such as *) to specify a process name, specify a string containing the first 1023 or fewer bytes.
If the name of the target process is long, the latter part of the process name is omitted and output to the log.
If the name of the target process includes double quotations( "" ) or a comma ( , ), the process name might not be correctly output to an alert message.
Check the monitor target process name which is actually running by ps(1) command, etc, and specify the monitor target process name.
From the above command result,"/usr/sbin/htt -retryonerror 0" is specified as monitor target process name in the case of monitoring "/usr/sbin/htt".
The process name specified for the name of the target process specifies the target process, using the process arguments as part of the process name. To specify the name of the target process, specify the process name containing the arguments. To monitor only the process name with the arguments excluded, specify it with the wildcard (*) using right truncation or partial match excluding the arguments.
6.15.3. How process name monitor resources perform monitoring
The process name monitor resource monitors a process having the specified process name. If Minimum Process Count is set to 1, the process ID is identified from the process name and the deletion of the process ID is treated as an error. Process stalls cannot be detected.
If Minimum Process Count is set to a value greater than 1, the number of processes that have the specified process name are monitored. The number of processes to be monitored is calculated using the process name, and if the number falls below the minimum count, an error is recognized. Process stalls cannot be detected.
Select one of the following levels. You cannot omit this level setting.
Level 1 (monitoring by select)
Monitoring with only reference to the monitor table. SQL statements executed for the monitor table are of (select) type.
Level 2 (monitoring by update/select)
Monitoring with reference to and update of the monitoring table. SQL statements executed for the monitor table are of (update/select) type.
If a monitor table is automatically created at the start of monitoring, the SQL statement (create/insert) is executed for the monitor table.
Level 3 (create/drop table each time)
Creation/deletion of the monitor table by statement as well as update. SQL statements executed for the monitor table are of (create / insert / select / drop) type.
Default: Level 2 (monitoring by update/select)
Database Name (within 255 bytes)
Specify the database name to be monitored. Specifying this item cannot be omitted.
Default value: None
Instance (within 255bytes)
Specify the database instance name. Specifying this item cannot be omitted.
Default value: db2inst1
User Name (within 255 bytes)
Specify the user name to log on to the database. Specifying this item cannot be omitted.
Specify a DB2 user accessible to the specified database.
Default value: db2inst1
Password (within 255 bytes)
Specify the password to log on to the database. Specifying this item cannot be omitted.
Default value: None
Table (within 255 bytes)
Specify the name of a monitor table created on the database. Specifying this item cannot be omitted. Make sure not to specify the same name as the table used for operation because a monitor table will be created and deleted. Be sure to set the name different from the reserved word in SQL statements.
Some characters cannot be used to specify a monitor table name according to the database specifications. For details, refer to the database specifications.
Default value: db2watch
Character Set
Specify the character set of DB2. Specifying this item cannot be omitted.
Default value: None
Library Path (within 1,023 bytes)
Specify the home path to DB2. Specifying this item cannot be omitted.
This monitoring resource monitors DB2, using the CLI library of DB2. For this reason, it is required to execute "source instance user home/sqllib/db2profile" as root user. Write this in a start script.
If the code page of the database and the one of this monitor resource differ, this monitor resource cannot access to the DB2 database. Set an appropriate character code as necessary.
To check the code page of database, execute "db2 get db cfg for Database_name" For details, see DB2 manual.
If values of database name, instance name, user name and password specified by a parameter differ from the DB2 environment for monitoring, DB2 cannot be monitored. Error message is displayed. Check the environment.
At "Level 1", a monitor error occurs if there is no monitor table at the start of monitoring. Create a monitor table as shown below.
If there is no monitor table at the start of monitoring in "Level 2", EXPRESSCLUSTER automatically creates the monitor table. In this case, a message indicating that the Cluster WebUI Alert logs does not have the monitor table is displayed.
The load on the monitor at "Level 3" is higher than that at "Level 1" and "Level 2" because the monitor in "Level 3" creates or deletes monitor tables for each monitoring.
Selectable monitor level
Prior creation of a monitor table
Level 1 (monitoring by select)
Required
Level 2 (monitoring by update/select)
Optional
Level 3 (create/drop table each time)
Optional
Create a monitor table using either of the following methods:
Use SQL statements (in the following example, the monitor table is named db2watch)
sql> create table <user_name>.db2watch (num int not null primary key)
sql> insert into db2watch values(0)
sql> commit
Use EXPRESSCLUSTER command
As the prerequisite, setting up the monitor resource must be completed.
6.16.3. How DB2 monitor resources perform monitoring
DB2 monitor resources perform monitoring according to the specified monitor level.
Level 1 (monitoring by select)
Monitoring with only reference to the monitor table. SQL statements executed for the monitor table are of (select) type.
An error is recognized if:
An error message is sent in response to a database connection or SQL statement message
Level 2 (monitoring by update/select)
Monitoring with reference to and update of the monitoring table. One SQL statement can read/write numerical data of up to 10 digits. SQL statements executed for the monitor table are of (update/select) type.
If a monitor table is automatically created at the start of monitoring, the SQL statement (create/insert) is executed for the monitor table.
An error is recognized if:
An error message is sent in response to a database connection or SQL statement message
The written data is not the same as the read data
Level 3 (create/drop table each time)
Creation/deletion of the monitor table by statement as well as update. One SQL statement can read/write numerical data of up to 10 digits. SQL statements executed for the monitor table are of (create / insert / select / drop) type.
An error is recognized if:
An error message is sent in response to a database connection or SQL statement message
The FTP monitor resource is to monitor the FTP service running on a server. FTP monitor resources monitor FTP protocol and they are not intended for monitoring specific applications. FTP monitor resources monitor various applications that use FTP protocol.
Specify the IP address of the FTP server to be monitored. Specifying this item cannot be omitted. If it is multi-directional standby server, specify FIP.
Usually, the FTP server running on the local server is connected, thus the loopback address (127.0.0.1) is to be configured. If accessible addresses are limited by the FTP server settings, specify an accessible address (e.g., floating IP address).
Default value: 127.0.0.1
Port Number (1 to 65,535)
Specify the FTP port number to be monitored. Specifying this item cannot be omitted.
Default value: 21
User Name (within 255 bytes)
Specify the user name to log on to FTP.
Default value: None
Password (Within 255 bytes)
Specify the password to log on to FTP.
Default value: None
Protocol
Select a protocol for communication with the FTP server: FTP (in usual cases) or FTPS (with FTP over SSL/TLS connection required).
Specify the EXEC resource that activates FTP for the target. Monitoring starts after target resource is activated. However, if FTP monitor resources cannot be started immediately after target resource is activated, adjust the time using Wait Time to Start Monitoring.
FTP service may produce operation logs for each monitoring. Configure FTP settings if this needs to be adjusted.
If a change is made to a default FTP message (such as a banner or welcome message) on the FTP server, it may be handled as an error.
Specify the name of the HTTP server to be monitored. Specifying this item cannot be omitted.
Usually, specify the loopback address (127.0.0.1) to connect to the HTTP server that runs on the local server. If the addresses for which connection is possible are limited by HTTP server settings, specify an address for which connection is possible.
Default value: localhost
Protocol
Configure protocol used for communication with HTTP server. In general, HTTP is selected. If you need to connect with HTTP over SSL, select HTTPS.
Default value: HTTP
Note
Using HTTPS requires the OpenSSL library.
Port (1 to 65,535)
You must specify the port number of the HTTP to be monitored. Specifying this item cannot be omitted.
Default value: 80 (HTTP)
443 (HTTPS)
Request URI (within 255 bytes)
Configure the Request URI (e.g, "/index.html").
Default value: None
Request Type
Specify a type of HTTP request for accessing the HTTP server. Setting this parameter is mandatory.
Default value: HEAD
Authentication Method
Specify an authentication method for connecting to the HTTP server.
Default value: No authentication
User Name (within 255 bytes)
Specify a user name for logging in to the HTTP server .
Default value: None
Password (within 255 bytes)
Specify a password for logging in to the HTTP server .
Default value: None
Client Authentication
Enabling this function, which requires selecting HTTPS in Protocol, performs client authentication.
Default value: Disabled
Note
Even if you enable this function for an HTTP server which does not perform client authentication, the operation is not affected.
Private Key (Within 1023 bytes)
Specify the path to a private key file for client authentication. This is required when Client Authentication is enabled.
Default value: None
Client Certificate (Within 1023 bytes)
Specify the path to a client certificate file for client authentication. This is required when Client Authentication is enabled.
For the DIGEST authentication of HTTP monitor resources, the MD5 algorithm is used.
For the client certificate of HTTP monitor resources, Apache HTTP Server can be monitored.
Regarding the private key and client certificate for the client authentication of an HTTP monitor resource, the supported encoding format is PEM.
HTTP requests of HTTP monitor resources are issued through the default ports (HTTP, 80; HTTPS, 443).
If you specify hostname associated with IPv6 address to the Connecting Destination, please make sure you have not disabled IPv6 in the Kernel Boot Options. If it make setting, it may prevents successful monitoring.
IMAP4 monitor resources monitor IMAP4 services that run on the server. IMAP4 monitor resources monitor IMAP4 protocol but they are not intended for monitoring specific applications. IMAP4 monitor resources monitor various applications that use IMAP4 protocol.
Specify the IP address of the IMAP4 server to be monitored. Specifying this item cannot be omitted. If it is multi-directional standby server, specify FIP.
Usually, specify the loopback address (127.0.0.1) to connect to the IMAP4 server that runs on the local server. If the addresses for which connection is possible are limited by IMAP4 server settings, specify an address for which connection is possible.
Default value: 127.0.0.1
Port Number (1 to 65,535)
Specify the port number of the IMAP4 to be monitored. Specifying this item cannot be omitted.
Default value: 143
User Name (within 255 bytes)
Specify the user name to log on to IMAP4.
Default value: None
Password (within 189 bytes)
Specify the password to log on to IMAP4. Click Change and enter the password in the dialog box.
Default value: None
Authentication Method
Select the authentication method to log on to IMAP4. It must follow the settings of IMAP4 being used:
AUTHENTICATE LOGIN (default value)
The encryption authentication method that uses the AUTHENTICATE LOGIN command.
For the target to be monitored, specify the EXEC resource that starts the IMAP4 server. Monitoring starts after the target resource is activated. However, if the IMAP4 server cannot be started immediately after the target resource is activated, adjust the time by using Wait Time to Start Monitoring.
The IMAP4 server might output an operation log or other data for each monitoring operation. If this needs to be adjusted, specify the IMAP4 server settings as appropriate.
Select one of the following levels. You cannot omit this level setting.
Level 1 (monitoring by select)
Monitoring with only reference to the monitor table. SQL statements executed for the monitor table are of (select) type.
Level 2 (monitoring by update/select)
Monitoring with reference to and update of the monitoring table. SQL statements executed for the monitor table are of (update/select) type.
If a monitor table is automatically created at the start of monitoring, the SQL statement (create/insert) is executed for the monitor table.
Level 3 (create/drop table each time)
Creation/deletion of the monitor table by statement as well as update. SQL statements executed for the monitor table are of (create / insert / select / drop) type.
Default: Level 2 (monitoring by update/select)
Database Name (within 255 bytes)
Specify the database name to be monitored. Specifying this item cannot be omitted.
Default value: None
IP Address (within 79 bytes)
Specify the IP address of the database server to be monitored. Specifying this item cannot be omitted.
Default value: 127.0.0.1
Port (1 to 65,535)
Specify the port number for connection. Specifying this item cannot be omitted.
Default value: 3,306
User Name (within 255 bytes)
Specify the user name to log on to the database. Specifying this item cannot be omitted.
Specify the MySQL user who can access the specified database.
Default value: None
Password (within 255 bytes)
Specify the password to log on to the database.
Default value: None
Table (within 255 bytes)
Specify the name of a monitor table created on the database. Specifying this item cannot be omitted. Make sure not to specify the same name as the table used for operation because a monitor table will be created and deleted. Be sure to set the name different from the reserved word in SQL statements.
Some characters cannot be used to specify a monitor table name according to the database specifications. For details, refer to the database specifications.
Default value: mysqlwatch
Storage Engine
Specify the storage engine to create monitoring tables. Specifying this item cannot be omitted.
Default value: InnoDB
Library Path (within 1,023 bytes)
Specify the library path to MySQL. Specifying this item cannot be omitted.
This monitor resource monitors MySQL using the libmysqlclient library of MySQL.
If this monitor resource fails, check that "libmysqlclient.so.xx" exists in the installation directory of the MySQL library.
If a value specified by a parameter differs from the MySQL environment for monitoring, an error message is displayed on the Cluster WebUI Alertlogs. Check the environment.
At "Level 1", a monitor error occurs if there is no monitor table at the start of monitoring. Create a monitor table as shown below.
If there is no monitor table at the start of monitoring in "Level 2", EXPRESSCLUSTER automatically creates the monitor table. In this case, a message indicating that the Cluster WebUI Alert logs does not have the monitor table is displayed.
The load on the monitor at "Level 3" is higher than that at "Level 1" and "Level 2" because the monitor in "Level 3" creates or deletes monitor tables for each monitoring.
Selectable monitor level
Prior creation of a monitor table
Level 1 (monitoring by select)
Required
Level 2 (monitoring by update/select)
Optional
Level 3 (create/drop table each time)
Optional
Create a monitor table using either of the following methods:
Use SQL statements (in the following example, the monitor table is named mysqlwatch)
6.20.3. How MySQL monitor resources perform monitoring
MySQL monitor resources perform monitoring according to the specified monitor level.
Level 1 (monitoring by select)
Monitoring with only reference to the monitor table. SQL statements executed for the monitor table are of (select) type.
An error is recognized if:
An error message is sent in response to a database connection or SQL statement message
Level 2 (monitoring by update/select)
Monitoring with reference to and update of the monitoring table. One SQL statement can read/write numerical data of up to 10 digits. SQL statements executed for the monitor table are of (update/select) type.
If a monitor table is automatically created at the start of monitoring, the SQL statement (create/insert) is executed for the monitor table.
An error is recognized if:
An error message is sent in response to a database connection or SQL statement message
The written data is not the same as the read data
Level 3 (create/drop table each time)
Creation/deletion of the monitor table by statement as well as update. One SQL statement can read/write numerical data of up to 10 digits. SQL statements executed for the monitor table are of (create / insert / select / drop) type.
An error is recognized if:
An error message is sent in response to a database connection or SQL statement message
Specify a directory for sharing files. Specifying this item cannot be omitted.
Default value: None
NFS Server (within 255 bytes)
Specify an IP address of the server that monitors NFS. Specifying this item cannot be omitted.
Default value: 127.0.0.1
NFS Version
Select one NFS version for NFS monitoring, from the following choices. Be careful to set this NFS version. In RHEL 7, the NFS version v2 is not supported.
v2
Monitors NFS version v2.
v3
Monitors NFS version v3.
v4
Monitors NFS version v4.
Default value: v4
6.21.2. System requirements for NFS monitor resource
The use of NFS monitor resources requires that the following already be started:
< For Red Hat Enterprise Linux 7 >
nfs
rpcbind
nfslock (unnecessary for NFS v4)
< For Red Hat Enterprise Linux 8 / 9 >
nfs-server
rpcbind
Monitoring NFS v4 requires an nfs-utils package on each server.
Specify the exports file for the shared directory to be monitored to enable the connection from a local server.
It is handled as an error that the deletion of nfsd with the version specified for NFS version of the Monitor(special) tab and mountd corresponding the nfsd is detected. The correspondence between nfsd versions and mountd versions is as follows.
Select one of the following levels. You cannot omit this level setting.
Level 1 (monitoring by select)
Monitoring with only reference to the monitor table. SQL statements executed for the monitor table are of (select) type.
Level 2 (monitoring by update/select)
Monitoring with reference to and update of the monitoring table. SQL statements executed for the monitor table are of (update/select) type.
If a monitor table is automatically created at the start of monitoring, the SQL statement (create/insert) is executed for the monitor table.
Level 3 (create/drop table each time)
Creation/deletion of the monitor table by statement as well as update. SQL statements executed for the monitor table are of (create / insert / select / drop) type.
Default: Level 2 (monitoring by update/select)
Data Source Name (Within 255 bytes)
Specify the data source name to be monitored. You must specify the name.
Default value: None
User Name (Within 255 bytes)
Specify the user name to log on to the database.
You do not have to specify if the user name is specified in the odbc.ini settings.
Default value: None
Password (Within 255 bytes)
Specify the password to log on to the database.
Default value: None
Monitor Table Name (Within 255 bytes)
Specify the name of a monitor table created in the database. You must specify the table name.
Make sure not to specify the same name as the table used for operation because a monitor table will be created and deleted. Be sure to set the name different from the reserved word in SQL statements.
Some characters cannot be used to specify a monitor table name according to the database specifications. For details, refer to the database specifications.
Since unixODBC Driver Manager is used for the monitoring process, installation of ODBC driver for the database to be monitored and settings for the data source on odbc.ini in advance.
If a value specified by a parameter differs from the database environment for monitoring, a message indicating an error is displayed on the Alert logs of the Cluster WebUI. Check the environment.
As a symbolic link to the shared library of unixODBC Driver Manager, ODBC monitor resources use the following:
libodbc.so
This symbolic link may not exist depending on what OS distribution, version, or package is installed. Not finding the link, ODBC monitor resources encounter the following warning:
Warn monitoring odbcw. (190 : Can not open library. (path=libodbc.so, msg=libodbc.so: cannot open shared object file: No such file or directory))
In this case, check if the symbolic link exists in /usr/lib64. If not, create libodbc.so by following this example of command execution:
Command example:
cd/usr/lib64# For moving to /usr/lib64ln-slibodbc.so.Xlibodbc.so# For creating the symbolic linkIntheabove,Xrepresentsaninteger.Carefullyspecifythisvalue,whichvariesdependingontheenvironment.
At "Level 1", a monitor error occurs if there is no monitor table at the start of monitoring. Create a monitor table as shown below.
If there is no monitor table at the start of monitoring in "Level 2", EXPRESSCLUSTER automatically creates the monitor table. In this case, a message indicating that the Cluster WebUI Alert logs does not have the monitor table is displayed.
The load on the monitor at "Level 3" is higher than that at "Level 1" and "Level 2" because the monitor in "Level 3" creates or deletes monitor tables for each monitoring.
Selectable monitor level
Prior creation of a monitor table
Level 1 (monitoring by select)
Required
Level 2 (monitoring by update/select)
Optional
Level 3 (create/drop table each time)
Optional
Create a monitor table using either of the following methods:
Alphanumeric characters and some symbols (such as underscores) can be used to specify a monitor table name.
(in the following example, the monitor table is named odbcwatch)
6.22.3. How ODBC monitor resources perform monitoring
ODBC monitor resources perform monitoring according to the specified monitor level.
Level 1 (monitoring by select)
Monitoring with only reference to the monitor table. SQL statements executed for the monitor table are of (select) type.
An error is recognized if:
An error message is sent in response to a database connection or SQL statement message
Level 2 (monitoring by update/select)
Monitoring with reference to and update of the monitoring table. One SQL statement can read/write numerical data of up to 10 digits. SQL statements executed for the monitor table are of (update/select) type.
If a monitor table is automatically created at the start of monitoring, the SQL statement (create/insert) is executed for the monitor table.
An error is recognized if:
An error message is sent in response to a database connection or SQL statement message
The written data is not the same as the read data
Level 3 (create/drop table each time)
Creation/deletion of the monitor table by statement as well as update. One SQL statement can read/write numerical data of up to 10 digits. SQL statements executed for the monitor table are of (create / insert / select / drop) type.
An error is recognized if:
An error message is sent in response to a database connection or SQL statement message
According to the specified monitor level, database connection, reference, and update operations are monitored.
listener monitor
To check for the listener operation, use the tnsping Oracle command. For a monitor resource property, ORACLE_HOME must be set.
If ORACLE_HOME is not set, only connection operations for the items specified in the connect string are monitored. Use this to attempt recovery by restarting the Listener service upon a connection error.
Selecting this setting causes the monitor level setting to be ignored.
instance monitor
A direction (BEQ) connection to the database is established, bypassing the listener and, according to the specified monitor level, database connection, reference, and update operations are monitored. For a monitor resource property, ORACLE_HOME must be set. This is used for direct instance monitoring and recovery action setting without routing through the listener.
If ORACLE_HOME is not set, only the connection specified with the connect string is established, and any error in the connection operation is ignored. This is used to set the recovery action for a non-connection error together with an Oracle monitor resource for which Monitor Listener only is specified.
Monitor Level
Select one of the following levels. When the monitor type is set to Monitor Listener only, the monitor level setting is ignored.
Level 0 (database status)
The Oracle management table (V$INSTANCE table) is referenced to check the DB status (instance status). This level corresponds to simplified monitoring without SQL statements being executed for the monitor table.
Level 1 (monitoring by select)
Monitoring with only reference to the monitor table. SQL statements executed for the monitor table are of (select) type.
Level 2 (monitoring by update/select)
Monitoring with reference to and update of the monitoring table. SQL statements executed for the monitor table are of (update/select) type.
If a monitor table is automatically created at the start of monitoring, the SQL statement (create/insert) is executed for the monitor table.
Level 3 (create/drop table each time)
Creation/deletion of the monitor table by statement as well as update. SQL statements executed for the monitor table are of (create / insert / select / drop) type.
Default: Level 2 (monitoring by update/select)
Connect Command (Within 255 bytes)
Specify the connect string for the database to be monitored. You must specify the connect string.
When Monitor Type is set to Monitor Instance only, set ORACLE_SID.
Monitor Type
ORACLE_HOME
Connect Command
Monitor Level
Monitor Listener and Instance
Need not be specified
Specify the connect string
As specified
Monitor Listener only
Monitoring dependent on Oracle command if specified
Specify the connect string
Ignored
Check for connection to the instance through the listener if not specified
Specify the connect string
Ignored
Monitor Instance only
Check for the instance by BEQ connection if specified
Specify ORACLE_SID
As specified
Check for the instance through the listener if not specified
Specify the connect string
As specified
Default value: None for the connect string
User Name (within 255 bytes)
Specify the user name to log on to the database. You must specify the name.
Specify the Oracle user who can access the specified database.
Default value: sys
Password (within 255 bytes)
Specify the password to log on to the database.
Default value: None
Authority Method
Specify the database user authentication.
Default value: SYSDBA
Table (within 255 bytes)
Specify the name of a monitor table created on the database. You must specify the name.
Make sure not to specify the same name as the table used for operation because a monitor table will be created and deleted. Be sure to set the name different from the reserved word in SQL statements.
Some characters cannot be used to specify a monitor table name according to the database specifications. For details, refer to the database specifications.
Default value: orawatch
ORACLE_HOME (Within 255 bytes)
Specify the path name configured in ORACLE_HOME. Begin with [/]. This is used when Monitor Type is set to Monitor Listener only or Monitor Instance only.
Default: None
Character Set
Specify the character set of Oracle. Specifying this item cannot be omitted.
Default value: JAPANESE_JAPAN.JA16EUC
Library Path (within 1,023 bytes)
Specify the library path of Oracle Call Interface (OCI). Specifying this item cannot be omitted.
Collect detailed application information at failure occurrence
In case that this function is enabled, when Oracle monitor resource detects errors, the detailed Oracle information is collected. The detailed Oracle information is collected up to 5 times.
Note
In case of stopping the oracle service while collecting the information due to the cluster stop, correct information may not be collected.
Default value: Disabled
Collection Timeout
Specify the timeout value for collecting detailed information.
Default value: 600
Set error during Oracle initialization or shutdown
If this function is enabled, a monitor error occurs immediately when Oracle initialization or shutdown in progress is detected.
Disable this function when Oracle is automatically restarted during operation in cooperation with Oracle Clusterware or the like. Monitoring becomes normal even during Oracle initialization immediately or shutdown.
However, a monitor error occurs if Oracle initialization or shutdown continues for one hour or more.
This monitor resource monitors Oracle with the Oracle interface (Oracle Call Interface). For this reason, the library for interface (libclntsh.so) needs to be installed on the server for monitoring.
A connection timeout is detected if 90% of the value set for timeout has passed and the Oracle monitor resource has not been able to connect to Oracle.
If values of a connection string, user name and password specified by a parameter are different from the Oracle environment for monitoring, Oracle monitoring cannot be done. Error message is displayed. Check the environment.
For the user specified with the user name parameter, the default is sys, but when a monitoring-dedicated user has been configured, for each monitor level the following access permissions must be provided for that user (if the sysdba permission is not provided):
Monitor level
Necessary permissions
Level 0 (database status)
SELECT permission for V$INSTANCE
Level 1 (monitoring by select)
SELECT permission for a monitor table
Level 2 (monitoring by update/select)
CREATE TABLE / DROP ANY TABLE / INSERT permission for a monitor table / UPDATE permission for a monitor table /SELECT permission for a monitor table
Level 3 (create/drop table each time)
CREATE TABLE / DROP ANY TABLE / INSERT permission for a monitor table / UPDATE permission for a monitor table /SELECT permission for a monitor table
If the administrator user authentication method is only the OS authentication by setting "NONE" to "REMOTE_LOGIN_PASSWORDFILE" in the initialization parameter file, specify a database user without SYSDBA authority for the user name of the parameter.
When specifying a database user with SYSDBA authority, an error occurs when this monitor resource starts, causing the monitoring process not to be executed.
If sys is specified for the user name, an Oracle audit log may be output. If you do not want to output large audit logs, specify a user name other than sys.
Use the character set supported by OS when creating a database.
If Japanese is set to NLS_LANGUAGE in the Oracle initialization parameter file, specify English by NLS_LANG (environment variable of Oracle.) Specify the character set corresponds to the database.
Select the language displayed in the EXPRESSCLUSTER Cluster WebUI Alert logs and OS messages (syslog) for the character code of the monitor resource if an error message is generated from Oracle.
However, as for an error of when connecting to the database such as incorrect user name and alert message may not be displayed correctly.
For the NLS parameter and NLS_LANG settings, see the Globalization Support Guide by Oracle Corporation.
The character code settings have no effect on the operation of Oracle.
At "Level 1", a monitor error occurs if there is no monitor table at the start of monitoring. Create a monitor table as shown below.
If there is no monitor table at the start of monitoring in "Level 2", EXPRESSCLUSTER automatically creates the monitor table. In this case, a message indicating that the Cluster WebUI alert view does not have the monitor table is displayed.
Monitoring at "Level 3", involving the creation/deletion of monitor tables every time, makes the load heavier than monitoring at "Level 1" and "Level 2". In addition, the usage of Oracle resources continues to rise. Therefore, monitoring at "Level 3" is not recommended unless it is for periodically restarting the Oracle instance.
Selectable monitor level
Prior creation of a monitor table
Level 0 (database status)
Optional
Level 1 (monitoring by select)
Required
Level 2 (monitoring by update/select)
Optional
Level 3 (create/drop table each time)
Optional
Create a monitor table using either of the following methods:
*When the user other than sys is specified for the user name parameter and the sysdba permission is not provided for that user, CREATE TABLE permission is required for that user.
When deleting the created monitor table manually, run the following command:
6.23.3. How Oracle monitor resources perform monitoring
Oracle monitor resources perform monitoring according to the specified monitor level.
Level 0 (database status)
The Oracle management table (V$INSTANCE table) is referenced to check the DB status (instance status). This level corresponds to simplified monitoring without SQL statements being executed for the monitor table.
An error is recognized if:
The Oracle management table (V$INSTANCE table) status is in the inactive state (MOUNTED,STARTED)
The Oracle management table (V$INSTANCE table) database_status is in the inactive state (SUSPENDED,INSTANCE RECOVERY)
Level 1 (monitoring by select)
Monitoring with only reference to the monitor table. SQL statements executed for the monitor table are of (select) type.
An error is recognized if:
An error message is sent in response to a database connection or SQL statement message
Level 2 (monitoring by update/select)
Monitoring with reference to and update of the monitoring table. One SQL statement can read/write numerical data of up to 11 digits. SQL statements executed for the monitor table are of (update/select) type.
If a monitor table is automatically created at the start of monitoring, the SQL statement (create/insert) is executed for the monitor table.
An error is recognized if:
An error message is sent in response to a database connection or SQL statement message
The written data is not the same as the read data
Level 3 (create/drop table each time)
Creation/deletion of the monitor table by statement as well as update. One SQL statement can read/write numerical data of up to 11 digits. SQL statements executed for the monitor table are of (create / insert / select / drop) type.
An error is recognized if:
An error message is sent in response to a database connection or SQL statement message
The written data is not the same as the read data
For all monitor levels 0 to 3, a specific error (ORA-1033 Oracle Initialization or shutdown) is regarded as being the normal state.
The POP3 monitor resource is to monitor the POP3 service running on a server. POP3 monitor resources monitor POP3 protocol but they are not intended for monitoring specific applications. POP3 monitor resources monitor various applications that use POP3 protocol.
Specify the IP address of the POP3 server to be monitored. Specifying this item cannot be omitted. If it is multi-directional standby server, specify FIP.
Usually, the POP3 server running on the local server is connected, thus the loopback address (127.0.0.1) is to be configured. If accessible addresses are limited by the POP3 server settings, specify an accessible address (e.g., floating IP address).
Default value: 127.0.0.1
Authentication Method
Select the authentication method to log on to POP3. It must follow the settings of POP3 being used:
APOP (Default value)
The encryption authentication method that uses the APOP command.
USER/PASS
The plaintext method that uses the USER/PASS command.
POP3S
An encryption authentication method that uses SSL/TLS.
Note
Using POP3S requires the OpenSSL library.
Port Number (1 to 65,535)
Specify the POP3 port number to be monitored. Specifying this item cannot be omitted.
Default value :
110
995 (POP3S)
User Name (within 255 bytes)
Specify the user name to log on to POP3.
Default value: None
Password (within 255 bytes)
Specify the password to log on to POP3. Click Change and enter the password in the dialog box.
For the target to be monitored, specify the EXEC resource that starts the POP3 server. Monitoring starts after target resource is activated. However, if POP3 services cannot be started immediately after target resource is activated, adjust the time using Wait Time to Start Monitoring.
POP3 services may produce operation logs for each monitoring. Configure the POP3 settings if this needs to be adjusted.
Select one of the following levels. You cannot omit this level setting.
Level 1 (monitoring by select)
Monitoring with only reference to the monitor table. SQL statements executed for the monitor table are of (select) type.
Level 2 (monitoring by update/select)
Monitoring with reference to and update of the monitoring table. SQL statements executed for the monitor table are of (update / select / reindex / vacuum) type.
If a monitor table is automatically created at the start of monitoring, the SQL statement (create/insert) is executed for the monitor table.
Level 3 (create/drop table each time)
Creation/deletion of the monitor table by statement as well as update. SQL statements executed for the monitor table are of (create / insert / select / reindex / drop / vacuum) type.
Default: Level 2 (monitoring by update/select)
Database Name (within 255 bytes)
Specify the database name to be monitored. Specifying this item cannot be omitted.
Default value: None
IP Address (within 79 bytes)
Specify the IP address of the server to connect. Specifying this item cannot be omitted.
Default value: 127.0.0.1
Port (1 to 65,535)
Specify the port number for connection. Specifying this item cannot be omitted.
Default value: 5,432
User Name (within 255 bytes)
Specify the user name to log on to the database. Specifying this item cannot be omitted.
Specify the PostgreSQL user who can access the specified database.
Default value: postgres
Password (within 255 bytes)
Specify the password to log on to the database.
Default value: None
Table (within 255 bytes)
Specify the name of a monitor table created on the database. Specifying this item cannot be omitted.
Make sure not to specify the same name as the table used for operation because a monitor table will be created and deleted. Be sure to set the name different from the reserved word in SQL statements.
Some characters cannot be used to specify a monitor table name according to the database specifications. For details, refer to the database specifications.
Default value: psqlwatch
Library Path (within 1,023 bytes)
Specify the home path to PostgreSQL. Specifying this item cannot be omitted.
This monitor resource uses the libpq library of PostgreSQL to monitor PostgreSQL.
If this monitor resource fails, set the application library path to the path where the libpq library of PostgreSQL exists.
If a value specified by a parameter differs from the PostgreSQL environment for monitoring, a message indicating an error is displayed on the Alert logs of the Cluster WebUI. Check the environment.
For client authentication, on this monitor resource, the following authentication methods that can be set to the "pg_hba.conf" file has been checked its operation.
trust, md5, password
When this monitor resource is used, messages like those shown below are output to a log on the PostgreSQL side. These messages are output by the monitor processing and do not indicate any problems.
YYYY-MM-DD hh:mm:ss JST moodle moodle LOG: statement: DROP TABLE psqlwatch
YYYY-MM-DD hh:mm:ssJST moodle moodle ERROR: table "psqlwatch" does not exist
YYYY-MM-DD hh:mm:ss JST moodle moodle STATEMENT: DROP TABLE psqlwatch
YYYY-MM-DD hh:mm:ss JST moodle moodle LOG: statement: CREATE TABLE psqlwatch (num INTEGER NOT NULL PRIMARY KEY)
YYYY-MM-DD hh:mm:ss JST moodle moodle NOTICE: CREATE TABLE / PRIMARY KEY will create implicit index "psqlwatch_pkey" for table "psql watch"
YYYY-MM-DD hh:mm:ss JST moodle moodle LOG: statement: DROP TABLE psqlwatch
At "Level 1", a monitor error occurs if there is no monitor table at the start of monitoring. Create a monitor table as shown below.
If there is no monitor table at the start of monitoring in "Level 2", EXPRESSCLUSTER automatically creates the monitor table. In this case, a message indicating that the Cluster WebUI Alert logs does not have the monitor table is displayed.
The load on the monitor at "Level 3" is higher than that at "Level 1" and "Level 2" because the monitor in "Level 3" creates or deletes monitor tables for each monitoring.
Selectable monitor level
Prior creation of a monitor table
Level 1 (monitoring by select)
Required
Level 2 (monitoring by update/select)
Optional
Level 3 (create/drop table each time)
Optional
Create a monitor table using either of the following methods:
Use SQL statements (in the following example, the monitor table is named psqlwatch)
6.25.3. How PostgreSQL monitor resources perform monitoring
PostgreSQL monitor resources perform monitoring according to the specified monitor level.
Level 1 (monitoring by select)
Monitoring with only reference to the monitor table. SQL statements executed for the monitor table are of (select) type.
An error is recognized if:
An error message is sent in response to a database connection or SQL statement message
Level 2 (monitoring by update/select)
Monitoring with reference to and update of the monitoring table. One SQL statement can read/write numerical data of up to 10 digits. SQL statements executed for the monitor table are of (update / select / reindex / vacuum) type.
If a monitor table is automatically created at the start of monitoring, the SQL statement (create/insert) is executed for the monitor table.
An error is recognized if:
An error message is sent in response to a database connection or SQL statement message
The written data is not the same as the read data
Level 3 (create/drop table each time)
Creation/deletion of the monitor table by statement as well as update. One SQL statement can read/write numerical data of up to 10 digits. SQL statements executed for the monitor table are of (create / insert / select / reindex / drop / vacuum) type.
An error is recognized if:
An error message is sent in response to a database connection or SQL statement message
Specify the shared name of samba server to be monitored. Specifying this item cannot be omitted.
Default value: None
IP Address (within 79 bytes)
Specify the IP address of samba server. Specifying this item cannot be omitted.
Default value: 127.0.0.1
Port (1 to 65,535)
Specify the port number to be used by samba daemon. Specifying this item cannot be omitted. If the version of libsmbclient is 3 or earlier (e.g. libsmbclient.so provided with RHEL 6), the Port field can accept only 139 or 445. Specify the same value for smb ports of the smb.conf as well.
Default value: 139
User Name (within 255 bytes)
Specify the user name to log on to the samba service. Specifying this item cannot be omitted.
Default value: None
Password (within 255 bytes)
Specify the password to log on to the samba service.
If this monitor resource fails, the parameter value and samba environment may not match. Check the samba environment.
Specify the smb.conf file for the shared name to be monitored to enable a connection from a local server. Allow guest connection when the security parameter of the smb.conf file is "share."
Samba functions except file sharing and print sharing are not monitored.
If the smbmount command is run on the monitoring server when the samba authentication mode is "Domain" or "Server," it may be mounted as a user name specified by the parameter of this monitor resource.
If the load average remains exceeding the value of RefuseLA configured in the sendmail.def file for a specified duration of time, the monitor resource may regard the phenomenon as an error.
Select one of the following levels. You cannot omit this level setting.
Level 0 (database status)
The SQL Server management table is referenced to check the DB status. This level corresponds to simplified monitoring without SQL statements being issued for the monitor table.
Level 1 (monitoring by select)
Monitoring with only reference to the monitor table. SQL statements executed for the monitor table are of (select) type.
Level 2 (monitoring by update/select)
Monitoring with reference to and update of the monitoring table. SQL statements executed for the monitor table are of (update/select) type.
If a monitor table is automatically created at the start of monitoring, the SQL statement (create/insert) is executed for the monitor table.
Level 3 (create/drop table each time)
Creation/deletion of the monitor table by statement as well as update. SQL statements executed for the monitor table are of (create / insert / select / drop) type.
Default: Level 2 (monitoring by update/select)
Database Name (Within 255 bytes)
Specify the database to be monitored. You must specify the database.
Default value: None
Server Name (Within 255 bytes)
Specify the database server name to be monitored. You must specify the database server.
Default value: localhost
User Name (Within 255 bytes)
Specify the user name to log on to the database. You must specify the user name.
Specify the SQL Server user who can access the specified database.
Default value: SA
Password (Within 255 bytes)
Specify the password to log on to the database. You must specify the password.
Default value: None
Monitor Table Name (Within 255 bytes)
Specify the name of a monitor table created in the database. You must specify the name.
Make sure not to specify the same name as the table used for operation because a monitor table will be created and deleted. Make sure to set the name different from the reserved word in SQL statements.
Some characters cannot be used to specify a monitor table name according to the database specifications. For details, refer to the database.
Default value: sqlwatch
ODBC Driver Name (Within 255 bytes)
Specify the ODBC driver name to SQL Server. You must specify the path.
This monitor resource monitors SQL Server using Microsoft ODBC Driver for SQL Server.
If a value specified by a parameter differs from the SQL Server environment for monitoring, an error message is displayed on the Cluster WebUI Alert logs. Check the environment.
At "Level 1", a monitor error occurs if there is no monitor table at the start of monitoring. Create a monitor table as shown below.
If there is no monitor table at the start of monitoring in "Level 2", EXPRESSCLUSTER automatically creates the monitor table. In this case, a message indicating that the Cluster WebUI. Alert logs does not have the monitor table is displayed.
The load on the monitor at "Level 3" is higher than that at "Level 1" and "Level 2" because the monitor in "Level 3" creates or deletes monitor tables for each monitoring.
Selectable monitor level
Prior creation of a monitor table
Level 0 (database status)
Optional
Level 1 (monitoring by select)
Required
Level 2 (monitoring by update/select)
Optional
Level 3 (create/drop table each time)
Optional
Create a monitor table using either of the following methods:
Alphanumeric characters and some symbols (such as underscores) can be used to specify a monitor table name.
Use SQL statements (in the following example, the monitor table is named sqlwatch)
As the prerequisite, setting up the monitor resource must be completed.
clp_sqlserverw --createtable -n <SQL Server monitor_resource_name>
To manually delete a monitor table, execute the following command:
clp_sqlserverw --deletetable -n <SQL Server monitor_resource_name>
6.28.3. How SQL Server monitor resources perform monitoring
SQL Server monitor resources perform monitoring according to the specified monitor level.
Level 0 (database status)
The SQL Server management table is referenced to check the DB status. This level corresponds to simplified monitoring without SQL statements being issued for the monitor table.
An error is recognized if:
The database status is not online
Level 1 (monitoring by select)
Monitoring with only reference to the monitor table. SQL statements executed for the monitor table are of (select) type.
An error is recognized if:
An error message is sent in response to a database connection or SQL statement message
Level 2 (monitoring by update/select)
Monitoring with reference to and update of the monitoring table. One SQL statement can read/write numerical data of up to 10 digits. SQL statements executed for the monitor table are of (update/select) type.
If a monitor table is automatically created at the start of monitoring, the SQL statement (create/insert) is executed for the monitor table.
An error is recognized if:
An error message is sent in response to a database connection or SQL statement message
The written data is not the same as the read data
Level 3 (create/drop table each time)
Creation/deletion of the monitor table by statement as well as update. One SQL statement can read/write numerical data of up to 10 digits. SQL statements executed for the monitor table are of (create / insert / select / drop) type.
An error is recognized if:
An error message is sent in response to a database connection or SQL statement message
Specify the IP address of the server to be monitored. Specifying this item cannot be omitted.
Default value: 127.0.0.1
Port (1 to 65,535)
Specify the port number used to connect to the server. Specifying this item cannot be omitted.
Default value: 7,002
Monitor Method
Specify the method of monitoring the server. Setting this parameter is mandatory.
Default value: RESTful API
Protocol
Specify the protocol of the server to be monitored. Setting this parameter is mandatory if RESTful API is selected in Monitor Method.
Default value: HTTP
User Name (Within 255 bytes)
Specify the name of the WebLogic user. Setting this parameter is mandatory if RESTful API is selected in Monitor Method.
Default value: weblogic
Password (Within 255 bytes)
Specify the password for WebLogic, if necessary, with RESTful API selected in Monitor Method.
Default value: None
Account Shadow
When you specify a user name and a password directly, select Off. If not, select On. Specifying this item cannot be omitted.
Default value: Off
Config File (within 1,023 bytes)
Specify the file in which the user information is saved. Specifying this item cannot be omitted if Account Shadow is On.
Default value: None
Key File (within 1,023 bytes)
Specify the file in which the password required to access to a config file path is saved. Specify the full path of the file. Specifying this item cannot be omitted if Account Shadow is On.
Default value: None
User Name (within 255 bytes)
Specify the user name of WebLogic. Specifying this item cannot be omitted if Account Shadow is Off.
Default value: weblogic
Password (within 255 bytes)
Specify the password of WebLogic.
Default value: None
Authority Method
Specify the authentication method when connecting to an application server. Specifying this item cannot be omitted.
Specify DemoTrust or Custom Trust for Authority Method, in order to execute monitoring by using the SSL communication.
It is determined whether to use DemoTrust or CustomTrust, according to the setting of WebLogic Administration Console.
When Keystores of WebLogic Administration Console is set to Demo Identity and Demo Trust, specify Demo Trust. In this case, you do not need to make settings for Key Store File.
When Keystores of WebLogic Administration Console is set to Custom Identity and Custom Trust, specify Custom Trust. In this case, you need to make settings for Key Store File.
Default value: DemoTrust
Key Store File (within 1,023 bytes)
Specify the authentication file when authenticating SSL. You must specify this when the Authority Method is CustomTrust. Set the file specified in Custom Identity Key Store File on WebLogic Administration Console.
Default value: None
Domain Environment File (within 1,023 bytes)
Specify the name of the WebLogic domain environment file. Specifying this item cannot be omitted.
If the selected monitoring method is WLST for this monitor resource, the monitoring requires a JAVA environment. Since the JAVA functions are used by the application server system, a stall of JAVA (if any) may be recognized as an error.
If WebLogic monitor resources are not available at the startup of WebLogic, they will be judged as being abnormal. Adjust [Wait Time to Start Monitoring], or start WebLogic before the startup of the WebLogic monitor resources (for example, specify the EXEC resource for starting WebLogic as a monitor target resource).
A Java environment is required to start monitoring with this command. The application server system uses Java functions. Therefore if Java stalls, it may be recognized as an error.
Specify the server name of the server to be monitored. Specifying this item cannot be omitted.
Default value: localhost
Port (1 to 65,535)
Specify the port number used to connect to the server. Specifying this item cannot be omitted.
When monitoring a WebOTX user domain, specify the management port number for the WebOTX domain. The management port number is the number which was set for "domain.admin.port" of <domain_name>.properties when the domain was created. Refer to the WebOTX documents for details of <domain_name>.properties.
Default value: 6,212
User Name (within 255 bytes)
Specify the user name of WebOTX. Specifying this item cannot be omitted.
When monitoring a WebOTX user domain, specify the login user name for the WebOTX domain.
Default value:None
Password (within 255 bytes)
Specify the password of WebOTX.
Default value: None
Install Path (within 1,023 bytes)
Specify the WebOTX installation path. Specifying this item cannot be omitted.
A Java environment is required to start monitoring with this command. The application server system uses Java functions. Therefore if Java stalls, it may be recognized as an error.
Select the target to be monitored from the list. When monitoring WebSAM SVF for PDF, WebSAM Report Director Enterprise, or WebSAM Universal Connect/X, select WebSAM SVF. When monitoring a Java application that you created, select Java Application.
Select JBoss when monitoring the standalone mode of JBoss Enterprise Application Platform. Select JBoss Domain Mode when monitoring the domain mode of JBoss Enterprise Application Platform.
Default: None
JVM Type
Select the Java VM on which the target application to be monitored is running.
For Java 8 (or later) and OpenJDK 8 (or later), select Oracle Java(usage monitoring). For Java 8, the following specification changes have been made.
It has become impossible to acquire the maximum value of each memory in a non-heap area.
Perm Gen has been changed to Metaspace.
Compressed Class Space was added
For Java 8, therefore, the monitor items on the Memory tab have been changed as below.
Monitoring for the use rate has been changed to monitoring for the amount used.
Perm Gen, Perm Gen[shared-ro], and Perm Gen[shared-rw] cannot be monitored. Clear the check box.
Metaspace and Compressed Class Space can be monitored.
For Java 9, the following specification changes have been made.
Code Cache has been divided.
For Java9, therefore, the monitor items on the Memory tab have been changed as below.
Code Cache cannot be monitored. Clear the check box.
CodeHeap non-nmethods, CodeHeap profiled and CodeHeap non-profiled can be monitored.
For each monitor target, the following are selectable.
When the target is WebLogic Server
Oracle Java, Oracle Java(usage monitoring), and Oracle JRockit are selectable.
When the target is Tomcat
Oracle Java, Oracle Java(usage monitoring), and OpenJDK are selectable.
When the target is other than WebLogic Server and Tomcat
Oracle Java and Oracle Java(usage monitoring) are selectable.
Default: None
Identifier (within 255 bytes)
The identifier is set to differentiate the relevant JVM monitor resource from another JVM monitor resource when the information on the application to be monitored is output to the JVM operation log of the relevant JVM monitor resource. For this purpose, set a unique character string between JVM monitor resources. You must specify the identifier.
When the target is WebLogic Server
Set the name of the server instance to be monitored, according to "Monitoring WebLogic Server", item 2.
Specify a uniquely identifiable string for the monitored Java VM process.
Default: None
Connection Port (1024 to 65535)
Set the port number used by the JVM monitor resource when it establishes a JMX connection to the target Java VM. The JVM monitor resource obtains information by establishing a JMX connection to the target Java VM. Therefore, to register the JVM monitor resource, it is necessary to specify the setting by which the JMX connection port is opened for the target Java VM. You must specify the connection port. A value between 42424 and 61000 is not recommended.
Specify a uniquely identifiable string for the monitored Java VM process.
Default: None
Process Name (within 1024 bytes)
Set a Process Name to identify the target JVM monitor resource when JVM monitor resource is connecting the target Java VM via JMX. Therefore, be sure to specify a character string that is unique among JVM monitor resources.
When the target is other than JBoss Domain Mode
This does not need to be configured because the monitor target Java VM can be identified by Connection Port Number. The internal version 3.3.5-1 or earlier required the process name to be specified since this parameter was used for the identification when the data of virtual memory usage amount was obtained or when the data of the monitor target was output to the JVM operation log. However, in and after the internal version 4.0.0-1, Monitor Virtual Memory Usage was deleted. Therefore, it cannot be specified.
When the target is JBoss Domain Mode
Specify this according to "Monitoring JBoss".
Default: None
User (within 255 bytes)
Specify the name of the administrator who will be making a connection with the target Java VM.
When WebOTX Domain Agent is selected as the target
Specify the "domain.admin.user" value of "/opt/WebOTX/<domain_name>.properties".
When the target is other than WebOTX Domain Agent
This cannot be specified.
Default: None
Password (within 255 bytes)
Specify the password for the administrator who will be making a connection with the target Java VM.
When WebOTX Domain Agent is selected as the target
Specify the "domain.admin.passwd" value of "/opt/WebOTX/<domain_name>.properties".
When the target is other than WebOTX Domain Agent
This cannot be specified.
Default: None
Command (within 255 bytes)
Specify the commands that will be executed if errors in the monitor target Java VM are detected. A specific command and argument(s) can be specified for each error cause. Use an absolute path to specify each command. Place the executable file name in double quotes ("") to specify it.
Example: "/usr/local/bin/command" arg1 arg2
Specify the commands that will be executed if connection to the monitor target Java VM cannot be established or if an error is detected in the process for acquiring the amount of resource usage on the Java VM.
When you click Tuning, the following information is displayed in the pop-up dialog box. Make detailed settings according to the descriptions below.
6.33.2. Memory tab (when Oracle Java or OpenJDK is selected for JVM Type)
Monitor Heap Memory Rate
Enables the monitoring of the usage rates of the Java heap areas used by the target Java VM.
When selected (default):
Monitoring enabled
When cleared:
Monitoring disabled
Total Usage (1 to 100)
Specify the threshold for the usage rate of the Java heap areas used by the target Java VM.
Default: 80[%]
Eden Space (1 to 100)
Specify the threshold for the usage rate of the Java Eden Space used by the target Java VM. If G1 GC is specified as the GC method, read it as G1 Eden Space.
Default: 100[%]
Survivor Space (1 to 100)
Specify the threshold for the usage rate of the Java Survivor Space used by the target Java VM. If G1 GC is specified as the GC method, read it as G1 Survivor Space.
Default: 100[%]
Tenured Gen (1 to 100)
Specify the threshold for the usage rate of the Java Tenured(Old) Gen area used by the target Java VM. If G1 GC is specified as the GC method, read it as G1 Survivor Space.
Default: 80[%]
Monitor Non-Heap Memory Rate
Enables the monitoring of the usage rates of the Java non-heap areas used by the target Java VM.
When selected (default):
Monitoring enabled
When cleared:
Monitoring disabled
Total Usage (1 to 100)
Specify the threshold for the usage rate of the Java non-heap areas used by the target Java VM.
Default: 80[%]
Code Cache (1 to 100)
Specify the threshold for the usage rate of the Java Code Cache area used by the target Java VM.
Default: 100[%]
Perm Gen (1 to 100)
Specify the threshold for the usage rate of the Java Perm Gen area used by the target Java VM.
Default: 80[%]
Perm Gen[shared-ro] (1 to 100)
Specify the threshold for the usage rate of the Java Perm Gen [shared-ro] area used by the target Java VM.
Default: 80[%]
Perm Gen[shared-rw] (1 to 100)
Specify the threshold for the usage rate of the Java Perm Gen [shared-rw] area used by the target Java VM.
Default: 80[%]
Command (within 255 bytes)
Specify the commands that will be executed if errors in the monitor target Java VM are detected. A specific command and argument(s) can be specified for each error cause. Use an absolute path to specify each command. Place the executable file name in double quotes ("") to specify it. Example) "/usr/local/bin/command" arg1 arg2
Specify the commands that will be executed if errors are detected in the process for checking the amount of the usage of the Java heap area and Java non-heap area in the monitor target Java VM.
Click Initialize to initialize all the items to their default values.
6.33.3. Memory tab (when Oracle Java(usage monitoring) is selected for JVM Type)
Monitor Heap Memory Usage
Enables the monitoring of the usage rates of the Java heap areas used by the target Java VM. If zero is specified, this item is not monitored.
When the check box is selected:
Monitoring enabled
When the check box is not selected (default):
Monitoring disabled
Total Usage (0 to 102400)
Specify the threshold for the usage rate of the Java heap areas used by the target Java VM. If zero is specified, this item is not monitored.
Default: 0[MB]
Eden Space (0 to 102400)
Specify the threshold for the usage rate of the Java Eden Space used by the target Java VM. If zero is specified, this item is not monitored. If G1 GC is specified as the GC method, read it as G1 Eden Space.
Default: 0[MB]
Survivor Space (0 to 102400)
Specify the threshold for the usage rate of the Java Survivor Space used by the target Java VM. If zero is specified, this item is not monitored. If G1 GC is specified as the GC method, read it as G1 Survivor Space.
Default: 0[MB]
Tenured Gen(Old Gen) (0 to 102400)
Specify the threshold for the usage rate of the Java Tenured(Old) Gen area used by the target Java VM. If zero is specified, this item is not monitored. If G1 GC is specified as the GC method, read it as G1 Old Gen.
Default: 0[MB]
Monitor Non-Heap Memory Usage
Enables the monitoring of the usage rates of the Java non-heap areas used by the target Java VM.
When the check box is selected:
Monitoring enabled
When the check box is not selected (default):
Monitoring disabled
Total Usage (0 to 102400)
Specify the threshold for the usage rate of the Java non-heap areas used by the target Java VM. If zero is specified, this item is not monitored.
Default: 0[MB]
Code Cache (0 to 102400)
Specify the threshold for the usage rate of the Java Code Cache area used by the target Java VM. If zero is specified, this item is not monitored.
Default: 0[MB]
CodeHeap non-nmethods(0 to 102400)
Specify the threshold for the usage rate of the Java CodeHeap non-nmethods area used by the target Java VM. If zero is specified, this item is not monitored.
Default: 0[MB]
CodeHeap profiled(0 to 102400)
Specify the threshold for the usage rate of the Java CodeHeap profiled nmethods area used by the target Java VM. If zero is specified, this item is not monitored.
Default: 0[MB]
CodeHeap non-profiled (0 to 102400)
Specify the threshold for the usage rate of the Java CodeHeap non-profiled nmethods area used by the target Java VM. If zero is specified, this item is not monitored.
Default: 0[MB]
Compressed Class Space(0 to 102400)
Specify the threshold for the usage rate of the Compressed Class Space area used by the target Java VM. If zero is specified, this item is not monitored.
Default: 0[MB]
Metaspace (0 to 102400)
Specify the threshold for the usage rate of the Metaspace area used by the target Java VM. If zero is specified, this item is not monitored.
Default: 0[MB]
Command (within 255 bytes)
Specify the commands that will be executed if errors in the monitor target Java VM are detected. A specific command and argument(s) can be specified for each error cause. Use an absolute path to specify each command. Place the executable file name in double quotes ("") to specify it. Example) "/usr/local/bin/command" arg1 arg2
Specify the commands that will be executed if errors are detected in the Java heap area and Java non-heap area of the target Java VM.
Click Initialize to initialize all the items to their default values.
6.33.4. Memory tab (when Oracle JRockit is selected)
Displayed only when JRockit is selected for JVM Type.
Monitor Heap Memory Rate
Enables the monitoring of the usage rates of the Java heap areas used by the target Java VM.
When selected (default):
Monitoring enabled
When cleared:
Monitoring disabled
Total Usage (1 to 100)
Specify the threshold for the usage rate of the Java heap areas used by the target Java VM.
Default: 80[%]
Nursery Space (1 to 100)
Specify the threshold for the usage rate of the Java Nursery Space used by the target JRockit JVM.
Default: 80[%]
Old Space (1 to 100)
Specify the threshold for the usage rate of the Java Old Space used by the target JRockit JVM.
Default: 80[%]
Monitor Non-Heap Memory Rate
Enables the monitoring of the usage rates of the Java non-heap areas used by the target Java VM.
When selected (default):
Monitoring enabled
When cleared:
Monitoring disabled
Total Usage (1 to 100)
Specify the threshold for the usage rate of the Java non-heap areas used by the target Java VM.
Default: 80[%]
Class Memory (1 to 100)
Specify the threshold for the usage rate of the Java Class Memory used by the target JRockit JVM.
Default: 100[%]
Command (within 255 bytes)
Specify the commands that will be executed if errors in the monitor target Java VM are detected. A specific command and argument(s) can be specified for each error cause. Use an absolute path to specify each command. Place the executable file name in double quotes ("") to specify it. Example) "/usr/local/bin/command" arg1 arg2
Specify the commands that will be executed if errors are detected in the process for checking the amount of the usage of the Java heap area and Java non-heap area in the monitor target Java VM.
Specify the upper limit threshold for the number of threads running on the monitor target Java VM.
Default: 65535 [threads]
Command (within 255 bytes)
Specify the commands that will be executed if errors in the monitor target Java VM are detected. A specific command and argument(s) can be specified for each error cause. Use an absolute path to specify each command. Place the executable file name in double quotes ("") to specify it. Example) "/usr/local/bin/command" arg1 arg2
Specify the commands that will be executed if errors are detected in the process for checking the number of active threads in the monitor target Java VM.
Specify the threshold for the Full GC execution time since previous measurement on the target Java VM. The threshold for the Full GC execution time is the average obtained by dividing the Full GC execution time by the number of times Full GC occurs since the previous measurement.
To determine the case in which the Full GC execution time since the previous measurement is 3000 milliseconds and Full GC occurs three times as an error, specify 1000 milliseconds or less.
Default: 65535 [milliseconds]
Monitor the count of Full GCexecution (1 to 65535)
Specify the threshold for the number of times Full GC occurs since previous measurement on the target Java VM.
Default: 1 (time)
Command (within 255 bytes)
Specify the commands that will be executed if errors in the monitor target Java VM are detected. A specific command and argument(s) can be specified for each error cause. Use an absolute path to specify each command. Place the executable file name in double quotes ("") to specify it. Example) "/usr/local/bin/command" arg1 arg2
Specify the commands that will be executed if errors are detected in the process for measuring time in Full GC and the count of Full GC execution in the monitor target Java VM.
Displayed only when WebLogic Server is selected for Target.
Monitor the requests in Work Manager
Enables the monitoring of the wait requests by Work Managers on the WebLogic Server.
When selected:
Monitoring enabled
When cleared (default):
Monitoring disabled
Target Work Managers
Specify the names of the Work Managers for the applications to be monitored on the target WebLogic Server. To monitor Work Managers, you must specify this setting.
App1[WM1,WM2, ...];App2[WM1,WM2, ...]; ...
For App and WM, only ASCII characters are valid (except Shift_JIS codes 0x005C and 0x00A1 to 0x00DF).
To specify an application that has an application archive version, specify "application_name#version" in App.
When the name of the application contains "[" and/or "]", prefix it with ¥¥.
(Ex.) When the application name is app[2], enter app¥¥[2¥¥].
Default: None
The number (1 to 65535)
Specify the threshold for the wait request count for the target WebLogic Server Work Manager(s).
Default: 65535
Average (1 to 65535)
Specify the threshold for the wait request count average for the target WebLogic Server Work Manager(s).
Default: 65535
Increment from the last (1 to 1024)
Specify the threshold for the wait request count increment since the previous measurement for the target WebLogic Server Work Manager(s).
Default: 80[%]
Monitor the requests in Thread Pool
In WebLogic Server thread pool to be monitored, the number of wait requests, and the monitoring settings of the number of executing request. The number of requests, HTTP requests and the number that was waiting to be processed and run inside WebLogic Server, and includes the number of requests of the processing performed by the internal EJB call and WebLogic Server. However, it can not judge an abnormal state to be increased. Please specify if you want to the collection of JVM statistics log.
When selected (default):
Monitoring enabled
When cleared:
Monitoring disabled
Waiting Requests The number (1 to 65535)
Specify the threshold for the wait request count.
Default: 65535
Waiting Requests Average (1 to 65535)
Specify the threshold for the wait request count average.
Default: 65535
Waiting Requests Increment from the last (1 to 1024)
Specify the threshold for the wait request count increment since the previous measurement.
Default: 80[%]
Executing Requests The number (1 to 65535)
Specify the threshold for the number of requests executed per unit of time.
Default: 65535
Executing Requests Average (1 to 65535)
Specify the threshold for the average count of requests executed per unit of time.
Default: 65535
Executing Requests Increment from the last (1 to 1024)
Specify the threshold for the increment of the number of requests executed per unit of time since the previous measurement.
Default: 80[%]
Command (within 255 bytes)
Specify the commands that will be executed if errors in the monitor target Java VM are detected. A specific command and argument(s) can be specified for each error cause. Use an absolute path to specify each command. Place the executable file name in double quotes ("") to specify it. Example) "/usr/local/bin/command" arg1 arg2
Specify the commands that will be executed if errors are detected in the process for executing requests in the Work Manager and Thread Pool of WebLogic Server.
The Java install path on the JVM Monitor tab of Cluster Properties must be set before adding JVM monitor resource.
For a target resource, specify an application server running on Java VM such as WebLogic Server or WebOTX. As soon as the JVM monitor resource has been activated, the Java Resource Agent starts monitoring, but if the target (WebLogic Server or WebOTX) cannot start running immediately after the activation of the JVM monitor resource, use Wait Time to Start Monitoring to compensate.
The setting of Monitor(common) tab-Retry Count is invalid. When you'd like to delay error detection, please change the setting of Cluster Properties-JVM monitor Tab-Resource Measurement Settings [Common]-Retry Count.
6.33.9. How JVM monitor resources perform monitoring
JVM monitor resource monitors the following:
Monitors application server by using JMX (Java Management Extensions).
The monitor resource determines the following results as errors:
Target Java VM or application server cannot be connected
The value of the used amount of resources obtained for the Java VM or application server exceeds the user-specified threshold a specified number of times (error decision threshold) consecutively
As a result of monitoring, an error is regarded as having been solved if:
The value falls below the threshold when restarting the monitoring after the recovery action.
Note
Collect Cluster Logs in the Cluster WebUI does not handle the configuration file and log files of the target (WebLogic Server or WebOTX).
The following figure shows the monitoring operation by the JVM monitor resource.
Monitoring of the target Java VM is started ... a). JMX (Java Management Extensions) is used for monitoring Java VM. Java Resource Agent periodically obtains the amount of used resources through JMX to check the status of Java VM.
When the status changes from normal to abnormal, Cluster WebUI indicates an error having been detected in Java VM, where its status and alert can be checked ... b). An error is notified to the syslog and JVM operation log ... c). If an alert service is used, a notification via an e-mail is available.
After a), if the status is changed from Error to Normal, Cluster WebUI indicates Java VM has been restored ... d). The restoration of Java VM is notified to the syslog and JVM operation log ... e).
Fig. 6.11 Monitoring flow by the JVM monitor resource
The standard operations when the threshold is exceeded are as described below.
In the figure below, the horizontal axis shows the lapse of time, while the vertical axis shows whether the user-specified threshold is exceeded or not.
If the value consecutively exceeds the threshold the number of times of the error decision threshold (five times in this figure), it is determined as an error.
The operations performed if an error persists are as described below.
If the value consecutively exceeds the threshold the number of times of the error decision threshold, it is determined as an error.
After determining as an error, even if the value consecutively exceeds the number of times of the error decision threshold again, Cluster WebUI does not display an alert again.
The following example describes the case of monitoring Full GC (Garbage Collection).
The horizontal axis in the figure shows the lapse of time.
The upper part of the figure shows whether Full GC occurred or not, while the lower part shows how many times Full GC occurred consecutively.
The JVM resource detects an error when Full GC consecutively occurs the number of times of the error judgment threshold.
With the error decision threshold set at five times, the JVM resource detects an error when Full GC has been detected five times.
The JVM monitor resource recognizes a monitor error if Full GC is detected consecutively the number of times specified by the error threshold. In the following chart, * indicates that Full GC is detected by the JVM monitor resource when the error threshold is set to 5 (times).
Full GC has a significant influence on the system, thus the recommended error threshold is 1 time.
Fig. 6.14 Monitoring image (error decision threshold set at five times)
JVM monitor resources collect statistics information on the monitor target Java VM. The information is stored in CSV-format files, as JVM statistics logs. The file is created in the following location:
<EXPRESSCLUSTER install path>/log/ha/jra/*.stat
The following "monitor items" see the parameters on the [Monitor(special)] tab of [Properties] of the JVM monitor resources.
Statistical information is collected and output to its corresponding JVM statistical log when an item is selected and the threshold value is set for the item. If a monitor item is not selected, statistical information on the item will be neither collected nor output to its corresponding JVM statistical log.
The following table lists the monitor items and the corresponding JVM statistics logs.
Monitor items
Corresponding JVM statistics log
[Memory] tab - [Monitor Heap Memory Rate]
[Memory] tab - [Monitor Non-Heap Memory Rate]
[Memory] tab-[Monitor Heap Memory Usage]
[Memory] tab -[Monitor Non-Heap Memory Usage]
jramemory.stat
[Thread] tab - [Monitor the number of Active Threads]
jrathread.stat
[GC] tab - [Monitor the time in Full GC]
[GC] tab - [Monitor the count of Full GC execution]
jragc.stat
[WebLogic] tab - [Monitor the requests in Work Manager]
[WebLogic] tab - [Monitor the requests in Thread Pool]
When either of the above monitor items is checked, both of the logs, such as wlworkmanager.stat and wlthreadpool.stat, are output. No functions to output only one of the two logs are provided.
wlworkmanager.stat
wlthreadpool.stat
6.33.11. Java memory area usage check on monitor target Java VM (jramemory.stat)
The jramemory.stat log file records the size of the Java memory area used by the monitor target Java VM. Its file name will be either of the following, depending on the Rotation Type selected in the Log Output Setting dialog box.
When Cluster Properties - JVM monitor tab - Log Output Setting - Rotation Type - File Capacity is selected: jramemory<integer_starting_with_0>.stat
When Cluster Properties - JVM monitor tab - Log Output Setting - Rotation Type - Period is selected: jramemory<YYYYMMDDhhmm>.stat
The data format is as follows.
No
Format
Description
1
yyyy/mm/dd hh:mm:ss.SSS
Date and time of log recording.
2
Half-size alphanumeric characters and symbols
Name of the monitor target Java VM; this is specified in [Properties] - [Monitor(special)] tab - [Identifier] in JVM monitor resources.
3
Half-size alphanumeric characters and symbols
Name of the Java memory pool; for details, refer to "Java memory pool name".
4
Half-size alphanumeric characters and symbols
Type of Java memory pool.
Heap, Non-Heap
5
Half-size numeric characters
Memory size that the Java VM requests from the OS at startup; this is expressed in bytes. (init)
At the startup of the monitor target Java VM, the size can be specified using the following Java VM startup options.
- HEAP:-Xms
- NON_HEAP permanent area (Perm Gen): -XX:PermSize
- NON_HEAP code cache area (Code Cache): -XX:InitialCodeCacheSize
6
Half-size numeric characters
Memory size currently used by the Java VM; this is expressed in bytes. (used)
7
Half-size numeric characters
Memory size guaranteed for use by the operation of the Java VM; this is expressed in bytes. (committed)
This size varies depending on the memory use; it is always equal to the value of "used" or larger but equal to or smaller than the value of "max".
8
Half-size numeric characters
Maximum memory size that the Java VM can use; this is expressed in bytes. (max)
The size can be specified using the following Java VM startup options.
- HEAP:-Xmx
- NON_HEAP permanent area (Perm Gen): -XX:MaxPermSize
- NON_HEAP code cache area (Code Cache): -XX:ReservedCodeCacheSize
In this example, max of NON_HEAP becomes 128 m + 128 m = 256 m.
(Note)
When the same value is specified for -Xms and -Xmx, "init" may become larger than "max". This is because "max" of HEAP is determined by subtracting half the size of the Survivor Space from the area size determined by the specification of -Xmx.
9
Half-size numeric characters
Peak size of the memory used after startup of the measurement target Java VM; when the name of the Java memory pool is HEAP or NON_HEAP, this size becomes equal to that of the memory currently used by the Java VM (used). This is expressed in bytes.
10
Half-size numeric characters
Ignore this value when Oracle Java(usage monitoring) is selected for JVM Type.
When the item other than Oracle Java(usage monitoring) for JVM Type, memory size equal to "max" (No. 8 field) * the threshold (%) when the Java memory pool type (No. 4 field) is HEAP; it is expressed in bytes.
When the Java memory pool type is other than HEAP, it is 0.
6.33.12. Thread operation status check on monitor target Java VM (jrathread.stat)
The jrathread.stat log file records the thread operation status of the monitor target Java VM. Its file name will be either of the following depending on the Rotation Type selected in the Log Output Setting dialog box.
When Cluster Properties - JVM monitor tab - Log Output Setting - Rotation Type - File Capacity is selected: jrathread<integer_starting_with_0>.stat
When Cluster Properties - JVM monitor tab - Log Output Setting - Rotation Type - Period is selected: jrathread<YYYYMMDDhhmm>.stat
The data format is as follows.
No
Format
Description
1
yyyy/mm/dd hh:mm:ss.SSS
Date and time of log recording.
2
Half-size alphanumeric characters and symbols
Name of the monitor target Java VM; this is specified in [Properties] - [Monitor(special)] tab - [Identifier] in JVM monitor resources.
3
Half-size alphanumeric characters and symbols
Number of active threads in the monitor target Java VM.
Deadlocked thread ID in the monitor target Java VM; this contains the IDs of all the deadlocked threads, in order.
5
Half-size alphanumeric characters and symbols
Detailed information on deadlocked threads in the monitor target Java VM; it contains information on all the deadlocked threads, in order, in the following format.
6.33.13. GC operation status check on monitor target Java VM (jragc.stat)
The jragc.stat log file records the GC operation status of the monitor target Java VM. Its file name will be either of the following, depending on the Rotation Type selected in the Log Output Setting dialog box.
When Cluster Properties - JVM monitor tab - Log Output Setting - Rotation Type - File Capacity is selected: jragc<integer_starting_with_0>.stat
When Cluster Properties - JVM monitor tab - Log Output Setting -Rotation Type - Period is selected: jragc<YYYYMMDDhhmm>.stat
JVM monitor resources output two types of GC information: Copy GC and Full GC.
With Oracle Java, JVM monitor resources count the increment in the count of execution of the following GC as Full GC.
MarkSweepCompact
PS MarkSweep
ConcurrentMarkSweep
G1 Old Generation
The data format is as follows.
No
Format
Description
1
yyyy/mm/dd hh:mm:ss.SSS
Date and time of log recording.
2
Half-size alphanumeric characters and symbols
Name of the monitor target Java VM; this is specified in [Properties] - [Monitor(special)] tab - [Identifier] in JVM monitor resources.
3
Half-size alphanumeric characters and symbols
GC name of monitor target Java VM.
When the monitor target Java VM is Oracle Java
The GC name to be indicated is one of the following.
Copy
MarkSweepCompact
PS Scavenge
PS MarkSweep
ParNew
ConcurrentMarkSweep
G1 Young Generation
G1 Old Generation
G1 Concurrent GC(Only for Java 20 or later, it is output.)
When the monitor target Java VM is Oracle JRockit
The GC name to be indicated is one of the following.
Garbage collection optimized for throughput Old Collector
Garbage collection optimized for short pausetimes Old Collector
Garbage collection optimized for deterministic pausetimes Old Collector
Static Collector
Static Old Collector
Garbage collection optimized for throughput Young Collector
4
Half-size numeric characters
Count of GC execution during the period from startup of the monitor target Java VM to measurement; the count includes the GC executed before the JVM monitor resource starts monitoring.
5
Half-size numeric characters
Total time in GC execution during the period from startup of the monitor target Java VM to measurement; this is expressed in milliseconds. This includes the time taken for the GC executed before the JVM monitor resource starts monitoring.
6.33.14. Operation status check on Work Manager of WebLogic Server (wlworkmanager.stat)
The wlworkmanager.stat log file records the operation status of the Work Manager of the WebLogic Server. Its file name will be either of the following depending on the Rotation Type selected in the Log Output Setting dialog box.
When Cluster Properties - JVM monitor tab - Log Output Setting - Rotation Type - File Capacity is selected: wlworkmanager<integer_starting_with_0>.stat
When Cluster Properties - JVM monitor tab - Log Output Setting - Rotation Type - Period is selected: wlworkmanager<YYYYMMDDhhmm>.stat
The data format is as follows.
No
Format
Description
1
yyyy/mm/dd hh:mm:ss.SSS
Date and time of log recording.
2
Half-size alphanumeric characters and symbols
Name of the monitor target Java VM; this is specified in [Properties] - [Monitor(special)] tab - [Identifier] in JVM monitor resources.
3
Half-size alphanumeric characters and symbols
Application name.
4
Half-size alphanumeric characters and symbols
Work Manager name.
5
Half-size numeric characters
Request execution count.
6
Half-size numeric characters
Number of wait requests.
6.33.15. Operation status check on Thread Pool of WebLogic Server (wlthreadpool.stat)
The wlthreadpool.stat log file records the operation status of the thread pool of the WebLogic Server. Its file name will be either of the following depending on the Rotation Type selected in the Log Output Setting dialog box.
When Cluster Properties - JVM monitor tab - Log Output Setting - Rotation Type - File Capacity is selected: wlthreadpool<integer_starting_with_0>.stat
When Cluster Properties - JVM monitor tab - Log Output Setting - Rotation Type - Period is selected: wlthreadpool<YYYYMMDDhhmm>.stat
The data format is as follows.
No
Format
Description
1
yyyy/mm/dd hh:mm:ss.SSS
Date and time of log recording.
2
Half-size alphanumeric characters and symbols
Name of monitor target Java VM; this is specified in [Properties] - [Monitor(special)] tab - [Identifier] in JVM monitor resources.
This section describes the Java memory pool name output as memory_name in messages to the JVM operation log file. It also describes the Java memory pool name output to the JVM statistics log file, jramemory.stat log file.
The character strings of the Java memory pool names are not determined by the JVM monitor resources. Character strings received from the monitor target Java VM are output as Java memory pool names.
Their specifications are not open for Java VM, and accordingly, are subject to change without notice with any version upgrade of Java VM.
Therefore, we do not recommend monitoring Java memory pool names contained in messages.
The following monitor items see the parameters on the [Memory] tab of the [Monitor(special)] tab in [Properties] of the JVM monitor resources.
The following Java memory pool names have been confirmed on actual machines running Oracle Java and JRockit.
When [Oracle Java] is selected for [JVM Type] and "-XX:+UseSerialGC" is specified as a startup option for the monitor target Java VM, the No. 3 Java memory pool name in the jramemory.stat log file will be as follows.
When [Oracle Java] is selected for [JVM Type] and "-XX:+UseParallelGC" and "-XX:+UseParallelOldGC" are specified as the startup options for the monitor target Java VM, the No. 3 Java memory pool name in the jramemory.stat log file will be as follows.
When [Oracle Java] is selected for [JVM Type] and "-XX:+UseConcMarkSweepGC" is specified as a startup option for the monitor target Java VM, the No. 3 Java memory pool name in the jramemory.stat log file will be as follows.
When [Oracle Java(usage monitoring)] is selected for [JVM Type] and "-XX:+UseSerialGC" is specified as a startup option for the monitor target Java VM, the No. 3 Java memory pool name in the jramemory.stat file will be as follows.
[Monitor Non-Heap Memory Usage]-[Compressed Class Space]
Compressed Class Space
When [Oracle Java(usage monitoring)] is selected for [JVM Type] and "-XX:+UseParallelGC" is specified as a startup option for the monitor target Java VM, the No. 3 Java memory pool name in the jramemory.stat file will be as follows.
[Monitor Non-Heap Memory Usage]-[Compressed Class Space]
Compressed Class Space
When [Oracle Java(usage monitoring)] is selected for [JVM Type] and "-XX:+UseParNewGC" is added as a startup option of the target Java VM, the No. 3 Java memory pool name in the jramemory.stat file will be as follows. For Java 9 or later, if -XX:+UseParNewGC is specified, the monitor target Java VM does not start.
[Monitor Non-Heap Memory Usage]-[Compressed Class Space]
Compressed Class Space
When [Oracle Java(usage monitoring)] is selected for [JVM Type] and "-XX:+UseG1GC" is specified as a startup option for the monitor target Java VM the No. 3 Java memory pool name in the jramemory.stat file will be as follows.
[Monitor Non-Heap Memory Usage]-[Compressed Class Space]
Compressed Class Space
When the monitor target Java VM is Oracle JRockit (when [JRockit] is selected for [JVM Type]), the No. 3 Java memory pool name in the jramemory.stat log file will be as follows.
Monitor item
Character string output as memory_name
[Monitor Heap Memory Rate] - [Total Usage]
HEAP memory
[Monitor Heap Memory Rate] - [Nursery Space]
Nursery
[Monitor Heap Memory Rate] - [Old Space]
Old Space
[Monitor Non-Heap Memory Rate] - [Total Usage]
NON_HEAP
[Monitor Non-Heap Memory Rate] - [Class Memory]
Class Memory
Java memory pool names appearing in the jramemory.stat log file, a JVM statistics log file, correspond to the Java VM memory space as follows.
6.33.17. Executing a command corresponding to cause of each detected error
EXPRESSCLUSTER does not provide a means for executing specific commands based on the causes of detected monitor resource errors.
JVM monitor resources can execute specific commands according to error causes. If an error is detected, JVM monitor resources will execute an appropriate command.
The following setting items specify the commands that will be executed according to the error cause.
Error cause
Setting item
- Failure in connection to the monitor target Java VM
[Command] passes the details of an error cause as the arguments of a command with the arguments attached to the end of [Command]. A Command that is specialized for dealing with specific error causes can be defined by designing and specifying a script etc. for [Command]. The following character strings are passed as the arguments.
When multiple character strings are stated as possible arguments, one will be passed according to the GC type of the monitor target Java VM. For details about their differences, see "Java memory pool name".
The statements "(For Oracle Java)" and "(For Oracle JRockit)" suggest that different character strings are used according to the JVM type. When there is no such statement, the same character strings are used equally for all JVM types.
Details of error causes
Character string passed as argument
- Failure in connection to the monitor target Java VM
If Full GC is executed as many times, in succession, as specified by the Error Threshold (three times), the JVM monitor resources will detect a monitor error and execute a command corresponding to "/usr/local/bin/downcmd Cont".
If the time in Full GC exceeds 65535 milliseconds as many times, in succession, as specified by the Error Threshold (three times), the JVM monitor resources will detect a monitor error and execute a command corresponding to "/usr/local/bin/downcmd GC Time".
If the usage rate of the Java Eden Space and that of the Java Survivor Space exceed 80% as many times, in succession, as specified by the Error Threshold (three times), the JVM monitor resources will detect a monitor error and execute a command corresponding to "/usr/local/bin/downcmd memory EdenSpace SurvivorSpace".
Timeout (seconds) for waiting for the completion of execution of the command specified by [Command] is set by specifying Command Timeout in the JVM monitor tab of the Cluster Properties window. The same value is applied to the timeout of [Command] of each of the above-mentioned tabs; the timeout cannot be specified for each [Command] separately.
If a timeout occurs, the system will not perform processing for forced termination of the [Command] process; the operator must perform post-processing (e.g. forced termination) of the [Command] process. When a timeout occurs, the following message is output to the JVM operation log:
action thread execution did not finish. action is alive = <command>.
Note the following.
No [Command] is executed when restoration of the Java VM to normal operation (error -> normal operation) is detected.
[Command] is executed upon the detection of an error in the Java VM (when threshold exceeding occurs as many times, in succession, as specified by the error threshold). It is not executed at each threshold exceeding.
Note that specifying [Command] on multiple tabs allows multiple commands to be executed if multiple errors occur simultaneously, causing a large system load.
[Command] may be executed twice simultaneously when the following two items are monitored: [Monitor(special)] tab - [Tuning] properties - [WebLogic] tab - [Monitor the requests in Work Manager] - [Waiting Requests, The Number]; [Monitor(special)] tab - [Tuning] properties - [WebLogic] tab - [Monitor the requests in Work Manager] - [Waiting Requests, Average].
This is because errors may be detected simultaneously for the following two items: [Cluster] properties - [JVM monitor] tab - [Resource Measurement Setting] - [WebLogic] tab - [Interval, The number of request]; [Cluster] properties - [JVM monitor] tab - [Resource Measurement Setting] - [WebLogic] tab - [Interval, The average number of the request]. To prevent this from occurring, specify only one of the two items as a monitor target. This applies to the following combinations of monitor items.
[Monitor(special)] tab - [Tuning] properties - [WebLogic] tab - [Monitor the requests in Thread Pool] - [Waiting Requests, The Number] and [Monitor(special)] tab - [Tuning] properties - [WebLogic] tab - [Monitor the requests in Thread Pool] - [Waiting Requests, Average]
[Monitor(special)] tab - [Tuning] properties - [WebLogic] tab - [Monitor the requests in Thread Pool] - [Executing Requests, The Number] and [Monitor(special)] tab - [Tuning] properties - [WebLogic] tab - [Monitor the requests in Thread Pool] - [Executing Requests, Average]
For how to start the operation of the configured target WebLogic Server as an application server, see the manual for WebLogic Server.
This section describes only the settings required for monitoring by the JVM monitor resource.
Start WebLogic Server Administration Console.
For how to start WebLogic Server Administration Console, refer to "Overview of Administration Console" in the WebLogic Server manual.
Select Domain Configuration-Domain-Configuration-General. Make sure that Enable Management Port is unchecked.
Select Domain Configuration-Server, and then select the name of the server to be monitored. Set the selected server name as the identifier on the Monitor (special) tab from Properties that can be selected in the config mode of Cluster WebUI. See "Understanding JVM monitor resources" in "Monitor resource details" in the "Reference Guide" of EXPRESSCLUSTER X.
Regarding the target server, select Configuration-General, and then check the port number though which a management connection is established with Listen Port.
Stop WebLogic Server. For how to stop WebLogic Server, refer to "Starting and stopping WebLogic Server" in the WebLogic Server manual.
Start the management server start script of WebLogic Server (startWebLogic.sh).
Write the following instructions in the script.
When the target is the WebLogic Server managing server:
For n, specify the number of the port used for monitoring. The specified port number must be different from that of the listen port for the target Java VM. If there are other target WebLogic Server entities on the same machine, specify a port number different from those for the listening port and application ports of the other entities.
Note
For SERVER_NAME, specify the name of the target server confirmed by Select Target Server. If more than one server is targeted, change the server name on the settings (line 1 to 6) for each server.
Note
Place the above addition prior to the following coding:
This section describes how to configure a target WebOTX to enable monitoring by the JVM monitor resource.
Start the WebOTX Administration Console. For how to start the WebOTX Administration Console, refer to "Starting and stopping administration tool" in the WebOTX Operation (Web Administration Tool).
The settings differ depending on whether a Java process of the JMX agent running on WebOTX or the Java process of a process group is to be monitored. Configure the settings according to the target of monitoring.
6.33.20. Monitoring a Java process of the WebOTX domain agent
There is no need to specify any settings.
6.33.21. Monitoring a Java process of a WebOTX process group
Connect to the domain by using the administration tool.
In the tree view, select <domain_name>-TP System-Application Group-<application_group_name>-Process Group-<process_group_name>.
For the Other Arguments attributes on the JVM Options tab on the right, specify the following Java options on one line. For n, specify the port number. If there is more than one Java VM to be monitored on the same machine, specify a unique port number. The port number specified for the settings is specified with Cluster WebUI (JVM Monitor Resource Name -> Property -> Monitor (special) tab -> Connection Port).
* In the case of WebOTX V9.2 or later, it is unnecessary to specify -Djavax.management.builder.initial.
Then, click Update. After the configuration is completed, restart the process group.
These settings can be made by using Java System Properties, accessible from the Java System Properties tab of the WebOTX administration tool. When making these settings by using the tool, do not designate -D and set the strings prior to = in name and set the strings subsequent to = in value.
Tab name for setting
Item name
Setting value
Monitor(common)
Monitor Timing
Always
Recovery Action
Recovery Action
Execute only the final action
Recovery Action
Final Action
No operation
Note
If restart upon a process failure is configured as a function of the WebOTX process group, and when the process group is restarted as the recovery processing by EXPRESSCLUSTER, the WebOTX process group may fail to function correctly. For this reason, when monitoring the WebOTX process group, make the following settings for the JVM monitor resource by using the Cluster WebUI.
By registering a specific listener class, notification is issued when WebOTX detects a failure. The JVM monitor resource receives the notification and outputs the following message to the JVM operation log.
%1$s:Notification received. %2$s.
%1$s and %2$s each indicates the following:
%1$s: Monitored Java VM
%2$s: Message in the notification (ObjectName=,type=,message=)
At present, the following is the detailed information on MBean on the monitorable resource.
The settings are different for monitoring standalone mode and for domain mode. Configure the settings according to the target of monitoring.
This section describes how to configure a target JBoss to be monitored by the JVM monitor resource.
Standalone mode
Stop JBoss, and then open (JBoss_installation_path)/bin/standalone.conf by using editor software.
In the configuration file, enter the following depending on the version of JDK. specify the following settings. For n, specify the port number. If there is more than one Java VM to be monitored on the same machine, specify a unique port number. The port number specified for the settings is specified with Cluster WebUI (JVM Monitor Resource Name - Property - Monitor(special) tab - Connection Port).
If you use JDK10 or lower, make the following change:
Add the following before "if [ "x$JBOSS_MODULES_SYSTEM_PKGS" = "x" ]; then".
JBOSS_MODULES_SYSTEM_PKGS="org.jboss.logmanager"
Add the following after "if [ "x$JAVA_OPTS" = "x" ]; then ... fi:".
* The storage directory and file name of jboss-logmanager-*.jar differ depending on the JBoss version. Therefore, specify the path according to the installation environment.
Save the settings, and then start JBoss.
With Cluster WebUI (JVM Monitor Resource Name - Property - Monitor(special) tab - Identifier), specify a unique string that is different from those for the other monitor targets (e.g. JBoss).
Domain mode
With Cluster WebUI (JVM Monitor Resource Name - Property - Monitor(special) tab - Identifier), specify a unique string that is different from those for the other monitor targets (e.g. JBoss). With Cluster WebUI (JVM Monitor Resource Name - Property - Monitor(special) tab - Process Name), specify all the Java VM startup options so that JBoss can be uniquely identified.
This section describes how to configure a target Tomcat to be monitored by the JVM monitor resource.
If Tomcat is installed from an rpm package, stop Tomcat and open /etc/sysconfig/tomcat6 or /etc/sysconfig/tomcat. If Tomcat is not installed from an rpm package, stop Tomcat and create (Tomcat installation path)/bin/setenv.sh.
In the configuration file, for the Java options, specify the following settings on one line. For n, specify the port number. If there is more than one Java VM to be monitored on the same machine, specify a unique port number. The port number specified for the settings is specified with Cluster WebUI (JVM Monitor Resource Name - Property - Monitor (special) tab - Connection Port).
With Cluster WebUI (JVM Monitor Resource Name - Property - Monitor (special) tab - Identifier), specify a unique string that is different from those for the other monitor targets (e.g., tomcat).
This section describes how to configure a target SVF to be monitored by the JVM monitor resource.
If the monitor target is Tomcat:
Change the environment variables of the SVF user in the OS as follows. For n, specify the port number. If there is more than one Java VM to be monitored on the same machine, specify a unique port number. The port number specified here is also specified with the Builder (JVM Monitor Resource Name -> Property -> Monitor (special) tab -> Connection Port).
In the configuration file, for the Java options, specify the following settings on one line. For n, specify the port number. If there is more than one Java VM to be monitored on the same machine, specify a unique port number. The port number specified here is also specified with the Cluster WebUI (JVM Monitor Resource Name -> Property -> Monitor (special) tab -> Connection Port).
6.33.26. Monitoring a Java application that you created
This section describes the procedure to configure Java application which is monitored by JVM monitor resource. Specify the following Java option in one row to the option for Java application startup while Java application (the monitor target) is stopped. In the configuration file, for the Java options, specify the following settings on one line. For n, specify the port number. If there is more than one Java VM to be monitored on the same machine, specify a unique port number. The port number specified here is also specified with the Cluster WebUI (JVM Monitor Resource Name -> Property -> Monitor (special) tab -> Connection Port).
System monitor resources periodically collect statistical information about system resources analyze the information according to given knowledge data. System monitor resources serve to detect the exhaustion of resources early according to the results of analysis.
Specify the threshold for the detection of the CPU usage.
Duration Time (1 to 1440)
Specify the duration for detecting the CPU usage.
If the threshold is continuously exceeded over the specified duration, the detection of an error is recognized.
Monitoring total usage of memory
Enables the monitoring of the total usage of memory.
When selected:
Monitoring is enabled for the total usage of memory.
When cleared:
Monitoring is disabled for the total usage of memory.
Total usage of memory (1 to 100)
Specify the threshold for the detection of a memory use amount error (percentage of the memory size implemented on the system).
Duration Time (1 to 1440)
Specify the duration for detecting a total memory usage error.
If the threshold is continuously exceeded over the specified duration, the detection of an error is recognized.
Monitoring total usage of virtual memory
Enables the monitoring of the total usage of virtual memory.
When selected:
Monitoring is enabled for the total usage of virtual memory.
When cleared:
Monitoring is disabled for the total usage of virtual memory.
Total usage of virtual memory (1 to 100)
Specify the threshold for the detection of a virtual memory usage error.
Duration Time (1 to 1440)
Specify the duration for detecting a total virtual memory usage error.
If the threshold is continuously exceeded over the specified duration, the detection of an error is recognized.
Monitoring total number of opening files
Enables the monitoring of the total number of opening files.
When selected:
Monitoring is enabled for the total number of opening files.
When cleared:
Monitoring is disabled for the total number of opening files.
Total number of opening files (in a ratio comparing with the system upper limit) (1 to 100)
Specify the threshold for the detection of an error related to the total number of opening files (percentage of the system upper limit).
Duration Time (1 to 1440)
Specify the duration for detecting an error with the total number of opening files.
If the threshold is continuously exceeded over the specified duration, the detection of an error is recognized.
Monitoring total number of running threads
Enables the monitoring of the total number of running threads.
When selected:
Monitoring is enabled for the total number of running threads.
When cleared:
Monitoring is disabled for the total number of running threads.
Total number of runningthreads (1 to 100)
Specify the threshold for the detection of an error related to the total number of running threads (percentage of the system upper limit).
Duration Time (1 to 1440)
Specify the duration for detecting an error with the total number of running threads.
If the threshold is continuously exceeded over the specified duration, the detection of an error is recognized.
Monitoring number of running processes of each user
Enables the monitoring of the number of processes being run of each user.
When selected:
Monitoring is enabled for the number of processes being run of each user.
When cleared:
Monitoring is disabled for the number of processes being run of each user.
Number of running processes of each user (1 to 100)
Specify the threshold for the detection of an error related to the number of processes being run of each user (percentage of the system upper limit).
Duration Time (1 to 1440)
Specify the duration for detecting an error with the number of processes being run of each user.
If the threshold is continuously exceeded over the specified duration, the detection of an error is recognized.
Add
Click this to add disks to be monitored. The Input of watch condition dialog box appears.
Configure the detailed monitoring conditions for error determination, according to the descriptions given in the Input of watch condition dialog box.
Remove
Click this to remove a disk selected in Disk List so that it will no longer be monitored.
Edit
Click this to display the Input of watch condition dialog box. The dialog box shows the monitoring conditions for the disk selected in Disk List. Edit the conditions and click OK.
Mount point (within 1,024 bytes)
Set the mount to be monitored. The name must begin with a forward slash (/).
Utilization rate
Enables the monitoring of the disk usage.
When selected:
Monitoring is enabled for the disk usage.
When cleared:
Monitoring is disabled for the disk usage.
Warning level (1 to 100)
Specify the threshold for warning level error detection for disk usage.
Notice level (1 to 100)
Specify the threshold for notice level error detection for disk usage.
Duration Time (1 to 43200)
Specify the duration for detecting a notice level error of the disk usage rate.
If the threshold is continuously exceeded over the specified duration, the detection of an error is recognized.
Free space
Enables the monitoring of the free disk space.
When selected:
Monitoring is enabled for the free disk space.
When cleared:
Monitoring is disabled for the free disk space.
Warning level (1 to 4294967295)
Specify the amount of disk space (in megabytes) for which the detection of an free disk space error at the warning level is recognized.
Notice level (1 to 4294967295)
Specify the amount of disk space (in megabytes) for which the detection of an free disk space error at the notice level is recognized.
Duration Time (1 to 43200)
Specify the duration for detecting a notice level error related to the free disk space.
If the threshold is continuously exceeded over the specified duration, the detection of an error is recognized.
i-node utilization rate
Enables the monitoring of the inode usage.
When selected:
Monitoring is enabled for the inode usage.
When cleared:
Monitoring is disabled for the inode usage.
Warning level (1 to 100)
Specify the threshold for warning level error detection for inode usage.
Notice level (1 to 100)
Specify the threshold for notice level error detection for inode usage.
Duration Time (1 to 43200)
Specify the duration for detecting a notice level error of the inode usage rate.
If the threshold is continuously exceeded over the specified duration, the detection of an error is recognized.
For the recovery target, specify the resource to which fail-over is performed upon the detection of an error in resource monitoring by System Resource Agent.
The use of the default System Resource Agent settings is recommended.
Errors in resource monitoring may be undetectable when:
A value repeatedly exceeds and then falls below a threshold during whole system resource monitoring.
If the date or time of the OS has been changed while System Resource Agent is running, resource monitoring may operate incorrectly as described below since the timing of analysis which is normally done at 10 minute intervals may differ the first time after the date or time is changed.
If either of the following occur, suspend and resume cluster.
No error is detected even after the specified duration for detecting errors has passed.
An error is detected before the specified duration for detecting errors has elapsed.
Once the cluster has been suspended and resumed, the collection of information is started from that point of time.
The amount of system resources used is analyzed at 10-minute intervals. Thus, an error may be detected up to 10 minutes after the monitoring session.
The amount of disk resources used is analyzed at 60-minute intervals. Thus, an error may be detected up to 60 minutes after the monitoring session.
Specify a value smaller than the actual disk size when specifying the disk size for free space monitoring of a disk resource. If a value is specified that is larger than the actual disk size, an error will be detected due to insufficient free space.
If the monitored disk has been replaced, analyzed information up until the time of the disk replacement will be cleared if one of the following items of information differs between the previous and current disks.
Total disk capacity
File system
Disk resource monitoring can only monitor disk devices.
For server for which no swap was allocated, uncheck the monitoring of total virtual memory usage.
Disk usage information collected by System Resource Agent is calculated by using the total disk space and free disk space. This value may slightly differ from the disk usage which df(1) command shows because it uses a different calculation method.
Up to 64 disk units can be simultaneously monitored by the disk resource monitoring function.
System monitor resource collected statistics information and analysis information, it outputs. When the number of these files reached following biggest number, it's eliminated from an old file.
(<data path> in following text is "<EXPRESSCLUSTER_install_path >/ha/sra/data/".)
6.34.3. How System monitor resources perform monitoring
System monitor resources monitor the following:
Periodically collect the amounts of system resources and disk resources used and then analyze the amounts.
An error is recognized if the amount of a resource used exceeds a pre-set threshold.
When an error detected state persists for the monitoring duration, it is posted as an error detected during resource monitoring.
System resource monitoring with the default values reports an error found in resource monitoring 60 minutes later if the resource usage does not fall below 90%.
The following shows an example of error detection for the total memory usage in system resource monitoring with the default values.
The total memory usage remains at the total memory usage threshold or higher as time passes, for at least a certain duration of time.
In the figure below, the total memory usage remains at the total memory usage threshold (90%) or higher for at least the monitoring duration (60 minutes) and thus an error in total memory usage is detected.
Fig. 6.17 The total memory usage remains at the total memory usage threshold or higher for a certain duration of time
The total memory usage rises and falls in the vicinity of the total memory usage threshold as time passes, but always remains under that threshold.
The following figure shows the total memory usage temporarily exceeding the total memory usage threshold (90%).
This state of exceeding the threshold, however, does not persist for the monitoring duration (60 minutes) and thus an error in the total memory usage is not detected.
Fig. 6.18 The state of exceeding the total memory usage threshold does not persist for a certain duration of time (no error detected)
If disk resource monitoring operated under the default settings, it will report a notice level error after 24 hours.
The following chart describes how disk resource monitoring detects disk usage errors when operating under the default settings.
Monitoring disk usage by warning level
In the following example, disk usage exceeds the threshold which is specified as the warning level upper limit.
Disk usage exceeds the warning level upper limit, which is determined as an error in monitoring the disk usage.
Fig. 6.19 Disk usage exceeds the warning level upper limit (an error detected)
In the following example, disk usage increases and decreases within certain range, and does not exceed the threshold which is specified as the warning level upper limit.
Disk usage increases and decreases in a range where it does not exceed the warning level upper limit, which is not determined as an error in monitoring the disk usage.
Fig. 6.20 Disk usage does not exceed the warning level upper limit (no error detected)
Monitoring disk usage by notice level
In the following example, disk usage continuously exceeds the threshold specified as the notification level upper limit, and the duration exceeds the set length.
Disk usage continuously exceeds the notification level upper limit, which is determined as an error in monitoring the disk usage.
Fig. 6.21 Disk usage exceeds the notification level upper limit for a certain duration of time (an error detected)
In the following example, disk usage increases and decreases within a certain range, and does not exceed the threshold specified as the notification level upper limit.
Disk usage rises and falls in the vicinity of the notification level upper limit, which is not determined as an error in monitoring the disk usage.
Fig. 6.22 The state of exceeding the notification level threshold in disk usage does not persist for a certain duration of time (no error detected)
6.35. Setting up Process resource monitor resources
Process resource monitor resources periodically collect statistical information about resources used by processes and analyze the information according to given knowledge data. Process resource monitor resources serve to detect the exhaustion of resources early according to the results of analysis.
Set the name of the target process. Without setting it, all started processes are monitored.
Wild cards can be used to specify a process name by using one of the following three patterns. No other wild card pattern is permitted.
[prefix search] <string included in the process name>*
[suffix search] *<string included in the process name>
[partial search] *<string included in the process name>*
Up to 1023 bytes can be specified for the monitor target process name. To specify a monitor target process with a name that exceeds 1023 bytes, use a wildcard (such as *).
If the name of the target process is 1024 bytes or longer, only the first 1023 bytes can be recognized as the process name. If you use a wild card (such as *) to specify a process name, specify a string containing the first 1024 or fewer bytes.
Check the monitor target process name which is actually running by ps(1) command, etc, and specify the monitor target process name.
From the above command result, /usr/sbin/htt -retryonerror 0 is specified as monitor target process name in the case of monitoring /usr/sbin/htt.
The process name specified for the name of the target process specifies the target process, using the process arguments as part of the process name. To specify the name of the target process, specify the process name containing the arguments. To monitor only the process name with the arguments excluded, specify it with the wildcard (*) using right truncation or partial match excluding the arguments.
Monitoring CPU usage
Enables CPU usage monitoring.
When the check box is selected:
Monitoring is enabled for the CPU usage.
When the check box is not selected:
Monitoring is disabled for the CPU usage.
CPU usage (1 to 100)
Specify the threshold for the detection of the CPU usage.
Duration Time (1 to 129600)
Specify the duration for detecting the CPU usage.
If the threshold is continuously exceeded over the specified duration, the detection of an error is recognized.
Monitoring usage of memory
Enables the monitoring of the usage of memory.
When the check box is selected:
Monitoring is enabled for the usage of memory.
When the check box is not selected:
Monitoring is disabled for the usage of memory.
Rate of Increase from the First Monitoring Point (1 to 1000)
Specify the threshold for the detection of a memory use amount error.
Maximum Update Count (1 to 129600)
Specify the maximum update count for the detection of a memory use amount error.
Exceeding the threshold consecutively by the specified count leads to the error detection.
Monitoring number of opening files(maximum number)
Enables the monitoring of the number of opening files(maximum number).
When the check box is selected:
Monitoring is enabled for the number of opening files.
When the check box is not selected:
Monitoring is disabled for the number of opening files.
Refresh Count (1 to 1024)
Specify the refresh count for the detection of the number of opening files error.
If the number of opening files maximum value is updated more count than specified, the detection of an error is recognized.
Monitoring number of opening files(kernel limit)
Enables the monitoring of the number of opening files(kernel limit).
When the check box is selected:
Monitoring is enabled for the number of opening files.
When the check box is not selected:
Monitoring is disabled for the number of opening files.
Ratio (1 to 100)
Specify the ratio for detection of the opening files(the percentage to the kernel limit).
Monitoring number of running threads
Enables the monitoring of the number of running threads.
When the check box is selected:
Monitoring is enabled for the number of running threads.
When the check box is not selected:
Monitoring is disabled for the number of running threads.
Duration Time (1 to 129600)
Specify the duration for detecting an error with the number of running threads.
If the threshold is continuously exceeded over the specified duration, the detection of an error is recognized.
Monitoring Zombie Process
Enables the monitoring of Zombie Processes.
When the check box is selected:
Monitoring is enabled for the Zombie Processes.
When the check box is not selected:
Monitoring is disabled for the Zombie Processes.
Duration Time (1 to 129600)
Specify the duration for detecting Zombie Processes.
If process is a Zombie Process over the specified duration, the detection of an error is recognized.
Monitoring Processes of the Same Name
Enables the monitoring of Processes of the Same Name.
When the check box is selected:
Monitoring is enabled for the Processes of the Same Name.
When the check box is not selected:
Monitoring is disabled for the Processes of the Same Name.
Count (1 to 10000)
Specify the count for detecting an error with the processes of the same name.
If the processes of the same name has been exists more than specified numbers, the detection of an error is recognized.
6.35.2. Notes on Process resource monitor resource
The use of the default Process resource monitor resource settings is recommended.
Swapped out processes are not subject to the detection of resource errors.
If the date or time of the OS has been changed while System Resource Agent is running, resource monitoring may operate incorrectly as described below since the timing of analysis which is normally done at 10 minute intervals may differ the first time after the date or time is changed.
No error is detected even after the specified duration for detecting errors has passed.
An error is detected before the specified duration for detecting errors has elapsed.
Once the cluster has been suspended and resumed, the collection of information is started from that point of time.
Process resource monitor resource collected statistics information and analysis information, it outputs. When the number of these files reached following biggest number, it's eliminated from an old file.
(<data path> in following text is "<EXPRESSCLUSTER_install_path >/ha/sra/data/".)
Statistical information data of process resources.
To return the status of the process resource monitor resource from error to normal, perform either of the following:
Suspending and resuming the cluster
Stopping and starting the cluster
6.35.3. How Process resource monitor resources perform monitoring
Process resource monitor resources monitor the following:
Periodically collect the amounts of process resources used and then analyze the amounts
An error is recognized if the amount of a resource used exceeds a pre-set threshold.
When an error detected state persists for the monitoring duration, it is posted as an error detected during resource monitoring.
If process resource monitoring (of the CPU, memory, number of opening files, or number of zombie processes) operated by using the default values, a resource error is reported after 24 hours.
The following chart describes how process resource monitoring detects memory usage errors.
In the following example, as time progresses, memory usage increases and decreases, the maximum value is updated more times than specified, and increases by more than 10% from its initial value.
The maximum value is kept updated for more than 24 hours (default) and the memory usage increases by more than 10% from its initial value, which is determined as a memory leak.
Fig. 6.23 The maximum value of the memory usage is updated more than the specified number of times, and the memory usage increases by more than 10% from its initial value (an error detected)
In the following example, memory usage increases and decreases, but remains within a set range.
The memory usage increases and decreases within a set range, which is not determined as a memory leak.
Fig. 6.24 The memory usage increases and decreases within a set range (no error detected)
This chapter provides detailed information on heartbeat resources.
EXPRESSCLUSTER X SingleServerSafe uses windows common to those of the clustering software EXPRESSCLUSTER X to ensure high compatibility with EXPRESSCLUSTER X in terms of operation and other aspects.
This chapter provides details about the other items to be specified for EXPRESSCLUSTER X SingleServerSafe.
EXPRESSCLUSTER X SingleServerSafe uses windows common to those of the clustering software EXPRESSCLUSTER X to ensure high compatibility with EXPRESSCLUSTER X in terms of operation and other aspects.
Specify how long starting the cluster service should be delayed in starting the OS.
Server Sync Wait Time (0 to 99)
Not used.
Heartbeat
Heartbeat interval and heartbeat time-out.
Interval (1 to 99)
Interval of heartbeats.
Timeout (2 to 9999)
A failed server is determined if there is no response for the time specified here.
This time-out should be longer than the interval.
Server Internal Timeout (1 to 9999)
The timeout to be used in the EXPRESSCLUSTER Server internal communications that are performed while an EXPRESSCLUSTER command is executed, or an operation is performed or a screen is displayed by Cluster WebUI.
Additionally, you can temporarily change the internal communication timeout by using the [--apito] option with the following command:
clpgrp
clprsc
clpdown
clpstdn
clpcl
Note
It is recommended to use the default value.
Setting this parameter to an extremely large value significantly affects, in case of a heartbeat loss, the time for executing the clpstat command or for displaying Cluster WebUI.
Initialize
Used for initializing the value to the default value. Click Initialize to initialize all the items to their default values.
This port number is used for transactions such as applying and backing up the configuration data, sending and receiving the license data, and running commands.
Monitors whether or not the operating system is stalling when an EXPRESSCLUSTER command to shut down the server is run. The cluster service forcibly resets the operating system or performs a panic of the operating system if it determines the OS stall. Server panic can be set when the monitoring method is keepalive.
Always execute:
If selected, the shutdown monitor is performed on all occasions.
Execute when the group deactivation has been failed:
The shutdown monitor is applied only when a group cannot be deactivated.
Not execute:
If selected, the shutdown monitor is not performed.
Method
Select the shutdown monitor method from:
softdog
ipmi
keepalive
Operation at Timeout Detection
Selects the operation performed when the operating system is determined to be stalled.
RESET
Resets the server.
PANIC
Performs a panic of the server. This can be set only when the monitoring method is keepalive.
NMI
NMI occur on the server. This can be set only when the monitoring method is ipmi.
Enable SIGTERM handler
Select this to enable SIGTERM handler when performing the shutdown monitor.
Note
If you select ipmi in Method and set Enable SIGTERM handler to Off, this may be reset even if the operating system is successfully shut down.
Use Heartbeat Timeout
Select this for heartbeat time-out to work in conjunction with shutdown monitoring time-out.
Set Timeout(2 to 9999)
Specify a time-out when the heartbeat time-out value is not used as shutdown monitoring time-out.
Action When the Cluster Service Process is Failure
Specify the action against process error in daemon.
Shut down the OS
Shuts down the OS.
Reboot the OS
Reboots the OS.
Sysrq Panic
Performs the sysrq panic.
Keepalive Reset
Resets the OS using the clpkhb or clpka driver.
Keepalive Panic
Performs the OS panic using the clpkhb or clpka driver.
BMC Reset:
Hard-reboots the server.
BMC Power Off:
Turns off the server. May shut down the OS due to its ACPI configuration.
BMC Power Cycle:
Power-cycles (turns off and then back on again) the server. May shut down the OS due to its ACPI configuration.
BMC NMI:
Generates an NMI for the server. The behavior after that depends on the OS configuration.
Recovery Action for HA Agents
Max Restart Count (0 to 99)
Specify the max restart count when an HA Agent error has occurred.
Recovery Action over Max Restart Count
Specify the action when an HA Agent error has occurred.
No operation
Stop the cluster service
Stops the cluster service of the server that detected an error.
Stop the cluster service and shutdown OS
Stops the cluster service of the server that detected an error, and then shuts down the OS.
Stop the cluster service and reboot OS
Stops the cluster service of the server that detected an error, and then reboots the OS.
Note
The HA process is used with the system monitor resources, the process resource monitor resources, JVM monitor resources, and the system resource information collection function.
Action at Group Resource Activation or Deactivation Stall
Specify the action to apply in the event of an activation/deactivation stall of a group resource.
Stop cluster service and shutdown OS
Stops the cluster service of the server that stalled, and then shuts down the OS.
Stop cluster service and reboot OS
Stops the cluster service of the server that stalled, and then restarts the OS.
Emergency shutdown
Shuts down the server that stalled, without awaiting a cluster-service stop.
Sysrq Panic
Performs a sysrq panic on the server that stalled.
Keepalive Reset
Use this on the server that stalled to perform an OS reset by using the clpkhb and clpka drivers.
Keepalive Panic
Use this on the server that stalled to perform an OS panic by using the clpkhb and clpka drivers.
BMC Reset:
Hard-reboots the server.
BMC Power Off:
Turns off the server. May shut down the OS due to its ACPI configuration.
BMC Power Cycle:
Power-cycles (turns off and then back on again) the server. May shut down the OS due to its ACPI configuration.
BMC NMI:
Generates an NMI for the server. The behavior after that depends on the OS configuration.
No Operation (Operates as an activity or deactivity failure)
Use this to perform recovery upon the detection of an activation/deactivation failure of a group resource. For details on the recovery operation, see "Displaying and changing the operation settings when a group resource error is detected (Common to group resources)" in "Displaying and changing the settings of group resources" in "5.Group resource details" in this guide.
Note
If a stall occurs with "Nothing (handle a stall as an activation/deactivation failure)" specified, the effect on the group resources is undefined, so we do not recommend changing the setting to "Nothing (handle a stall as an activation/deactivation failure).".
If you do specify "Nothing (handle a stall as an activation/deactivation failure)", set the recovery operation upon the detection of an activation/deactivation failure of a group resource as described below.
Activation/Deactivation Retry Threshold: 0
Failover Threshold: 0
Final Action: Action that accompanies the OS stop
Disable the Final Action when OS Stops Due to Failure Detection
Click Detailed Settings to set suppression of the final action which accompanies the OS stop caused by error detection.
Group Resource When Activation Failure Detected
If the final action caused by an activation error detection in a group resource accompanies the OS stop, the final action is suppressed.
Group Resource When Deactivation Failure Detected
If the final action caused by a deactivation error detection in a group resource accompanies the OS stop, the final action is suppressed.
Monitor Resource When Failure Detected
If the final action caused by an error detection in a monitor resource accompanies the OS stop, the final action is suppressed.
Note
The external link monitor resource does not become the target for which the final action caused by error detection is suppressed.
The following situations lead to an OS stop during the final action when an activation/deactivation error is detected in a group resource and during the final action when a monitor resource error is detected.
Cluster service stop and OS shutdown
Cluster service stop and OS restart
sysrq panic
keepalive reset
keepalive panic
BMC reset
BMC power off
BMC power cycle
BMC NMI
Disable Shutdown When Multi-Failover-Service Detected
To use the mail report function, register the Alert Service license.
Note
To use the mail report function, purchase EXPRESSCLUSTER X Alert Service 5.3 for Linux and register your license.
Enable Alert Setting
Allows changing the alert destination from the default value. To change the destination, click Edit, then set a new destination in the Change Alert Destination dialog box.
If you clear the checkbox, the destination address you have modified returns to the default settings temporarily.
Select a message destination from the following options.
System Log
This sends message to syslog of the OS.
Alert Logs
This sends messages to the Alert logs.
Mail Report
Uses the mail report function.
SNMP Trap
Uses the SNMP trap transmission function to send messages.
Message Topic
This sends message to Amazon SNS.
Alert Extension
This executes the specified function by using the alert extension function. Modify the extension settings by using the Add button and/or the Edit button. (The command must be specified within four lines.)
Add
Add a command of the alert extension function. Click Add button to display the dialog box for entering a command. Up to 4 commands can be registered with one event ID.
Remove
Click this to remove a command of the alert extension function. Select the command, and then, click Remove.
Edit
Click this to modify a command of the alert extension function. Select the command, and then, click Edit.
Command (within 511 bytes)
Enter a command such as SNMP trap to execute reporting with the absolute path. The execution results of the specified command cannot be shown.
Keyword
If you specify %%MSG%%, the body message of the target event ID is inserted.
You cannot specify multiple %%MSG%% for one command.
Configure the command within 511 bytes including the description of %%MSG%%. As blank characters can be included in %%MSG%%, specify as "%%MSG%%" when specifying it for a command argument.
Use this tab to configure the settings for the WebManager Server.
Enable WebManager Service
The WebManager service is enabled.
When selected:
The WebManager service is enabled.
When cleared:
The WebManager service is disabled.
Communication Method
HTTP
No encryption is used for communicating with a client.
HTTPS
Encryption is used for communicating with a client.
Number of sessions which can be established simultaneously (10 to 999)
Set the number of requests that can be simultaneously received from clients. If more requests than the number set here are generated, the excess requests will be discarded.
Control connection by using password
Click Settings to display the Password dialog box.
Cluster Password Method / OS Authentication Method
Choose a login method for Cluster WebUI from below.
Cluster Password Method
Performs authentication with an operation/reference password you set.
OS Authentication Method
Performs authentication with user and password of OS .
Cluster Password Method
Password for Operation
Set a password that must be entered to enable connection to the Cluster WebUI in operation mode, config mode, or verification mode.
Click Change to display the Enter Password dialog box.
Password for Reference
Set a password that must be entered to enable connection to the Cluster WebUI in reference mode. Click Change to display the Enter Password dialog box.
Old Password: (Within 255 bytes)
Enter the current password. If the password is not set, leave it blank.
New Password: (Within 255 bytes)
Enter a new password. When deleting the old password, leave it blank.
Password Confirmation: (Within 255 bytes)
Enter the password again which you entered in New Password.
OS Authentication Method
Users must be registered to the server in advance to login to Cluster WebUI. More specifically, a group must be registered to the server and the users must belong to it as the control permission of a cluster is assigned per group,
Add
Used to add a group to Authorized Group List. The Group Name dialog box appears when Add is clicked. To add a group, the Operation checkbox must be selected.
Group name (Within 255 bytes)
Enter a group name to which you want to give permission. The permission will be applied to the users belong to the group you entered. Groups must be registered to a server in advance.
Remove
Used to delete a group from Authorized Group List. Select a group you want to delete from Authorized Group List, and click Remove.
Edit
Used to edit a group. Select a group you want to edit from Authorized Group List, and click Edit. The Group Name dialog box with the selected group entered appears. The control permission does not change in this procedure.
Operation
Set control permission to a group registered in Authorized Group List.
When the checkbox is selected:
Users belong to the group can control the cluster and view the status.
When the checkbox is not selected:
Users belongs to the group can view the status only.
Login Session Lifetime Period (0 to 52560)
Time frame of login session. If this value is set to zero (0), the period becomes limitless.
Automatic Logout Time Period (0 to 99999)
Sets wait time for automatic logout if there is no communication between Cluster WebUI and the WebManager server. If this value is set to zero (0), no automatic logout occurs.
Lockout Threshold (0 to 999)
Locks out a client IP address which fails to login continuously. The client cannot login until Lockout Time passes once a client is locked out. If this value is set to zero (0), no client IP address is not be locked out.
Lockout Time (1 to 99999)
Sets lockout time for a client IP address. Once the time passes, the lockout is automatically released.
Initialize
Restores the default value. If Initialize is clicked, the values of Login Session Lifetime Period, Automatic Logout Time Period, Lockout Threshold and Lockout Time are restored to the default values.
Control connection by using client IP address
If selected, accesses are controlled by client IP addresses.
When selected:
Add, Remove and Edit are displayed.
When cleared:
Add, Remove and Edit are not displayed.
Add
Use Add to add an IP address to Connection Permit Client IP Address List. Click Add to display the IP Address Settings dialog box. Newly added IP addresses have the rights for the operation.
IP Address (within 80 bytes)
Specify a client IP address that can be connected.
IP address: 10.0.0.21
Network address: 10.0.1.0/24
Remove
Use Remove to remove an IP address from Connection Permit Client IP Address List. Select the IP address to be removed from Connection Permit Client IP Address List and then click Remove.
Edit
Use Edit to edit an IP address. Select an IP address you want to edit from Connection Permit Client IP Address List and then click Edit. A dialog box where the specified IP address is preset is displayed. The rights for operating the edited IP addresses remain the same.
Note
The client IP address used to allow this connection is also used to restrict connections for external operations using clprexec.
Operation
Sets the operation rights for IP addresses that are registered in Connection Permit Client IP Address List.
When selected:
A client can operate EXPRESSCLUSTER X SingleServerSafe and display its status.
When cleared:
The client can only display the status of EXPRESSCLUSTER X SingleServerSafe.
Output Cluster WebUI Operation Log
Allows you to output the operation log of Cluster WebUI.
If the check box is checked:
The operation log of Cluster WebUI is outputted.
If the check box is not checked:
The operation log of Cluster WebUI is not outputted.
Log output path (Within 255 bytes)
Specify the output destination directory of the Cluster WebUI operation log with an absolute path consisting of ASCII characters.
If no directory is specified, the Cluster WebUI operation log is outputted to <installation path>/log.
File Size (1 to 10)
Specify the size of Cluster WebUI operation log.
When the log data reaches the specified size, a rotation occurs. Up to five generations of the data are saved.
IP address for Integrated Cluster WebUI
Click Settings to display the IP address for the Integrated Cluster WebUI dialog box.
Add
Add IP addresses for the Integrated Cluster WebUI. Click the column cell of each server and select or enter IP address for the IP address of each server. For the communication path not connected to some server, set blank to the server cell of which the server is not connected.
Remove
Remove the communication path. Select the communication path to be removed and click Remove, then the selected path is removed.
Priority
When multiple IP addresses for Integrated Cluster WebUI are configured, the communication path with the smallest number in the Priority column is used preferentially for the internal communication among cluster servers. When changing the priority, click the arrows to change the order of the selected row.
Tuning
Use Tuning to tune the WebManager Server. Click Tuning displays the WebManager Tuning Properties dialog box.
Client Session Timeout (1 to 999)
Specify the client session time-out. A timeout is determined if the time specified here elapses after the last communication between the WebManager server and the Cluster WebUI.
Reload Interval (0 to 999)
At this time interval, the Cluster WebUI screen is refreshed.
Mirror Agent Timeout (1 to 999)
Not used.
Time Limit For Keeping Log Files (60 to 43,200)
Time limit determines when the log collection information temporarily saved on the server will be deleted. When the time specified here has elapsed, the log collection information will be deleted unless you save the file when the dialog box asking you if you save the log collection information is displayed.
Use Time Info
Specify whether the time information display function is enabled or disabled.
When selected:
The time information display function is enabled.
When cleared:
The time information display function is disabled.
Initialize
Used for initializing the value to the default value. Click Initialize to initialize all the items to their default values.
Control a privilege of operating clusters per group
Allows you to set and control a privilege of operating clusters per group.
If the check box is checked:
Add, Remove, and Edit are displayed.
If the check box is not checked:
Add, Remove, or Edit is not displayed.
Login users must be registered beforehand in the server which issues the request. More specifically, a group must be registered to the server and the users must belong to it as the control permission of a cluster is assigned per group.
If the server belongs to a work group:
Register the same user name and group name in each of the servers which issues the request.
If the server belongs to a domain:
Register users and groups in the domain.
Add
Allows you to add a group to Authorized Group List. Clicking Add displays the Group Name dialog box. Any group added here has the Operation box checked.
Group name (up to 255 bytes)
Enter the name of a group. Users belonging to the group are to be given the permission.
The group must be registered to a server in advance.
Remove
Use this option to delete a group from Authorized Group List.
From Authorized Group List, select a group to be deleted. Then, click Remove.
Edit
Use this option to edit a group. From Authorized Group List, select a group to be edited. Then click Edit. The Group Name dialog box appears with the selected group entered. Editing the group here does not change its operation right.
Operation
Set operation rights for any of the groups registered in Authorized Group List.
If the check box is checked:
The users of the group can operate the cluster and obtain its status.
If the check box is not checked:
The users of the group can only obtain the status of the cluster.
Control connection by using client IP address
Controls connections using client IP addresses.
When the checkbox is selected:
Add, Remove and Edit are displayed.
When the checkbox is not selected:
Add, Remove and Edit are not displayed.
Add
Use Add to add an IP address in Connection Permit Client IP Address List. Click Add to display the IP Address dialog box. Newly added IP addresses have the rights for the operation.
IP Address (Within 80 bytes)
Specify a client IP address allowed for the connection.
IP address: 10.0.0.21
Network address: 10.0.1.0/24
Remove
Use Remove to remove an IP address from Connection Permit Client IP Address List. Select the IP address to be removed from Connection Permit Client IP Address List and then click Remove.
Edit
Use Edit to edit an IP address. Select the IP address you want to edit from Connection Permit Client IP Address List and then click Edit. A dialog box where the specified IP address is preset is displayed.
Operation
Set operation rights for any of the IP addresses registered in Connection Permit Client IP Address List.
When the check box is selected:
A client can operate a cluster and display its status.
When the check box is not selected:
A client can only view the status of a cluster.
Output API Service Operation Log
Allows you to output the operation log of API Services.
If the check box is checked:
The operation log of API Services is outputted.
If the check box is not checked:
The operation log of API Services is not outputted.
Log output path (Within 255 bytes)
Specify the output destination directory of the API Service operation log with an absolute path consisting of ASCII characters.
If no directory is specified, the API Service operation log is outputted to <installation path>/log.
File Size (1 to 10)
Specify the size of API Service operation log.
When the log data reaches the specified size, a rotation occurs. Up to five generations of the data are saved.
Tuning.
Adjusts API services. Click Tuning to display API Tuning Properties dialog box.
Authentication Lockout Threshold
Specify the number that counts continuous HTTP server authentication failures. If the counts reach this threshold, lockout is performed.
HTTP Server Start Retry Count
Specify the retry number that counts API services failed to start a HTTP server.
HTTP Server Start Interval
Specify the period of time between the time HTTP server start failure occurs and the time retry starts.
Initialize
Use Initialize to restore the default value. All the items restore the default values when Initialize is clicked.
Sets files and libraries used for encryption of the cluster related services.
Certificate File
Sets the server certificate file used for connecting to a client. Users need to prepare the server certificate file.
Private Key File
Sets the private key file used for connecting to a client. Users need to prepare the private key file.
SSL Library
Sets the SSL library file used for encryption and selects the SSL library file included in OpenSSL. Users need to change it based on the environment, such as an installation folder.
Crypto Library
Sets the Crypto library file used for encryption and selects the Crypto library file included in OpenSSL. Users need to change it based on the environment, such as an installation folder.
Select this to start alert service for the server.
When selected:
Alert service is enabled.
When cleared:
Alert service is disabled.
Max. Number to Save Alert Records (1 to 99,999)
Alert service for server can retain alert messages up to this number.
Enable a log file for investigation to be downloaded
Enable or disable downloading a log file for investigation through Cluster WebUI in response to the occurrence of a failure. For more information on the log file, see "Function for obtaining a log file for investigation" in " The system maintenance information" in the "Maintenance Guide".
When the check box is selected:
The log file is downloadable through Cluster WebUI.
When the check box is not selected:
The log file is not downloadable through Cluster WebUI.
Alert Sync: Method
Not used.
Alert Sync: Communication Timeout (1 to 300)
Not used.
Initialize
Used for initializing the value to the default value. Click Initialize to initialize all the items to their default values.
Set a percentage of heartbeat timeout at which the heartbeat delay warning is issued. If the time for the percentage passes without any heartbeat response, the warning will be produced in an alert log. If you set 100, the warning will not be issued.
Monitor Delay Warning (0 to 100)
Set a percentage of monitor timeout at which the monitor delay warning is issued. If the time for the percentage passes without any monitor response, the warning will be produced in an alert log. If you set 100, the warning will not be issued.
Note
If you specify 0% for the delay warning, an alert log is shown in every heartbeat interval and monitor interval.
Setting 0% allows you to see the time spent for monitoring. This will be helpful particularly in a test operation.
Make sure not to set low values such as 0% in the production environment.
8.1.16. Mirror Agent tab ~ For the Replicator/Replicator DR~
Not used.
8.1.17. Mirror driver tab ~ For Replicator/Replicator DR ~
Configure detailed parameters for the JVM monitor.
Note
To display the JVM monitor tab on the config mode of Cluster WebUI, you need to execute Update Server Info after the license for Java Resource Agent is registered.
Java Installation Path (up to 255 bytes)
Set the Java VM install path used by the JVM monitor. Specify an absolute path using ASCII characters. Do not add "/" to the end of the path. Specification example: /usr/java/jdk-9
Maximum Java Heap Size (7 to 4096)
Set, in megabytes, the maximum Java VM heap size used by the JVM monitor (equivalent to -Xmx of the Java VM startup option).
Java VM Additional Option (up to 1024 bytes)
Set the Java VM startup option used by the JVM monitor. However, specify -Xmx in the [Maximum Java Heap Size]. Specification example: -XX:+UseSerialGC
Log Output Setting
Click the Settings button to open the Log Output Setting dialog box.
Resource Measurement Setting
Click the Settings button to open the Resource Measurement Setting dialog box.
Connection Setting
Click the Settings button to open the Connection Setting dialog box.
Action Timeout (30 to 300)
Set the timeout value of [Command] specified in each window of the JVM monitor. This setting becomes common for all the [Command] items.
Log Output Setting
Clicking Settings displays the Log Output Setting dialog box.
Log Level
Select the log level of the log output by the JVM monitor.
Generation (2 to 100)
Set the number of generations to be retained for log output by the JVM monitor.
When Period is selected for Rotation Type, the rotation count is reset when cluster is suspended. Therefore, note that log files under the <EXPRESSCLUSTER_install_path>log/ha/jra increase per cluster suspend.
Rotation Type
Select a rotation type for the log output by the JVM monitor. If you select File Capacity as the rotation type, set the maximum size (200 to 2097151), in kilobytes, for each log file such as the JVM operation log. If you select Period as the rotation type, set the log rotation start time in "hh:mm" format (hh: 0 to 23, mm: 0 to 59) and the rotation interval (1 to 8784) in hours.
Initialize
Clicking Initialize returns the log level, generation, and rotation type items to their default values.
Resource Measurement Setting [Common]
Clicking Settings displays the Resource Measurement Setting dialog box. For details on the scheme for error judgment by the JVM monitor, see "6.Monitor resource details".
Retry Count (1 to 1440)
Set a resource measurement retry count to be applied if the JVM monitor fails in resource measurement.
Error Threshold (1 to 10)
Set the number of times abnormal judgment is performed when the usage of the Java VM or the application server resources collected by the JVM monitor via resource measurement continuously exceed the customer-defined threshold.
Memory Usage, Active Threads (15 to 600)
Set the interval at which the JVM monitor measures the memory usage and active thread count.
The time and count in Full GC (15 to 600)
Set the interval at which the JVM monitor measures the time and count in Full GC execution.
Initialize
Clicking Initialize returns the retry count, error threshold, and interval items to their default values.
Resource Measurement Setting [WebLogic]
Clicking Settings displays the Resource Measurement Setting dialog box. For details on the scheme for error judgment by the JVM monitor, see "6.Monitor resource details".
Retry Count (1 to 5)
Set the resource measurement retry count to be applied if the JVM monitor fails in resource measurement.
Error Threshold (1 to 10)
Set the number of times abnormal judgment is to be performed when the usage of the Java VM or the application server resources collected by the JVM monitor via resource measurement continuously exceed the customer-defined threshold.
The number of request (15 to 600)
Set the interval at which the JVM monitor measures the number of work manager or thread pool requests during WebLogic monitor.
The average number of the request (15 to 600)
Set the interval at which the JVM monitor measures the average number of work manager or thread pool requests during WebLogic monitor. Set a value that is an integer multiple of the value set in The number of request.
Initialize
Clicking Initialize returns the retry count, error threshold, and interval items to their default values.
Connection Setting
Clicking Settings displays the Connection Setting dialog box.
Management Port (1 to 65535)
Sets the port number internally used by the JVM monitor resource. Make sure not to set the port number that has been used by other functions or programs. Set the number of the port connected to the monitor target Java VM. Do not set 32768 to 61000.
Retry Count (1 to 5)
Set the retry count to be applied if connection to the monitor target Java VM fails.
Waiting time for reconnection (15 to 60)
Set the interval at which the JVM monitor retries connection if it fails in Java VM connection.
Initialize
Clicking Initialize sets the management port, retry count, and wait time for reconnection items to their default values.
Go to Cluster Properties -> the Alert Service tab -> Change Alert Destination -> Destination, and then select Message Topic.
If the check box is not checked:
The Amazon SNS linkage function is disabled.
TopicArn
Set TopicArn for the Amazon SNS linkage function.
Enable Amazon CloudWatch linkage function
Enable or disable the Amazon CloudWatch linkage function.
If the check box is checked:
The Amazon CloudWatch linkage function is enabled.
Amazon CloudWatch is informed of the monitoring process time taken by the monitor resource.
If the check box is not checked:
The Amazon CloudWatch linkage function is disabled.
Note
Using the Amazon CloudWatch linkage function requires turning on Enable Amazon CloudWatch linkage function, and enabling Send polling time metrics of the Monitor (common) tab for the target monitor resource.
Namespace
Set Namespace for the Amazon CloudWatch linkage function.
Interval for Sending Metrics
Set the frequency of informing Amazon CloudWatch of the monitoring process time taken by the monitor resource.
AWS CLI command line options
Clicking Settings displays a text box for each AWS service.
For each AWS service, set AWS CLI command line options to be applied.
Environment variables at the time of performing AWS-related features
Clicking Settings displays a dialog box listing environment variables.
Environment variable List
Clicking Edit displays a dialog box to edit the selected environment variable.
Clicking Add displays a dialog box to add a new environment variable.
Clicking Remove* deletes the selected environment variable.
Enter environment variable
Enter the name and value of an environment variable.
You can collect and see data on the cluster operation such as the required time of a group failover and that of resource activation.
For details, see "Cluster statistics information collection function" in "The system maintenance information" in the "EXPRESSCLUSTER X Maintenance Guide".
When the check box is selected:
The cluster statistical information is collected.
File Size (whose setting range depends on the type)
Specify the size of the cluster statistical information file.
When the collected information reaches the specified size, rotation occurs to save up to two generations of the data.
When the check box is not selected:
The cluster statistical information is not collected.
Note
In Cluster Statistics, File Size can be specified as follows:
Heartbeat resource: 1 to 50 (MB)
Group: 1 to 5 (MB)
Group resource: 1 to 5 (MB)
Monitor resource: 1 to 10 (MB)
Mirror Statistics
Not used.
System Resource Statistics
Select whether to Collect the System Resource Information.
System resource information is collected regularly so as to improve system operability.
For details, see "System resource statistics information collection function" and "Process resource statistics information collection function" in "The system maintenance information" in the "EXPRESSCLUSTER X Maintenance Guide".
When the check box is selected:
System resource information related to the CPU, memory, processes, and others is collected regularly while the server is running.
The collected system resource information is collected when the clplogcc command or Cluster WebUI collects logs. When collecting logs, specify Pattern 2 or type2. A disk area of 450 MB or more is required to store the resource information, depending on the system operating conditions such as the number of processes that are running.
When the check box is not selected:
No system resource information is collected.
Initialize
Used for initializing the value to the default value. Click Initialize to initialize all the items to their default values.
In case that the final action of the group resource and the monitor resource when an error is detected is configured so that the OS reboot accompanies, reboot may be repeated infinitely. By setting the reboot limit, you can prevent repeated reboots.
Max Reboot Count (0 to 99)
Specify how many times the operating system can reboot. The number specified here is separately counted for group resource and monitor resource.
With Max Reboot Count set to zero, the reboot can be unlimitedly repeated.
Max Reboot Count Reset Time (0 to 999)
When the max reboot count is specified, if the operation from the cluster startup keeps running normally for the time specified here, the reboot count is reset. The time specified here is separately counted for group resource and monitor resource.
Note
If Max Reboot Count Reset Time is set to 0, the reboot count is not reset. When you reset the reboot count, use the clpregctrl command.
Start Automatically After System Down
Set whether to prohibit automatic startup of the cluster service at the next OS startup when the server has been stopped by a means other than cluster shutdown or cluster stop, or when cluster shutdown or stop does not terminate normally.
Exclude Mount/Unmount Commands
Not used.
Grace period of server group failover policy (0 to 99999)
Not used.
Change from OS Stop to OS Restart
Determine whether the OS stop action is collectively changed to OS restart action.
If the check box is checked:
The action change is made.
If the check box is not checked:
The action change is not made.
The changed action changes the following actions.
No actions other than those below are changed.
Action with an abnormal cluster service process
With Shut down the OS selected:
Changes to Reboot the OS.
With BMC Power Off selected:
Changes to BMC Power Cycle.
Action in case of an activation/deactivation stall of a group resource
With Stop cluster service and shutdown OS selected:
Changes to Stop cluster service and reboot OS.
With Emergency shutdown selected:
Changes to Reboot the OS after the emergency shutdown.
With BMC Power Off selected:
Changes to BMC Power Cycle.
Final action with the abnormal activation/deactivation of a group resource
With Stop cluster service and shutdown OS selected:
Changes to Stop cluster service and reboot OS.
With BMC Power Off selected:
Changes to BMC Power Cycle.
Final action with an abnormal monitor resource
With Stop cluster service and shutdown OS selected:
Changes to Stop cluster service and reboot OS.
With BMC Power Off selected:
Changes to BMC Power Cycle.
Note
The action change does not affect the following monitor resources:
External link monitor resources
User mode monitor resources
Disable Cluster Operation
Group Automatic Startup
If the check box is checked:
That disables automatic group startup.
If the check box is not checked:
That does not disable automatic group startup.
Recovery Operation when Group Resource Activation Failure Detected
If the check box is checked:
That disables recovery on detecting the activation failure of a group resource.
If the check box is not checked:
That does not disable recovery on detecting the activation failure of a group resource.
Recovery Operation when Group Resource Deactivation Failure Detected
If the check box is checked:
That disables recovery on detecting the deactivation failure of a group resource.
If the check box is not checked:
That does not disable recovery on detecting the deactivation failure of a group resource.
Recovery Action when Monitor Resource Failure Detected
If the check box is checked:
That disables recovery on detecting the failure of a monitor resource.
If the check box is not checked:
That does not disable recovery on detecting the failure of a monitor resource.
Failover when server failure detected
Not used.
Note
Recovery on detecting the failure of a monitor resource cannot be disabled for user mode monitor resources.
Disabling recovery on detecting the failure of a monitor resource does not affect external link monitor resources .
Settings of log storage period
Use log storage period feature
Renames (not deletes) an old log file (whose name ends with .pre) in the following folders to <date and time when the file was last updated>_<type name>.log, when the file is rotated:
<installation path>/log
<installation path>/perf
The log file renamed as above is compressed at a specified time, then saved as <date when the file was compressed_server name>.tar.gz to a given log storage destination.
Store log (1 to 9999)
Specify a log storage period (up to 9999 days). When this period elapses, the corresponding log files are automatically removed.
Log storage destination (within 170 characters)
Specify an absolute path to the storage folder, in ASCII characters.
The specified folder needs to be created in advance outside the installation path.
Make sure that free space and write performance are sufficiently available.
Log storage timing
Specify a time at which the storage occurs every day, in the pop-up window opened by clicking the timepiece icon.
Initialize
Used for initializing the value to the default value. Click Initialize to initialize all the items to their default values.
This chapter provides details about how several different types of errors are detected, in order to help you find out how to best set up the monitor interval, monitor timeout, and monitor retry count.
When Always monitor is selected, monitoring begins when the server is up and running and EXPRESSCLUSTER X SingleServerSafe is ready to run.
When Monitors while activated is selected, monitoring is performed from when a specified group is activated (until that group is deactivated (stopped)).
Some monitor resources have a fixed monitor timing, while others allow you to choose between two monitor timing options.
Server startup: Server startup
Group activation: Group activation
Group deactivation: Group deactivation
Server stops: Server stop
Fig. 9.1 Always monitor and Monitors while activated for a monitor resource
All monitor resources monitor their targets at every monitoring interval.
Following are different timelines illustrating how a monitor resource performs monitoring with or without an error based on the specified monitor interval.
When no error is detected
The following figure describes the operation when monitoring is started or restarted upon the activation of a server.
When the main monitoring process receives a monitoring result, the monitoring is repeatedly started at the monitoring intervals.
Examples of behavior when the following values are set.
When an error is detected (without monitor retry setting)
The figure below describes the flow where the occurrence of an error in the monitor target is detected.
When the main monitoring process receives a monitoring result (an error), the failover of the recovery target group is executed.
After an error occurs, it is detected next time monitoring is performed, and then the recovery target is reactivated.
Examples of behavior when the following values are set.
When an error is detected (with monitor retry settings)
The figure below describes the flow where the occurrence of an error in the monitor target is detected.
When the main monitoring process receives a monitoring result (an error), the failover of the recovery target group is executed until the set monitoring retry count is reached. If the monitoring target still does not recover, perform the failover of the recovery target group.
After an error occurs, it is detected next time monitoring is performed, and then, if recovery cannot be achieved before the monitor retry count is reached, the recovery target is reactivated.
Examples of behavior when the following values are set.
When an error is detected (without monitor retry settings)
In the figure below, the monitoring process has not been ended within the specified duration of time.
After the main monitoring process has started the monitoring, if the monitoring result could not be obtained within the specified monitoring timeout, the failover of the recovery target group is executed.
After a monitor timeout occurs, the recovery target is immediately reactivated for the recovery action.
Examples of behavior when the following values are set.
<Monitor>
Monitor Interval 30 sec
Monitor Timeout 60 sec
Monitor Retry Count 0 times
<Error Detection>
Recovery Action Restart the recovery target
Recovery Target Group
Recovery Script Execution Count 0 time
Reactivation Threshold: One time
Final Action No Operation
Fig. 9.5 Monitoring interval (a monitoring timeout detected, without monitor retry settings)
When a monitoring timeout is detected (with monitor retry setting)
In the figure below, the monitoring process has not been ended within the specified duration of time.
After the main monitoring process has started the monitoring, if the monitoring result could not be obtained within the specified monitoring timeout, the monitoring is executed until the set monitoring retry count is reached. If the monitoring result could not be obtained, perform the failover of the recovery target group.
After a monitor timeout occurs, another monitor attempt is made and, if it fails, the recovery target is reactivated.
Examples of behavior when the following values are set.
<Monitor>
Monitor Interval 30 sec
Monitor Timeout 60 sec
Monitor Retry Count 1 time
<Error Detection>
Recovery Action Restart the recovery target
Recovery Target Group
Recovery Script Execution Count 0 time
Reactivation Threshold: One time
Final Action No Operation
Fig. 9.6 Monitoring interval (a monitoring timeout detected, with monitor retry settings)
9.3. Action when an error is detected by a monitor resource
When an error is detected, the following recovery actions are taken against the recovery target in sequence:
Execution of recovery script: this takes place when an error is detected in a monitor target.
Reactivation of the recovery target: this takes place if the recovery script is executed up to the recovery script execution count. When the execution of a pre-reactivation script is specified, reactivation starts after that script has been executed.
When an error is detected in the monitor target, the recovery target is reactivated. (This is not the case if Execute Only Final Action is selected for Recovery Action or if Maximum Reactivation Count is set to 0 in Custom).
If reactivation fails or the error is detected again after reactivation, the final action is performed. (If Maximum Reactivation Count is set to 2 or greater in Custom, reactivation is retried the specified number of times.).
No recovery action is taken if the status of the recovery target is:
Yes: Recovery action is taken No: Recovery action is not taken
Note
Do not perform the following operations by using the Cluster WebUI or command line while recovery processing is changing (reactivation -> final action), if a group resource (such as an EXEC resource) is specified as a recovery target and when a monitor resource detects an error.
Stopping/suspending the server
Starting/stopping a group
If you perform the above-mentioned operations while recovery caused by detection of an error by a monitor resource is in progress, other group resources of the group with an error may not stop.
However, you can perform them when the final action is completed.
When the status of the monitor resource recovers from the error (becomes normal), the settings for the reactivation count and whether to execute the final action are reset. Note that, when a group or group resource is specified as the recovery target, these counters are reset only when the status of all the monitor resources for which the same recovery target is specified become normal.
An unsuccessful recovery action is also counted as part of the reactivation count.
When return of the monitor resource is detected during or after recovery actions following the detection of a monitoring error, counts for the thresholds shown below are reset:
Recovery Script Execution Count
Reactivation Count
Whether or not to execute the final action is reset (execution required).
9.5. Activation or deactivation error for the recovery target during recovery
When the monitoring target of the monitor resource is the device used for the group resource of the recovery target, an activation/deactivation error of the group resource may be detected during recovery when a monitoring error is detected.
Upon the detection of a monitor resource error, a recovery script can be configured to run. Alternatively, before the reactivation, failover, or final action of a recovery target, a pre-recovery action script can be configured to run.
The script is a common file.
Environment variables used in the recovery/pre-recovery action script
EXPRESSCLUSTER sets status information (the recovery action type) in the environment variables upon the execution of the script.
The script allows you to specify the following environment variables as branch conditions according to the operation of the system.
Environment variable
Value of the
environment variable
Description
CLP_MONITORNAME
(Monitor resource name)
Monitor resource name
Name of the monitor resource in which an error that causes the recovery/pre-recovery action script to run is detected.
CLP_VERSION_FULL
(EXPRESSCLUSTER X SingleServerSafe full version number)
EXPRESSCLUSTER X SingleServerSafe full version number
EXPRESSCLUSTER X SingleServerSafe full version number.
(Example) 5.3.1-1
CLP_VERSION_MAJOR
(EXPRESSCLUSTER X SingleServerSafe major version)
EXPRESSCLUSTER X SingleServerSafe major version
EXPRESSCLUSTER X SingleServerSafe major version.
(Example) 5
CLP_PATH
(EXPRESSCLUSTER X SingleServerSafe installation path)
EXPRESSCLUSTER X SingleServerSafe installation path
Path of EXPRESSCLUSTER X SingleServerSafe installation.
(Example) /opt/nec/clusterpro
CLP_OSNAME
(Server OS name)
Server OS name
Name of the server OS on which the script is executed.
(Example)
(1) When the OS name could be acquired:
Red Hat Enterprise Linux Server release 6.8 (Santiago)
(2) When the OS name could not be acquired:
Linux
CLP_OSVER
(Server OS version)
Server OS version
Version of the server OS on which the script is executed.
(Example)
(1) When the OS version could be acquired:6.8
(2) When the OS version could not be acquired: *None
CLP_ACTION
(Recovery action type)
RECOVERY
Execution as a recovery script.
RESTART
Execution before reactivation.
FAILOVER
Execution before failover.
Not used.
FINALACTION
Execution before final action.
CLP_RECOVERYCOUNT
(Recovery script execution count)
Recovery Script Execution Count
Count for recovery script execution.
CLP_RESTARTCOUNT
(Reactivation count)
Reactivation count
Count for reactivation.
Writing recovery/pre-recovery action scripts
This section explains the environment variables mentioned above, using a practical scripting example.
Example of a recovery/pre-recovery action script
#!/bin/sh# ***************************************# * preactaction.sh# ***************************************# Allot a process by referencing environment variables for script starting factors.if["$CLP_ACTION"="RECOVERY"]then# Write the recovery process here.# This process is executed at the following timing:## Recovery action: Recovery scriptelif["$CLP_ACTION"="RESTART"]then# Write the pre-reactivation process here.# This process is executed at the following timing:## Recovery action: Reactivationelif["$CLP_ACTION"="FINALACTION"]then# Write the recovery process here.# This process is executed at the following timing:## Recovery action: Final actionfiexit0
Tips for recovery/pre-recovery action script coding
Pay careful attention to the following points when coding the script.
When the script contains a command that requires a long time to run, log the end of execution of that command. The logged information can be used to identify the nature of the error if a problem occurs. clplogcmd is used to log the information.
How to use clplogcmd in the script
With clplogcmd, messages can be output to Cluster WebUI Alert logs or OS syslog. For clplogcmd, see "Outputting messages (clplogcmd command)" in "EXPRESSCLUSTER X SingleServerSafe command reference" in Operation guide.
Stack size for commands and applications activated from the script
The recovery/pre-recovery action script runs with the stack size configured to 2 MB. If the script has a command or application that requires a stack size of 2 MB or more to run, a stack overflow occurs.
If a stack overflow error occurs, adjust the stack size before the command or application is activated.
When a server is heavily loaded, due to a reason such as applications running concurrently, a monitor resource may detect a monitoring timeout. It is possible to have settings to issue an alert at the time when the time for monitor processing (the actual elapsed time) reaches a certain percentages of the monitoring time before a timeout is detected.
The following figure shows timeline until a delay warning of the monitor resource is used.
In this example, the monitoring timeout is set to 60 seconds and the delay warning rate is set to 80%, which is the default value.
Fig. 9.7 Monitoring polling time and delay warning
The polling time of monitoring is 10 seconds. The target of the monitor resource is in normal status. In this case, no alert is used.
The polling time of monitoring is 50 seconds and the delay of monitoring is detected during this time. The target of the monitor resource is in the normal status. In this case, an alert is used because the delay warning rate has exceeded 80%.
The polling time of monitoring has exceeded 60 seconds of the monitoring timeout and the delay of monitoring is detected. The target of the monitor resource has a problem. In this case, no alert is used.
If the delay warning rate is set to 0 or 100:
When 0 is set to the delay monitoring rate
An alert for the delay warning is used at every monitoring.
By using this feature, the time for monitor processing for the monitor resource can be calculated at the time the server is heavily loaded, which will allow you to determine the time for monitoring timeout of a monitor resource.
When 100 is set to the delay monitoring rate
The delay warning will not be is used.
Note
Be sure not to set a low value, such as 0%, except for a test operation.
See also
To configure the delay warning of monitor resources, click Cluster Properties and select Monitor Delay Warning in the Delay Warning tab.
9.8. Waiting for a monitor resource to start monitoring
"Wait Time to Start Monitoring" refers to start monitoring after the time period specified as the waiting time elapses.
The following describes how monitoring differs when the wait time to start monitoring is set to 0 second and 30 seconds.
If the wait time to start monitoring is set to 0 second, start the monitor resource polling after the server activation or monitoring restart.
Configuration of monitor resource
<Monitor>
Interval 30 sec
Timeout 60 sec
Retry Count 0 times
Wait Time to Start Monitoring 0 sec
Fig. 9.8 Waiting for a monitor resource to start monitoring (the wait time to start monitoring set to 0 second)
If the wait time to start monitoring is set to 30 seconds, start the monitor resource polling 30 seconds after the server activation or monitoring restart.
<Monitor>
Interval 30 sec
Timeout 60 sec
Retry Count 0 times
Wait Time to Start Monitoring 30 sec
Fig. 9.9 Waiting for a monitor resource to start monitoring (the wait time to start monitoring set to 30 second)
Note
Monitoring will restart after the time specified to wait for start monitoring has elapsed even when the monitor resource is suspended and/or resumed by using the monitoring control commands.
The wait time to start monitoring is used when there is a possibility for monitoring to be terminated right after the start of monitoring due to incorrect application settings, such as an EXEC resource monitored by the PID monitor resource, and when they cannot be recovered by reactivation.
For example, when the monitor wait time is set to 0 (zero), recovery may be endlessly repeated. See the example below:
In this case, the application is started.
And then, the monitoring by the PID monitor is started and the polling by the PID monitor is terminated normally.
Afterwards, however, the application is terminated abnormally due to some reason.
Configuration of PID monitor resource
<Monitor>
Interval 5 sec
Timeout 60 sec
Retry Count 0 times
Wait Time to Start Monitoring 0 sec
<Error Detection>
Recovery Action Restart the recovery target
Recovery Target exec
Reactivation Threshold: One time
Final Action Stop Group
Fig. 9.10 Waiting for a monitor resource to start monitoring (the wait time to start monitoring set to 0 second)
The reason why recovery action is endlessly repeated is because the initial monitor resource processing has terminated successfully. The current count of recoveries the monitor resource has executed is reset when the status of the monitor resource becomes normal (finds no error in the monitor target). Because of this, the current count is always reset to 0 and reactivation for recovery is endlessly repeated.
You can prevent this problem by setting the wait time to start monitoring.
By default, 60 seconds is set as the wait time from the application startup to the end.
In this case, the application is started.
Then, after waiting for the set wait time for start monitoring, the PID monitor start monitoring.
After that, the application is terminated abnormally for some reason, which will be detected by the polling by the PID monitor.
Configuration of PID monitor resource
<Monitor>
Interval 5 sec
Timeout 60 sec
Retry Count 0 times
Wait Time to Start Monitoring: 60 sec
<Error Detection>
Recovery Action Restart the recovery target
Recovery Target exec
Reactivation Threshold: One time
Final Action Stop Group
Fig. 9.11 Waiting for a monitor resource to start monitoring (the wait time to start monitoring set to 60 second)
9.9. Limiting the reboot count for error detection
In case that the final action when an error is detected at activation or deactivation, or the final action of the monitor resource when an error is detected is configured so that the OS reboot accompanies, the number of shutdowns or reboots can be limited.
Note
The maximum reboot count is on a server basis because the number of reboots is recorded on a server basis.
The number of reboots caused by a final action in detection of error in group activation/deactivation and the number of reboots caused by a final action in detection of error by a monitor resource are recorded separately.
If the time to reset the maximum reboot count is set to zero (0), the number of reboots will not be reset. When you reset the reboot count, use the clpregctrl command.
Up to 25 Java VMs can be monitored concurrently. The Java VMs that can be monitored concurrently are those which are uniquely identified by the Cluster WebUI (with Identifier in the Monitor (special) tab).
Connections between Java VMs and JVM monitor resources do not support SSL.
It may not be possible to detect thread deadlocks. This is a known problem in Java VM. For details, refer to "Bug ID: 6380127" in the Oracle Bug Database.
The JVM monitor resources can monitor only the Java VMs on the server on which the JVM monitor resources are running.
The JVM monitor resources can monitor only one JBoss server instance per server.
Application monitoring is disabled when an application to be monitored on the IA32 version is running on an x86_64 version OS.
If a large value such as 3,000 or more is specified as the maximum Java heap size by the Cluster WebUI (by using Maximum Java Heap Size on the JVM monitor tab in Cluster Properties), The JVM monitor resources will fail to start up. The maximum heap size differs depending on the environment, so be sure to specify a value based on the capacity of the mounted system memory.
If "-XX:+UseG1GC" is added as a startup option of the target Java VM, the settings on the Memory tab on the Monitor(special) tab in Property of JVM monitor resources cannot be monitored before Java 7.
It's possible to watch by choosing [Oracle Java (usage monitoring)] in [JVM Type] on the Monitor(special) tab after Java 8.
10.2. Notes when creating EXPRESSCLUSTER X SingleServerSafe configuration data
This section describes the items to note before designing and creating configuration data based on the system configuration.
10.2.1. Directories and files in the location pointed to by the EXPRESSCLUSTER X SingleServerSafe installation path
The directories and files in the location pointed to by the EXPRESSCLUSTER installation path must not be handled (edited, created, added, or deleted) by using any application or tool other than EXPRESSCLUSTER X SingleServerSafe.
Any effect on the operation of a directory or file caused by using an application or tool other than EXPRESSCLUSTER X SingleServerSafe will be outside the scope of NEC technical support.
The following scripts cannot be executed under the environment where more than 255 environmental variables are set. When using the following function of resource, set the number of environmental variables less than 256.
Start/Stop script executed by EXEC resource when activating/deactivating
Script executed by Custom monitor Resource when monitoring
Script before final action after the group resource or the monitor resource error is detected.
10.2.3. Server reset, server panic, and power off
When EXPRESSCLUSTER performs "Server reset," "Server panic," or "Server power off," the servers are not shut down normally. Therefore, the following may occur.
Damage to a mounted file system
Loss of unsaved data
"Server reset" or "Server panic" occurs under the following settings:
Action upon an error when activating or deactivating a group resource
sysrq Panic
keepalive Reset
keepalive Panic
BMC Reset
BMC Power Off
BMC Cycle
BMC NMI
Final action when a monitor resource detects an error
sysrq Panic
keepalive Reset
keepalive Panic
BMC Reset
BMC Power Off
BMC Cycle
BMC NMI
Action when a user mode monitoring timeout is detected
softdog monitoring method
ipmi monitoring method
keepalive monitoring method
Note
A server panic can be specified when the monitoring method is keepalive.
Shutdown monitoring
softdog monitoring method
ipmi monitoring method
keepalive monitoring method
Note
Server panic can be set when the monitoring method is keepalive.
10.2.4. Final action for group resource deactivation error
If select No Operation as the final action when a deactivation error is detected, the group does not stop but remains in the deactivation error status.
Make sure not to set No Operation in the production environment.
If the delay warning rate is set to 0 or 100, the following can be achieved:
When 0 is set to the delay monitoring rate
An alert for the delay warning is issued at every monitoring.
By using this feature, you can calculate the polling time for the monitor resource at the time the server is heavily loaded, which will allow you to determine the time for monitoring timeout of a monitor resource.
When 100 is set to the delay monitoring rate
The delay warning will not be issued.
Be sure not to set a low value, such as 0%, except for a test operation.
10.2.6. TUR monitoring method for disk monitor resources
This method cannot be used for a disk or disk interface (HBA) that does not support the SCSI Test Unit Ready command or SG_IO command.
Even if your hardware supports these commands, consult the driver specifications because the driver may not support them.
For an S-ATA interface disk, the OS identifies the device as an IDE interface disk (hd) or SCSI interface disk (sd) depending on the disk controller type or distribution.
When the device is identified as using the IDE interface, TUR cannot be used.
When the device is identified as using the SCSI interface, TUR (legacy) can be used. TUR (generic) cannot be used.
TUR methods burdens OS and disk load less compared to Read methods.
In some cases, Test Unit Ready may not be able to detect actual errors in I/O to media.
10.2.7. Double-byte character set that can be used in script comments
Scripts edited in Linux environment are dealt as EUC code, and scripts edited in Windows environment are dealt as Shift-JIS code. In case that other character codes are used, character corruption may occur depending on environment.
10.2.8. The character code and line feed code in a script
If you use the clpcfctrl command to apply the settings of a script created by some means other than Cluster WebUI, make sure beforehand that the character code and line feed code in the script are the same as those in the configuration data file (clp.conf). If the character code or the line feed code is different between the script and clp.conf, the script may not work properly.
The System Resource Agent detects by using thresholds and monitoring duration time as parameters.
The System Resource Agent collects the data (number of opened files, number of user processes, number of threads, used size of memory, CPU usage rate, and used size of virtual memory) on individual system resources continuously, and detects errors when data keeps exceeding a threshold for a certain time (specified as the duration time).
Error notification to external link monitor resources can be done in following way:
- using the clprexec command.
To use the clprexec command, use the relevant file stored on the EXPRESSCLUSTER CD. Use this method according to the OS and architecture of the notification-source server. The notification-source server must be able to communicate with the notification-destination server.
When the monitoring target is the WebLogic Server, the maximum values of the following JVM monitor resource settings may be limited due to the system environment (including the amount of installed memory):
The number under Monitor the requests in Work Manager
Average under Monitor the requests in Work Manager
The number of Waiting Requests under Monitor the requests in Thread Pool
Average of Waiting Requests under Monitor the requests in Thread Pool
The number of Executing Requests under Monitor the requests in Thread Pool
Average of Executing Requests under Monitor the requests in Thread Pool
When the monitoring-target is a 64-bit JRockit JVM, the following parameters cannot be monitored because the maximum amount of memory acquired from the JRockit JVM is a negative value that disables the calculation of the memory usage rate:
Total Usage under Monitor Heap Memory Rate
Nursery Space under Monitor Heap Memory Rate
Old Space under Monitor Heap Memory Rate
Total Usage under Monitor Non-Heap Memory Rate
ClassMemory under Monitor Non-Heap Memory Rate
To use the Java Resource Agent, install the Java runtime environment (JRE) described in "Operation environment for JVM Monitor" in ""EXPRESSCLUSTER X SingleServerSafe Installation Guide"" You can use either the same JRE as that used by the monitoring target (WebLogic Server or WebOTX) or a different JRE.
The monitor resource name must not include a blank.
You can specify command line options to be applied to processes with the AWS CLI, by going to Cluster properties -> the Cloud tab and setting AWS CLI command line options.
This is effective when, for example, you specify the URL of an endpoint to which a request is sent with the AWS CLI running.
To specify two or more of the command line options, separate each of them with a space.
The command line options can be specified for each AWS service.
The following lists the features for which the settings of AWS CLI command line options are effective:
aws cloudwatch
Amazon CloudWatch linkage
aws ec2
Obtaining cloud environment information with Cluster WebUI
aws sns
Amazon SNS linkage
For more information on the command line options for the AWS CLI, see AWS documents.
Note
Using any of the following characters disables the command line options specified for the AWS CLI: ;, &&, ||, or `.
Using the --output option disables the command line options specified for the AWS CLI.
10.2.13. Environment variables for running AWS-related features
AWS-related features access instance metadata as well as the AWS CLI.
You can specify environment variables to be applied to processes for running AWS-related features, by going to Cluster properties -> the Cloud tab and setting Environment variables at the time of performing AWS-related features.
This is effective when you, for example, use a proxy server in an AWS environment or specify for the AWS CLI a configuration file and an authentication data file.
The following lists the features for which the settings of Environment variables at the time of performing AWS-related features are effective:
Amazon SNS linkage
Amazon CloudWatch linkage
Obtaining cloud environment information with Cluster WebUI
The environment variables can also be specified by using the environment variable configuration file.
In this case, do not set Environment variables at the time of performing AWS-related features. With Environment variables at the time of performing AWS-related features set, the environment variable configuration file cannot be used.
Note
The environment variable configuration file is for ensuring compatibility with old versions.
Using Environment variables at the time of performing AWS-related features is recommended for configuring the environment variables.
The environment variable configuration file is stored in the following location.
The specifications of the environment variable configuration file are as follows:
Write [ENVIRONMENT] on the first line, otherwise the environment variables may not be set.
If the environment variable configuration file does not exist or you do not have read permission for the file, the variables are ignored. This does not cause an activation failure or a monitor error.
If the same environment variables already exist in the file, the values are overwritten.
If an environment variable name follows a space or tab, or if = is placed between two tabs, then the setting may not be applied.
Environment variable names are case sensitive.
Even if a value contains spaces, you do not have to enclose the value in "" (double quotation marks).
The environment variables are not applied to scripts which are common to group and monitor resources (e.g., scripts before final action, ones before and after activation/deactivation).
10.2.14. Configuration file and authentication data file, for running AWS-related features
The AWS CLI run from AWS-related features uses the configuration file and authentication data file stored in the following folder:
/root/.aws
To use a configuration file and an authentication data file, in a folder other than the above, you must specify the environment variables.
When the dependency between resources has been changed, the change is applied by suspending and resuming the cluster.
If a change in the dependency between resources that requires the resources to be stopped during application is made, the startup status of the resources after the resume may not reflect the changed dependency.
Dependency control will be performed at the next group startup.
10.3.2. Setting cluster statistics information of external link monitor resources
Once the settings of cluster statistics information of monitor resource has been changed, the settings of cluster statistics information are not applied to external link monitor resources even if you execute the suspend and resume. Reboot the OS to apply the settings to the external link monitor resources.
 In the figures of this guide, this icon represents EXPRESSCLUSTER X SingleServerSafe.
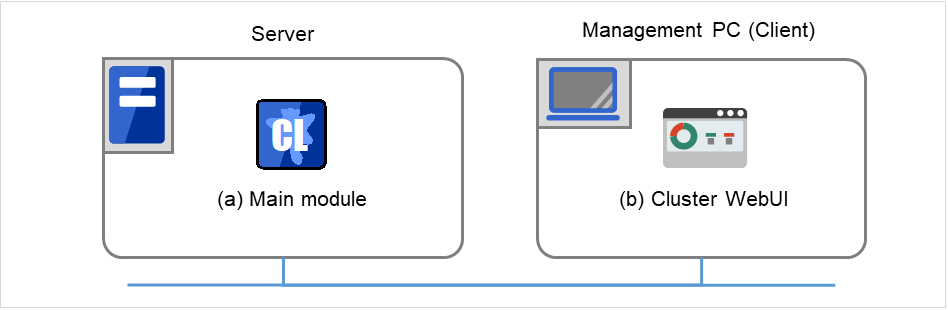
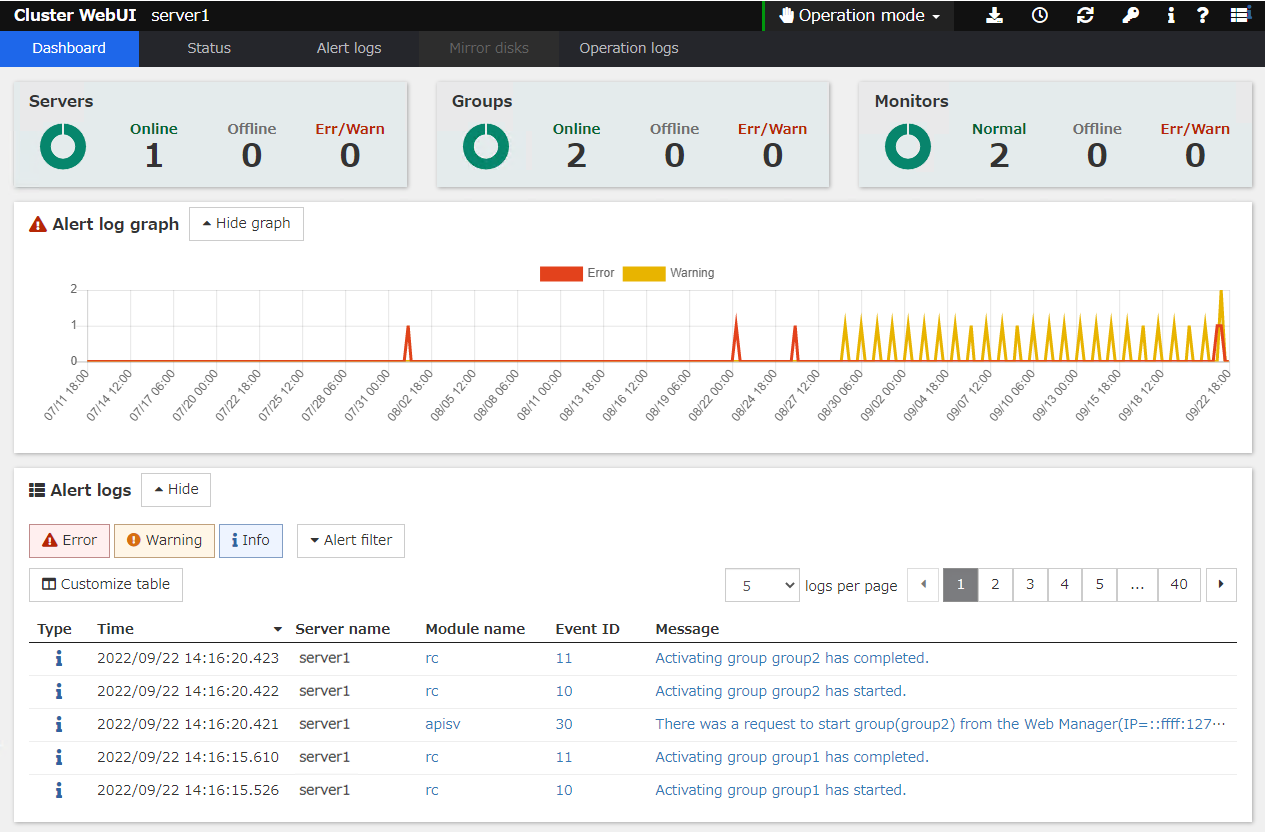
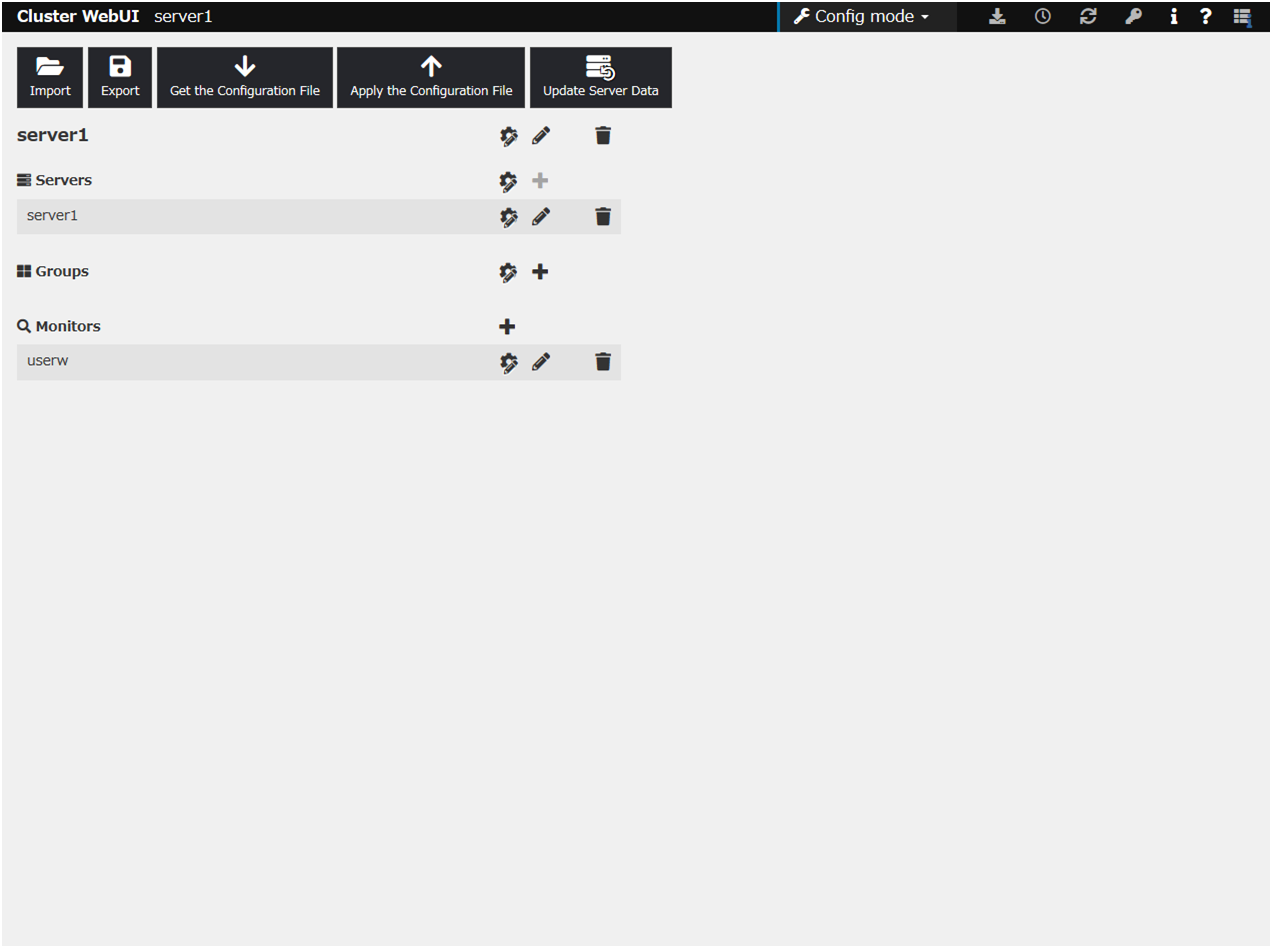
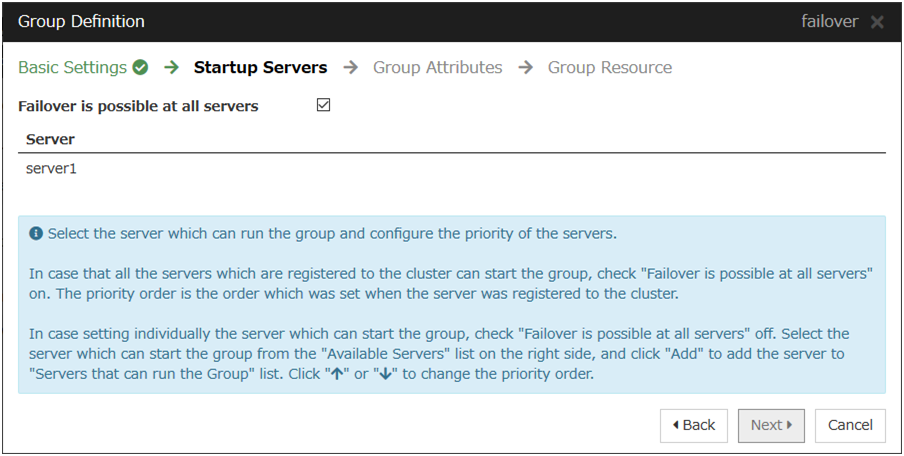
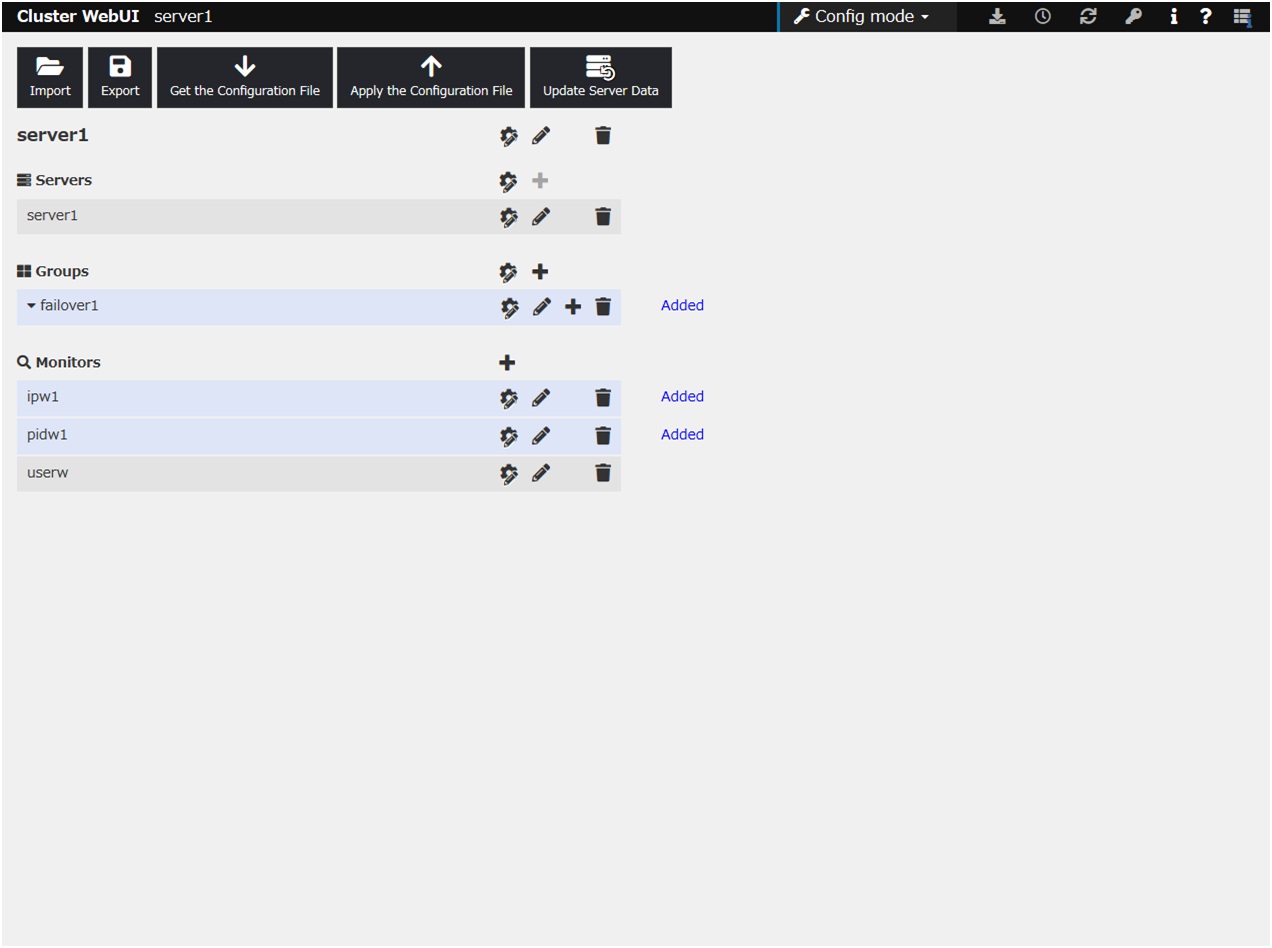
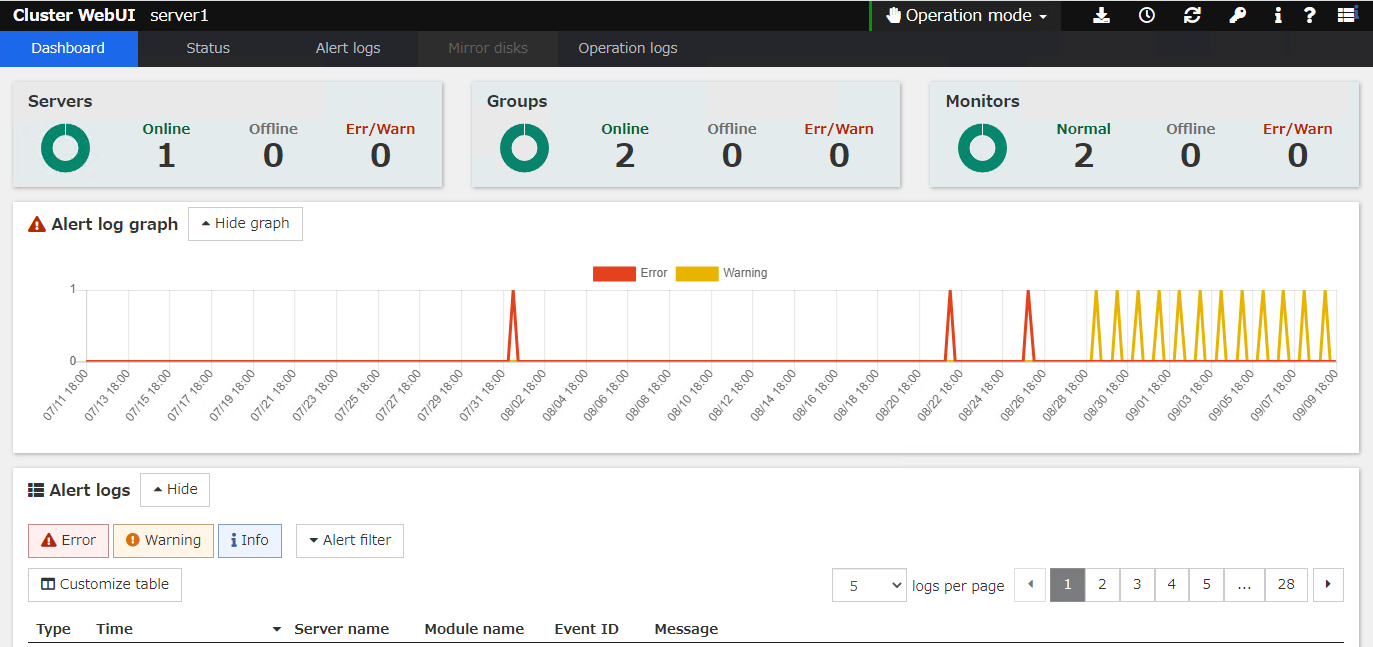 For how to operate and check the Cluster WebUI, see the online manual from the
 button on the upper right of the screen.