1. 前言
1.1. 读者对象及用途
《EXPRESSCLUSTER® X SingleServerSafe操作指南》的读者对象为导入系统后进行维护和操作的系统管理员,说明EXPRESSCLUSTER X SingleServerSafe的操作方法。
1.2. 本手册的构成
1.3. 本手册记述的术语
为提高与集群软件EXPRESSCLUSTER X 的操作性等方面的兼容性,本手册中介绍的EXPRESSCLUSTERX SingleServerSafe使用了相同的画面及命令。因此,采用了部分集群相关的术语。
请参照下列术语的说明来阅读本手册。
- 集群,集群系统
导入了EXPRESSCLUSTER X SingleServerSafe的单一服务器的系统
- 集群停止/重启
导入了EXPRESSCLUSTER X SingleServerSafe的系统的关闭/重启
- 集群资源
EXPRESSCLUSTER X SingleServerSafe所使用的资源
- 集群对象
EXPRESSCLUSTER X SingleServerSafe所使用的各种资源的对象
- 失效切换组
汇集了EXPRESSCLUSTER X SingleServerSafe所使用的组资源(应用程序,服务等)的组
1.4. EXPRESSCLUSTER X SingleServerSafe 手册体系
EXPRESSCLUSTER X SingleServerSafe的手册分为以下4类。各指南的标题和用途如下所示。
《EXPRESSCLUSTER X SingleServerSafe 安装指南》(Install Guide)
本手册的读者对象为导入使用EXPRESSCLUSTER X SingleServerSafe的系统的系统工程师,对EXPRESSCLUSTER X SingleServerSafe的安装步骤进行说明。
《EXPRESSCLUSTER X SingleServerSafe 设置指南》(Configration Guide)
本手册的读者对象为导入使用EXPRESSCLUSTER X SingleServerSafe的集群系统的系统工程师以及导入系统后进行维护和操作的系统管理员,对EXPRESSCLUSTER X SingleServerSafe的构建工作进行说明。
《EXPRESSCLUSTER X SingleServerSafe 操作指南》(Operation Guide)
本手册的读者对象为使用EXPRESSCLUSTER X SingleServerSafe导入后的进行维护和操作的系统管理员,对EXPRESSCLUSTER X SingleServerSafe的操作方法进行说明。
《EXPRESSCLUSTER X SingleServerSafe 兼容功能指南》(Legacy Feature Guide)
本手册的读者对象为导入使用EXPRESSCLUSTER X SingleServerSafe的系统的系统工程师,对EXPRESSCLUSTER X SingleServerSafe 4.0 WebManager以及Builder进行了说明。
1.5. 本手册的标记规则
在本手册中,需要注意的事项,重要的事项以及相关信息等用如下方法标记。
注解
表示虽然比较重要,但是并不会引起数据损失或系统以及机器损伤的信息。
重要
表示为避免数据损失和系统,机器损坏所必需的信息。
参见
表示参考信息的位置。
另外,在手册中使用以下标记法。
标记 |
使用方法 |
例 |
|---|---|---|
[ ] 方括号
|
在命令名的前后,
显示在画面中的字句 (对话框,菜单等) 的前后。
|
点击[开始]。
[属性]对话框
|
命令行中的[ ] 方括号 |
表示括号内的值可以不予指定(可省)。 |
|
# |
表示Linux用户正以root身份登录的提示符。 |
|
等宽字体 |
路径名,命令行,系统输出(消息,提示符等),目录,文件名,函数,参数。 |
|
粗体
|
表示用户在命令行中实际输入的值。
|
输入以下内容。
#clpcl -s -a
|
斜体 |
用户将其替换为有效值后输入的项目
|
rpm -i expresscls -<版本号> -<发布号>.x86_64.rpm |
 在本手册的图中,为了表示EXPRESSCLUSTER X SingleServerSafe,使用该图标。
2. EXPRESSCLUSTER X SingleServerSafe 命令参考
本章中说明了在EXPRESSCLUSTER X SingleServerSafe 中可以使用的命令。
为提高与集群链接软件EXPRESSCLUSTER X的操作性等方面的兼容性,EXPRESSCLUSTER X SingleServerSafe 使用了相同的画面。
本章中介绍了以下内容。
2.1. 通过命令行操作
EXPRESSCLUSTER X SingleServerSafe中有通过命令提示符执行的多种命令。构筑集群或无法使用Cluster WebUI时很方便。命令行可以进行Cluster WebUI中可执行的上述种类的操作。
注解
进行查出监视资源时的设置时,在复原对象中指定组资源(磁盘资源,...),监视资源查出异常时进行复原运行的迁移时(重新启动 ->最终动作) 请不要执行以下命令或对Cluster WebUI中的服务及组进行控制。
服务的停止/挂起
组的启动/停止
由于监视资源异常而进行复原运行的迁移时执行上述控制,则该组的其它组资源可执行不会停止。此外,即使处于监视资源异常状态,若执行了最终动作,即可执行上述控制。
重要
安装目录下有本手册中未记载的执行形式文件和脚本文件,但请不要从EXPRESSCLUSTER X SingleServerSafe以外执行这些文件。不对执行这些文件后出现的任何问题负责。
2.2. 命令列表
构筑相关
命令
说明
请参阅
clpcfctrl将Cluster WebUI创建的配置信息发送到服务器中。为了在Cluster WebUI中使用,备份集群配置信息。clplcnsc
管理本产品的产品版,试用版License。
clpcfchk
检查集群配置信息。
状态显示相关
命令
说明
请参阅
clpstat
显示EXPRESSCLUSTER X SingleServerSafe状态和设置信息。
clphealthchk
确认进程的健全性。
操作相关
命令
说明
请参阅
clpcl
执行集群Daemon的启动,停止,挂起,复原等。
clpstdn
停止EXPRESSCLUSTER Daemon,关闭服务器。
clpgrp
执行组的启动,停止。
clptoratio
延长,显示集群中的各种超时值。
clpmonctrl
暂时停止/重新启动单个服务器上的监视资源。
clpregctrl
显示/初始化单个服务器上的重启次数。
clprsc
组资源的暂时停止/重新启动。
clpcpufreq
控制CPU频率。
clptrnreq
要求服务器处理执行。
clprexec
外部监视请求EXPRESSCLUSTER服务器执行处理。
clpbmccnf
更改BMC用户名,密码信息。
日志相关
命令
说明
请参阅
clplogcc
收集日志,OS信息等。
clplogcf
更改,显示日志级别,日志输出文件大小的设置。
clpperfc
显示组,监视资源相关的集群统计信息。
脚本相关
命令
说明
请参阅
clplogcmd
在EXEC资源的脚本中描述,将任意消息输出到输出目标中。
系统监视相关 (使用System Resorce Agent情况)
命令
说明
请参阅
clpprer
通过给出的资源使用量数据的趋势,预测未来值。
重要
虽然安装目录下面有本手册中未记载的执行方式文件及脚本文件,但是请勿从EXPRESSCLUSTER X SingleServerSafe以外执行。否则,由此导致的影响将不属于技术支持的范围。
2.3. 显示状态 (clpstat 命令)
显示EXPRESSCLUSTER X SingleServerSafe 的状态及设置信息。
-
命令行 - clpstat -s [--long]clpstat -gclpstat -mclpstat -i [--detail]clpstat --cl [--detail]clpstat --sv [--detail]clpstat --grp [group_name] [--detail]clpstat --rsc [resource_name] [--detail]clpstat --mon [monitor_name] [--detail]
-
说明 显示服务器的状态及设置信息。
-
选项 -
-s
-
无选项¶ 显示状态。
-
--long¶ 显示集群名,资源名等信息的全部。
-
-g¶ 显示组地图。
-
-m¶ 显示各监视资源的状态。
-
-i¶ 显示设置信息。
-
--cl¶ 显示设置信息。
-
--sv¶ 显示服务器的设置信息。
-
--grp[group_name]¶ 显示组的设置信息。通过指定组名,只能显示指定的组信息。
-
--rsc[resource_name]¶ 显示组资源的设置信息。通过指定组资源名,只能显示指定的组资源信息。
-
--mon[monitor_name]¶ 显示监视资源的设置信息。通过指定监视资源名,只能显示指定的监视资源信息。
-
--detail¶ 通过使用该选项,可以显示更加详细的设置信息。
-
-
返回值 0
成功
9
二次启动
上记以外
异常
-
注意事项
-
错误消息 消息
原因/处理办法
Log in as root.
请以拥有root权限的用户身份执行该命令。
Invalid configuration file. Create valid cluster configuration data.
请使用Cluster WebUI创建正确的集群配置信息。
Invalid option.
请指定正确的选项。
Could not connect to the server. Check if the cluster daemon is active.
请确认EXPRESSCLUSTER Daemon是否启动。
Invalid server status.
请确认EXPRESSCLUSTER Daemon是否启动。
Server is not active. Check if the cluster daemon is active.
请确认EXPRESSCLUSTER Daemon是否启动。
Invalid server name. Specify a valid server name in the cluster.
请指定集群内正确的服务器名。
Invalid heartbeat resource name. Specify a valid heartbeat resource name in the cluster.
请指定集群内正确的心跳资源名。
Invalid network partition resourcename. Specify a valid networkpartition resource name in the cluster.请指定集群内正确网络分区解决资源名。Invalid group name. Specify a valid group name in the cluster.
请指定集群内正确的组名。
Invalid group resource name. Specify a valid group resource name in the cluster.
请指定集群内正确的组资源名。
Invalid monitor resource name. Specify a valid monitor resource name in the cluster.
请指定集群内正确的监视资源名。
Connection was lost. Check if there is a server where the cluster daemon is stopped in the cluster.
请确认集群内是否存在EXPRESSCLUSTER Daemon停止的服务器。
Invalid parameter.
可执行是命令的参数中设置了非法的值。
Internal communication timeout has occurred in the cluster server. If it occurs frequently, set the longer timeout.EXPRESSCLUSTER的内部通信中发生超时。如果频繁发生超时,请延长内部通信超时时间。Internal error. Check if memory or OS resources are sufficient.
内存不足或者OS资源不足。请确认。
Invalid server group name. Specify a valid server group name in the cluster.
请指定集群内正确的服务器组名。
This command is already run.本命令已被执行。不能双重启动本命令。The cluster is not created.
请做成集群配置文件并上传。
Could not connect to the server. Internal error. Check if memory or OS resources are sufficient.
内存不足或者OS资源不足。请确认。
Cluster is stopped. Check if the cluster daemon is active.
请确认EXPRESSCLUSTER Daemon是否启动。
Cluster is suspended. To display the cluster status, use --local option.集群处于暂停状态。要显示集群的状态,请使用--local选项。
2.4. 操作EXPRESSCLUSTER Daemon (clpcl 命令)
操作EXPRESSCLUSTER Daemon。
-
命令行 - clpcl -sclpcl -t [-w timeout] [--apito timeout]clpcl -r [-w timeout] [--apito timeout]clpcl --suspend [--force] [-w timeout] [--apito timeout]clpcl --resume
-
说明 执行EXPRESSCLUSTER Daemon的启动,停止,暂停,复原等命令。
-
选项 -
-s¶ 启动EXPRESSCLUSTERDaemon。
-
-t¶ 停止EXPRESSCLUSTERDaemon。
-
-r¶ 重启EXPRESSCLUSTERDaemon。
-
--suspend¶ 暂停EXPRESSCLUSTERDaemon。
-
--resume¶ 复原EXPRESSCLUSTERDaemon。
-
-wtimeout¶ - 只有使用-t, -r, --suspend选项时,指定clpcl命令等待EXPRESSCLUSTERDaemon停止或等待完成挂起的等待时间。单位为秒。未指定timeout时将一直等待。timeout中指定了"0"时,不作等待。未指定-w选项时,等待时间为(心跳超时×2)秒。
-
--force¶ 由于和--suspend选项一起使用,不管服务器状态,强行执行挂起。
-
--apitotimeout¶ - 以秒为单位指定等待EXPRESSCLUSTER Damon的停止,重启,挂起的时间(内部通信超时)。可指定1-9999的值。不指定[--apito]选项时,按照集群属性的内部通信超时所设置的值,进行等待。
-
-
返回值 0
成功
0 以外
异常
-
备考 - 指定-s或--suspend选项来执行本命令时,在对象服务器中处理开始时返回控制。指定-t或--suspend选项来执行本命令时,等待处理结束后返回控制。指定-r选项来执行本命令时,对象服务器的EXPRESSCLUSTER X SingleServerSafeDaemon服务从暂停到启动时返回控制。请使用clpstat命令确认EXPRESSCLUSTER X SingleServerSafeDaemon服务是否未启动或挂起。
-
注意事项 - 请以拥有root权限的用户身份执行该命令。在组的启动处理中和停止处理中不能执行该命令。请在EXPRESSCLUSTERDaemon处于已启动的状态下执行挂起。如果使用--force选项,强制执行挂起。执行复原时,请使用clpstat命令确认EXPRESSCLUSTERDaemon是否未启动。
-
执行示例 例1: 启动服务器EXPRESSCLUSTERDaemon时
# clpcl -s
关于挂起/复原
要更新集群配置信息,升级EXPRESSCLUSTER等时,可以在继续操作业务时停止EXPRESSCLUSTER Daemon服务。此种状态称为挂起。从挂起状态返回到普通的业务状态叫做复原。对服务器请求挂起/复原处理。请在服务器的ExpressCluterDaemon已启动的状态下执行挂起。在挂起状态下,启动的资源保持启动状态,停止ExpressCluter服务,会导致以下功能停止。停止所有监视资源。
无法操作组及组资源。(启动,停止)
不能使用以下命令。
clpcl --resume以外的其他选项
clpstdn
clpgrp
clptoratio
clpmonctrl
-
错误消息 消息
原因/处理方法
Log in as root.
请以拥有root权限的用户身份执行该命令。
Invalid configuration file. Create valid cluster configuration data.
请在Cluster WebUI中创建正确的集群配置信息。
Invalid option.
请指定正确的选项。
Performed stop processing to the stopped cluster daemon.
对停止的EXPRESSCLUSTER Daemon执行停止处理。
Performed startup processing to the active cluster daemon.
对启动的EXPRESSCLUSTER Daemon执行启动处理。
Could not connect to the server. Check if the cluster daemon is active.
请确认EXPRESSCLUSTER Daemon是否启动。
Could not connect to the data transferserver. Check if the server has startedup.请确认服务器已经启动。Failed to obtain the list of nodes. Specify a valid server name in the cluster.
请指定集群内正确的服务器名。
Failed to obtain the daemon name.
取得集群名失败。
Failed to operate the daemon.
控制集群失败。
Resumed the daemon that is not suspended.
对于非挂起状态的EXPRESSCLUSTER Daemon执行复原。
Invalid server status.
请确认EXPRESSCLUSTER Daemon是否启动。
Server is busy. Check if this command is already run.
可执行已经执行本命令。请确认。
Server is not active. Check if the cluster daemon is active.
请确认EXPRESSCLUSTER Daemon是否启动。
There is one or more servers of which cluster daemon is active. If you want to perform resume, check if there is any server whose cluster daemon is active in the cluster.
执行复原时,请确认集群内是否有已启动EXPRESSCLUSTER Daemon的服务器。
All servers must be activated. When suspending the server, the cluster daemon need to be active on all servers in the cluster.
执行挂起时,需要集群内所有的服务器都启动EXPRESSCLUSTER Daemon。
Resume the server because there is one or more suspended servers in the cluster.
集群中有挂起的服务器,请执行复原。
Invalid server name. Specify a valid server name in the cluster.
请指定集群内正确的服务器名。
Connection was lost. Check if there is a server where the cluster daemon is stopped in the cluster.
请确认集群内是否存在EXPRESSCLUSTER Daemon停止的服务器。
invalid parameter.
命令参数中可执行设置了错误的值。
Internal communication timeout has occurred in the cluster server. If it occurs frequently, set the longer timeout.
EXPRESSCLUSTER内部通信发生超时。如果频繁发生超时,请延长内部通信超时时间。Processing failed on some servers. Check the status of failed servers.存在处理失败的服务器。请确认集群内的服务器状态。请执行集群内所有启动的服务器。Internal error. Check if memory or OS resources are sufficient.
内存不足或者OS资源不足。请确认。
There is a server that is not suspended in cluster. Check the status of each server.
集群内存在不处于挂起状态的服务器。请确认各服务器的状态。
Suspend %s : Could not suspend in time.
服务器在超时时间内未完成EXPRESSCLUSTER Daemon的挂起处理。请确认服务器的状态。
Stop %s : Could not stop in time.
服务器在超时时间内未完成EXPRESSCLUSTER Daemon的停止处理。请确认服务器的状态。
Stop %s : Server was suspended.Could not connect to the server. Check if the cluster daemon is active..已要求EXPRESSCLUSTER Daemon停止,但服务器已处于挂起状态。Could not connect to the server. Check if the cluster daemon is active.
已要求EXPRESSCLUSTER Daemon停止,但无法连接服务器。请确认服务器的状态。
Suspend %s : Server already suspended.Could not connect to the server. Check if the cluster daemon is active.已要求EXPRESSCLUSTER Daemon挂起,但服务器已处于挂起状态。Event service is not started.
事件服务没有启动。请确认。
Mirror Agent is not started.
镜像Agent没有启动。请确认。
Event service and Mirror Agent are not started.
事件服务和镜像Agent没有启动。请确认。
Some invalid status. Check the status of cluster.
可执行存在迁移中的组。请在组迁移结束后,重新执行。
2.5. 服务器关机 (clpstdn命令)
服务器关机。
-
命令行 clpstdn [-r]
-
说明 停止服务器的EXPRESSCLUSTER Daemon,关机。
-
返回值 0
成功
0 以外
异常
注解
本命令,在组停止处理完成的时候才能被返回。
-
注意事项 - 请由拥有root权限的用户身份执行该命令。在组的启动处理中和停止处理中不能执行该命令。
-
执行示例 例1:进行服务器关机时
# clpstdn
例2:进行服务器的关机重启时
# clpstdn -r
2.6. 操作组 (clpgrp 命令)
操作组。
-
命令行 - clpgrp -s [group_name] [--apito timeout]clpgrp -t [group_name] [--apito timeout]
-
说明 执行组的启动,停止。
-
选项 -
-s[group_name]¶ 启动组。指定组名,则仅启动指定的组。如果未指定组名,则启动所有组。
-
-t[group_name]¶ 停止组。指定组名,则仅停止指定的组。如果未指定组名,则停止所有组。
-
--apitotimeout¶ - 以秒为单位指定等待EXPRESSCLUSTER Damon的停止,重启,挂起的时间(内部通信超时)。可指定1-9999的值。不指定[--apito]选项时,按照集群属性的内部通信超时所设置的值,进行等待。
-
-
返回值 0
成功
0 以外
异常
-
注意事项 - 请由拥有root权限的用户身份执行该命令。执行本命令的服务器必须启动EXPRESSCLUSTER Daemon。
-
执行示例 - 通过简单的示例对执行组操作进行说明。服务器拥有[组groupA]时
在server1 服务器上执行以下的命令。启动groupA。
# clpgrp -s groupA

图 2.1 启动组
在server2上执行以下命令。停止groupA。
# clpgrp -t groupA
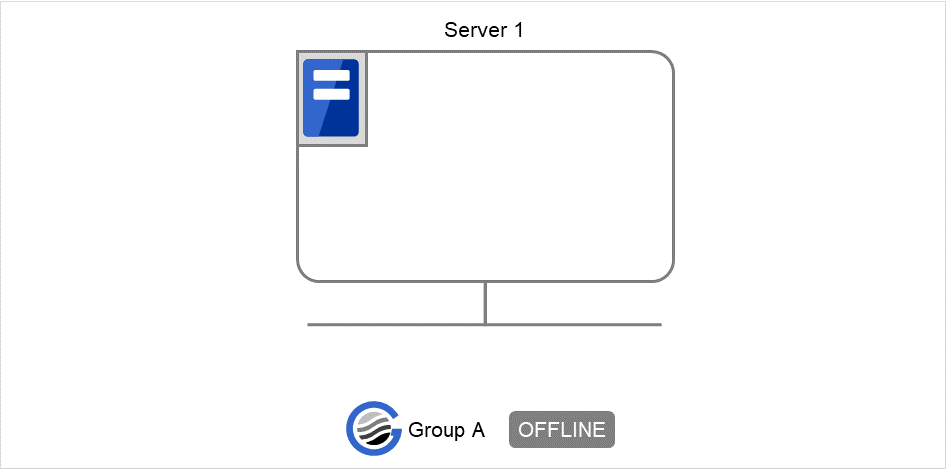
图 2.2 停止组
-
错误消息 消息
原因/处理方法
Log in as root.
请以拥有root权限的用户身份执行该命令。
Invalid configuration data. Create valid cluster configuration data.
请在Cluster WebUI中作成正确的集群配置信息。
Invalid option.
请指定正确的选项。
Could not connect to the server. Check if the cluster daemon is active.
请确认EXPRESSCLUSTER Daemon是否启动。
Invalid server status. Check if the cluster daemon is active.
请确认EXPRESSCLUSTER Daemon是否启动。
Server is not active. Check if the cluster daemon is active.
请确认EXPRESSCLUSTER Daemon是否启动。
Invalid server name. Specify a valid server name in the cluster.
请指定集群内正确的服务器名。
Connection was lost. Check if there is a server where the cluster daemon is stopped in the cluster.
请确认集群内是否存在EXPRESSCLUSTER Daemon停止的服务器。
Invalid parameter.
命令参数中可执行设置了错误的值。
Internal communication timeout has occurred in the cluster server. If it occurs frequently, set the longer timeout.EXPRESSCLUSTER内部通信发生超时。如果频繁发生超时,请延长内部通信超时时间。Invalid server. Specify a server that can run and stop the group, or a server that can be a target when you move the group.启动,停止,移动组的目标服务器有误。请指定正确的服务器。Could not start the group. Try it again after the other server is started, or after the Wait Synchronization time is timed out.
请等待其它服务器启动或等待启动等待时间超时,启动组。
No operable group exists in the server.
请确认请求处理的服务器中是否存在可处理的组。
The group has already been started on the local server.
请通过Cluster WebUI或clpstat命令确认组的状态。
The group has already been started on the other server. To start/stop the group on the local server, use -f option.请通过Cluster WebUI或clpstat命令确认组的状态。如果要在自身服务器上启动/停止其它服务器上启动的组,请执行组的移动,或加上-f选项执行。The group has already been started on the other server. To move the group, use "-h <hostname>" option.请通过Cluster WebUI或clpstat命令确认组的状态。如果要移动其他服务器上启动的组,请添加"-h <hostname>" 选项来执行。The group has already been stopped.
请通过Cluster WebUI或clpstat命令确认组的状态。
Failed to start one or more resources.Check the status of group
请通过Cluster WebUI或clpstat命令确认组的状态。
Failed to stop one or more resources.Check the status of group
请通过Cluster WebUI或clpstat命令确认组的状态。
The group is busy. Try again later.
组正处于启动处理或停止处理中,请稍后再执行。
An error occurred on one or more groups.Check the status of group
请通过Cluster WebUI或clpstat命令确认组的状态。
Invalid group name. Specify a valid group name in the cluster.
请指定集群内正确的组名。
Server is not in a condition to start group or any critical monitor error is detected.请通过Cluster WebUI或clpstat命令确认服务器的状态。在准备启动组的服务器中检测出包含在可排除列表中的监视器的异常。There is no appropriate destination for the group. Other servers are not in a condition to start group or any critical monitor error is detected.请通过Cluster WebUI或clpstat命令确认服务器的状态。在其他服务器中检测出包含在可排除列表中的监视器的异常。The group has been started on the other server. To migrate the group, use "-h <hostname>" option.请通过Cluster WebUI或clpstat命令确认组的状态。如果要移动在其他服务器上启动的组,请添加"-h <hostname>"选项来执行。The specified group cannot be migrated.
指定的组不能迁移。
The specified group is not vm group.
指定的组不是虚拟机的组。
Migration resource does not exist.请通过Cluster WebUI或clpstat命令确认组的状态。不存在迁移对象的资源。Migration resource is not started.请通过Cluster WebUI或clpstat命令确认组的状态。没有启动迁移对象的资源。Some invalid status. Check the status of cluster.
某些状态不正常。请确认集群状态。
Internal error. Check if memory or OS resources are sufficient.
内存不足或者OS资源不足。请确认。
2.7. 收集日志 (clplogcc 命令)
收集日志。
-
命令行 clplogcc [-t collect_type] [-r syslog_rotate_number] [-o path]
-
说明 连接到数据传送服务器,收集日志,OS信息等。
-
选项 -
无¶ 收集日志。
-
-tcollect_type¶ 指定日志收集模式。如果省略则日志收集模式为type1。
-
-rsyslog_rotate_number¶ 指定syslog 的收集版本数。省略时收集2版本。
-
-opath¶ 指定收集文件的输出目标。如果省略则将日志输出到安装路径的tmp下。
-
-
返回值 0
成功
0 以外
异常
-
备注 使用tar.gz压缩日志文件,所以请在tar命令上加上xzf 选项进行解压缩。
-
注意事项 请由拥有root权限的用户身份执行该命令。
-
执行示例 例1:从服务器收集日志时
# clplogcc
Collect Log server1 : Success
显示执行了日志收集的服务器的执行结果(服务器状态)。
处理过程 服务器名 :执行结果(服务器状态)
执行结果
该命令的结果所显示的处理过程如下所示。
处理过程
说明
Connec
连接失败时显示。
Get Filesize
文件大小获取失败时显示。
Collect Log
显示获取文件的结果。
执行结果(服务器状态)如下所示。
执行结果(服务器状态)
说明
Success
成功。
Timeout
超时。
Busy
服务器正忙。
Not Exist File
文件不存在。
No Freespace
磁盘没有剩余空间。
Failed
因其它的错误导致失败。
-
错误消息 消息
原因/处理方法
Log in as root.
请以拥有root权限的用户身份执行该命令。
Invalid configuration file. Create valid cluster configuration data.
请在Cluster WebUI中作成正确的配置信息。
Invalid option.
请指定正确的选项。
Specify a number in a valid range.
请在正确的范围内指定数字。
Specify a correct number.
请指定正确的数字。
Specify correct generation number of syslog.
请指定正确的syslog版本数。
Collect type must be specified 'type1' or 'type2' or 'type3' or 'type4' or 'type5' or 'type6'. Incorrect collection type is specified.
错误指定收集类型。
Specify an absolute path as the destination of the files to be collected.
请在绝对路径下指定收集文件的输出目标。
Specifiable number of servers are the max number of servers that can constitute a cluster.
可指定的服务器数为可进行集群配置的最大服务器数。
Could not connect to the server. Check if the cluster daemon is active.
请确认EXPRESSCLUSTER Daemon是否启动。
Invalid server status.
请确认EXPRESSCLUSTER Daemon是否启动。
Server is busy. Check if this command is already run.
可执行已经执行本命令。请确认。
Internal error. Check if memory or OS resources are sufficient.
内存不足或者OS资源不足。请确认。
2.7.1. 收集指定类型的日志 (-t 选项)
仅想收集指定类型的日志时,请使用clplogcc命令指定-t选项。
日志的收集类型可指定为type1 ~ 6。
type1
type2
type3
type4
type5
type6
按缺省设置收集日志
✓
✓
✓
✓
n/a
n/a
syslog
✓
✓
✓
n/a
n/a
n/a
core文件
✓
✓
n/a
✓
n/a
n/a
OS信息
✓
✓
✓
✓
n/a
n/a
脚本
✓
✓
n/a
n/a
n/a
n/a
ESMPRO/AC
✓
✓
n/a
n/a
n/a
n/a
HA 日志
n/a
✓
n/a
n/a
n/a
n/a
镜像统计信息
n/a
n/a
n/a
n/a
n/a
n/a
集群统计信息
n/a
n/a
n/a
n/a
n/a
✓
系统资源统计信息
✓
✓
✓
✓
n/a
✓
# clplogcc -t type2
未指定选项时的日志收集类型为type1。
按缺省设置收集日志
EXPRESSCLUSTER服务器的各模块日志
警告日志
EXPRESSCLUSTER服务器的各模块的属性信息(ls -l)
bin,lib下
alert/bin,webmgr/bin下
drivers/md下
drivers/khb下
drivers/ka下
安装完毕的所有packge信息(rpm -qa的执行结果)
EXPRESSCLUSTER的版本信息(rpm -qi expresscls的执行结果)
Distribution信息(/etc/*-release)
License信息
配置信息文件
策略文件
EXPRESSCLUSTER正在使用的共享内存的dump
EXPRESSCLUSTER的状态(clpstat -local的执行结果)
进程,线程信息(ps 的执行结果)
PCI设备信息(lspci 的执行结果)
服务信息(systemctl,chkconfig,ls命令等的执行结果)
kernel参数的输出结果(sysctl -a 的执行结果)
glibc版本(rpm -qi glibc 的执行结果)
kernel Loadable模块设置信息(/etc/modules.conf,/etc/modprobe.conf)
kernel的Ring缓冲信息(dmesg 的执行结果)
文件系统信息 (/etc/fstab)
IPC资源信息(ipcs 的执行结果)
系统信息(uname -a 的执行结果)
网络统计信息(netstat, ss的执行结果 IPv4/IPv6)
ip (ip addr,link,maddr,route,-s l 的执行结果)
全网络界面信息(ethtool 的执行结果)
OS紧急关闭时的信息采集
libxml2版本(rpm -qi libxml2 的执行结果)
静的Host表(/etc/hosts)
文件系统的export table (exportfs -v 的执行结果)
用户资源限制信息(ulimit -a 的执行结果)
kernelbase的NFS中输出的文件系统(/etc/exports)
本地OS (locale)
Terminal session的环境变量(export 的执行结果)
本地语言(/etc/sysconfig/i18n)
Time zone (env - date 的执行结果)
EXPRESSCLUSTER服务器的工作领域信息
- 各监视选项产品相关的信息若安装了监视选项产品,则相关信息将被收集
监视器资源超时时采集的转储信息
Oracle监视器资源检出异常时采集的Oracle详细信息
syslog
syslog (/var/log/messages)
syslog (/var/log/syslog)
指定的版本数的syslog (/var/log/messages.x)
journal 日志(/var/run/log/journal/ 下的文件等)
Core文件
- EXPRESSCLUSTER模块的core文件/opt/nec/clusterpro/log下可以容纳以下存档名。
警报关联
altyyyymmdd_x.tar
WebManager服务器关联
wmyyyymmdd_x.tar
EXPRESSCLUSTER core关联
clsyyyymmdd_x.tar
srayyyymmdd_x.tar
jrayyyymmdd_x.tar
yyyymmdd为日志收集日期,x为连续编号。
OS信息
内核模式LAN心跳,启动信息
/proc/khb_moninfo
/proc/ka_moninfo
/proc/devices
/proc/mdstat
/proc/modules
/proc/lvm
/proc/mounts
/proc/meminfo
/proc/cpuinfo
/proc/partitions
/proc/pci
/proc/version
/proc/ksyms
/proc/net/bond*
/proc/scsi/目录内的全文件
/proc/ide/目录内的全文件
/etc/fstab
/etc/rc*.d
/etc/syslog.conf
/etc/syslog-ng/syslog-ng.conf
/proc/sys/kernel/core_pattern
/proc/sys/kernel/core_uses_pid
/etc/snmp/snmpd.conf
内核的Ring缓冲信息(dmesg 的执行结果)
ifconfig (ifconfig的执行结果)
iptables (iptables -L的执行结果)
ipchains (ipchains -L的执行结果)
df (df的执行结果)
raw设备信息 (raw -qa的执行结果)
内核模块road信息(lsmod的执行结果)
主机名,域名信息(hostname,domainname的执行结果)
dmidecode (dmidecode的执行结果)
LVM 设备信息(vgdisplay -v 的执行结果)
snmpd版本信息(snmpd -v的执行结果)
虚拟化基础架构信息(virt-what的执行结果)
执行日志收集时,有时在控制台上显示下列消息,这并非是异常现象。日志可以正常收集。
hd#: bad special flag: 0x03
ip_tables: (C) 2000-2002 Netfilter core team
(在hd#中加入服务器上存在的IDE的设备名)- 脚本在Cluster WebUI创建的组启动/停止脚本如果指定了上述以外的用户定义脚本(/opt/nec/clusterpro/scripts以外),则由于不包含在日志收集的采集信息中,需要另外采集。
- ESMPRO/AC相关日志通过执行acupslog命令收集的文件
HA 日志
系统资源信息
JVM监视日志
系统监视日志
- 镜像统计信息此版本中不能收集。
集群统计信息
集群统计信息
perf/cluster 下
系统资源统计信息
系统资源统计信息
/perf/system 下
2.7.2. syslog的版本 (-r 选项)
收集指定的版本数时如下执行syslog。
例)使用版本数3收集日志时
# clplogcc -r 3
收集的日志包含以下的syslog。
未指定选项时收集第2版本的。
可以指定的版本数为0~99 。
指定0时收集所有的syslog。
版本数 |
获取的版本 |
|---|---|
0 |
所有版本 |
1 |
当前 |
2 |
当前 + 版本1 |
3 |
当前 + 版本1~2 |
: |
|
x |
当前 + 版本1~(x-1) |
2.7.3. 日志文件的输出目标 (-o 选项)
文件名保存为 "服务器名-log.tar.gz"。
使用tar.gz压缩日志文件,所以请在tar命令上加上xzf 选项进行解压缩。
未指定-o选项时
在安装路径的tmp下输出日志。
# clplogcc
Collect Log 服务器名: Success
# ls /opt/nec/clusterpro/tmp
服务器名-log.tar.gz
指定-o选项时
若执行以下命令,则将日志输出到指定的目录/home/log下。
# clplogcc -o /home/log
Collect Log 服务器名: Success
# ls /home/log
服务器名-log.tar.gz
2.7.4. 采集发生异常时的信息
发生下列异常时,采集如下信息用于故障分析。
构成集群的集群Daemon由于信号的插入而结束(core dump),或因内部状态异常等异常结束时
组资源的启动异常,停止异常发生时
监视资源的监视异常发生时
采集的信息如下。
信息
EXPRESSCLUSTER服务器的部分模块的日志
EXPRESSCLUSTER X SingleServerSafe正在使用的共享内存的dump
配置信息文件
EXPRESSCLUSTER模块的core文件
OS情報(/proc/*)
/proc/devices
/proc/partitions
/proc/mdstat
/proc/modules
/proc/mounts
/proc/meminfo
/proc/net/bond*
执行命令产生的信息
sysctl -a 的结果
ps的结果
top的结果
ipcs的结果
netstat -in的结果
netstat -apn的结果
netstat -gn的结果
netstat -m的结果
ifconfig的结果
ip addr的结果
ip -s l的结果
df的结果
raw -qa的结果
journalctl -e 的结果
由于该信息作为日志收集的默认收集信息进行采集,因此无须单独采集。
2.8. 反映配置信息,备份配置信息 (clpcfctrl 命令)
2.8.1. 反映配置信息 (clpcfctrl --push)
在服务器上反映配置信息。
-
命令行 clpcfctrl --push -l|-w [-p portnumber] [-x directory] [--nocheck]
-
说明 向服务器上反映Cluster WebUI创建的配置信息。
-
选项 -
--push¶ - 反映时指定。不能省略。
-
-l¶ - 在Linux上使用通过Cluster WebUI保存的配置信息时指定。不能与-w同时指定。
-
-w¶ - Windows上使用通过Cluster WebUI保存的配置信息时指定。不能与-l同时指定。
-
-pportnumber¶ - 指定数据发送端口的端口号。省略时使用初始值。一般无需指定。
-
-xdirectory¶ - 反映指定目录下的配置信息时指定。与-l或者-w一同使用。指定-l时,使用Linux上通过Cluster WebUI保存在文件系统上的配置信息。指定-w时,使用Windows上通过Cluster WebUI保存的配置信息。
-
--nocheck¶ 不执行集群配置信息的检查。只在服务器删除时使用。平时请不要使用。
-
-
返回值 0
成功
0以外
异常
-
注意事项 请以拥有root权限的用户身份执行该命令。
-
执行示例 例1: 在Linux上使用Cluster WebUI发送文件系统上保存的配置信息时
# clpcfctrl --push -l -x /mnt/config
file delivery to server 127.0.0.1 success.
The upload is completed successfully.(cfmgr:0)
Command succeeded.(code:0)
-
错误消息 消息
原因/处理方法
Log in as root.
请以拥有root权限的用户身份执行该命令。
This command is already run.
本命令已经启动。
Invalid option.
选项非法。请确认选项。
Invalid mode.Check if --push or --pull option is specified.请确认是否已指定--pull。The target directory does not exist.
制定的目录不存在。
Invalid host name.Server specified by -h option is not included in the configuration data.使用-h指定的服务器不包含配置信息。请确认指定的服务器名或者IP地址是否正确。Canceled.
在命令的查询中输入"y"以外的值时显示。
Failed to initialize the xml library.Check if memory or OS resources are sufficient.内存不足或者OS资源不足。请确认。
Failed to load the configuration file.Check if memory or OS resources are sufficient.内存不足或者OS资源不足。请确认。
Failed to change the configuration file.Check if memory or OS resources are sufficient.内存不足或者OS资源不足。请确认。
Failed to load the all.pol file.Reinstall the RPM.请重新安装EXPRESSCLUSTER服务器RPM。Failed to load the cfctrl.pol file.Reinstall the RPM.请重新安装EXPRESSCLUSTER服务器RPM。Failed to get the install path.Reinstall the RPM.请重新安装EXPRESSCLUSTER服务器RPM。Failed to get the cfctrl path.Reinstall the RPM.请重新安装EXPRESSCLUSTER服务器RPM。Failed to get the list of group.
组列表取得失败。
Failed to get the list of resource.
资源列表取得失败。
Failed to initialize the trncl library.Check if memory or OS resources are sufficient.内存不足或者OS资源不足。请确认。Failed to connect to server %1.Check if the other server is active and then run the command again.与服务器连接失败。请确认是否已启动其他服务器。请启动服务器后再执行命令。Failed to connect to trnsv.Check if the other server is active.与服务器连接失败。请确认是否已启动其他服务器。File delivery failed.Failed to deliver the configuration data. Check if the other server is active and run the command again.发送配置信息失败。请确认是否已启动其他服务器。请启动服务器后再执行命令。Multi file delivery failed.Failed to deliver the configuration data. Check if the other server is active and run the command again.发送配置信息失败。请确认是否已启动其他服务器。请启动服务器后再执行命令。Failed to deliver the configuration data.Check if the other server is active and run the command again.发送配置信息失败。请确认是否已启动其他服务器。请启动服务器后再执行命令。The directory "/work" is not found.Reinstall the RPM.请重新安装EXPRESSCLUSTER服务器RPM。Failed to make a working directory.
内存不足或者OS资源不足。请确认。
The directory does not exist.
内存不足或者OS资源不足。请确认。
This is not a directory.
内存不足或者OS资源不足。请确认。
The source file does not exist.
内存不足或者OS资源不足。请确认。
The source file is a directory.
内存不足或者OS资源不足。请确认。
The source directory does not exist.
内存不足或者OS资源不足。请确认。
The source file is not a directory.
内存不足或者OS资源不足。请确认。
Failed to change the character code set (EUC to SJIS).
内存不足或者OS资源不足。请确认。
Failed to change the character code set (SJIS to EUC).
内存不足或者OS资源不足。请确认。
Command error.
内存不足或者OS资源不足。请确认。
Failed to initialize the cfmgr library.Check if memory or OS resources are sufficient.内存不足或者OS资源不足。请确认。Failed to get size from the cfmgr library.Check if memory or OS resources are sufficient.内存不足或者OS资源不足。请确认。Failed to allocate memory.
内存不足或者OS资源不足。请确认。
Failed to change the directory.
内存不足或者OS资源不足。请确认。
Failed to run the command.
内存不足或者OS资源不足。请确认。
Failed to make a directory.
内存不足或者OS资源不足。请确认。
Failed to remove the directory.
内存不足或者OS资源不足。请确认。
Failed to remove the file.
内存不足或者OS资源不足。请确认。
Failed to open the file.
内存不足或者OS资源不足。请确认。
Failed to read the file.
内存不足或者OS资源不足。请确认。
Failed to write the file.
内存不足或者OS资源不足。请确认。
Internal error.Check if memory or OS resources are sufficient.内存不足或者OS资源不足。请确认。The upload is completed successfully.To apply the changes you made, shutdown and reboot the cluster.上载成功。要反映变动,请执行服务器的关机,重启。The upload was stopped.To upload the cluster configuration data, stop the cluster.上载停止。要上载配置信息,请停止服务器。The upload was stopped.To upload the cluster configuration data, stop the Mirror Agent.上载停止。要上载配置信息,请停止镜像Agent。The upload was stopped.To upload the cluster configuration data, stop the resources to which you made changes.上载停止。要上载配置信息,请停止增加变动的资源。The upload was stopped.To upload the cluster configuration data, stop the groups to which you made changes.上载停止。要上载配置信息,需要挂起服务器。为了上载,请停止增加变动的组。The upload was stopped.To upload the cluster configuration data, suspend the cluster.上载停止。要上载配置信息,需要挂起服务器。请停止增加变动的组。The upload is completed successfully.To apply the changes you made, restart the Alert Sync.To apply the changes you made, restart the WebManager.上载成功。要反映配置信息,请重启AlertSync服务。要反映配置信息,请重新启动WebManager服务。Internal error.Check if memory or OS resources are sufficient.内存不足或者OS资源不足。请确认。The upload is completed successfully.
上载成功。
The upload was stopped.Failed to deliver the configuration data.Check if the other server is active and run the command again.上载停止。发送配置信息失败。请确认其他服务器的启动状态,重新执行命令。The upload was stopped.There is one or more servers that cannot be connected to.To apply cluster configuration information forcibly, run the command again with "--force" option.上载停止。存在无法连接的服务器。要强行上载配置信息,请指定—force选项,再重新执行命令。
2.8.2. 备份配置信息 (clpcfctrl --pull)
备份配置信息。
-
命令行 clpcfctrl --pull -l|w [-p portnumber] [-x directory]
-
说明 为了在Cluster WebUI上使用,备份集群配置信息。
-
选项 -
--pull¶ - 备份时指定。不能省略。
-
-l¶ - 作为Linux上的Cluster WebUI使用的配置信息备份时指定。不能与-w同时指定。
-
-w¶ - 作为Windows上的Cluster WebUI使用的配置信息备份时指定。不能与-l同时指定。
-
-pportnumber¶ - 指定数据发送端口的端口号。省略时使用初始值。一般无需指定。
-
-xdirectory¶ - 在指定目录下备份配置信息。与-l或者-w一同使用。指定-l时,作为Linux上使用Cluster WebUI所能读取的配置信息备份。指定-w时,作为Windows上使用Cluster WebUI所能写入的配置信息保存。
-
-
返回值 0
成功
0以外
异常
-
注意事项 请以拥有root权限的用户身份执行该命令。
-
执行示例 例1: Linux 上的Cluster WebUI为了将读取的配置信息备份到指定目录上时
# clpcfctrl --pull -l -x /mnt/config
Command succeeded.(code:0)
-
错误消息 消息
原因/处理方法
Log in as root.
请以拥有root权限的用户身份执行该命令。
This command is already run.
已启动。
Invalid option.
选项非法。请确认选项。
Invalid mode.Check if --push or --pull option is specified.请确认是否已指定--push。The target directory does not exist.
不存在指定的目录。
Canceled.
在命令的查询中输入"y"以外的值时显示。
Failed to initialize the xml library.Check if memory or OS resources are sufficient.内存不足或者OS资源不足。请确认。
Failed to load the configuration file.Check if memory or OS resources are sufficient.内存不足或者OS资源不足。请确认。
Failed to change the configuration file.Check if memory or OS resources are sufficient.内存不足或者OS资源不足。请确认。
Failed to load the all.pol file.Reinstall the RPM.请重新安装EXPRESSCLUSTER服务器RPM。
Failed to load the cfctrl.pol file.Reinstall the RPM.请重新安装EXPRESSCLUSTER服务器RPM。Failed to get the install path.Reinstall the RPM.请重新安装EXPRESSCLUSTER服务器RPM。Failed to get the cfctrl path.Reinstall the RPM.请重新安装EXPRESSCLUSTER服务器RPM。Failed to initialize the trncl library.Check if memory or OS resources are sufficient.内存不足或者OS资源不足。请确认。
Failed to connect to server %1.Check if the other server is active and then run the command again.与服务器连接失败。请确认是否已启动其他服务器。请启动服务器后再执行命令。Failed to connect to trnsv.Check if the other server is active.与服务器连接失败。请确认是否已启动其他服务器。Failed to get configuration data.Check if the other server is active.配置信息获取失败。请确认是否已启动其他服务器。The directory "/work" is not found.Reinstall the RPM.请重新安装EXPRESSCLUSTER服务器RPM。Failed to make a working directory.
内存不足或者OS资源不足。请确认。
The directory does not exist.
内存不足或者OS资源不足。请确认。
This is not a drirectory.
内存不足或者OS资源不足。请确认。
The source file does not exist.
内存不足或者OS资源不足。请确认。
The source file is a directory.
内存不足或者OS资源不足。请确认。
The source directory does not exist.
内存不足或者OS资源不足。请确认。
The source file is not a directory.
内存不足或者OS资源不足。请确认。
Failed to change the character code set (EUC to SJIS).
内存不足或者OS资源不足。请确认。
Failed to change the character code set (SJIS to EUC).
内存不足或者OS资源不足。请确认。
Command error.
内存不足或者OS资源不足。请确认。
Failed to initialize the cfmgr library.Check if memory or OS resources are sufficient.内存不足或者OS资源不足。请确认。Failed to get size from the cfmgr library.Check if memory or OS resources are sufficient.内存不足或者OS资源不足。请确认。Failed to allocate memory.
内存不足或者OS资源不足。请确认。
Failed to change the directory.
内存不足或者OS资源不足。请确认。
Failed to run the command.
内存不足或者OS资源不足。请确认。
Failed to make a directory.
内存不足或者OS资源不足。请确认。
Failed to remove the directory.
内存不足或者OS资源不足。请确认。
Failed to remove the file.
内存不足或者OS资源不足。请确认。
Failed to open the file.
内存不足或者OS资源不足。请确认。
Failed to read the file.
内存不足或者OS资源不足。请确认。
Failed to write the file.
内存不足或者OS资源不足。请确认。
Internal error.Check if memory or OS resources are sufficient.内存不足或者OS资源不足。请确认。
2.9. 超时临时调整命令 (clptoratio 命令)
延长,显示当前的超时倍率。
-
命令行 - clptoratio -r ratio -t timeclptoratio -iclptoratio -s
-
说明 暂时延长下列各种超时值。
监视资源
心跳资源
警报同步服务
WebManager 服务
显示当前超时倍率。
-
选项 -
-rratio¶ - 指定超时倍率。请设置为大于等于1的整数值。最大超时倍率为10000倍。如果指定"1",则与-i选项一样,可将已更改的超时倍率还原。
-
-ttime¶ - 指定延长期间。可指定分m,小时h,日d。最大延长期间为30日。例)2m,3h,4d
-
-i¶ 还原更改的超时倍率。
-
-s¶ 参考当前的超时倍率。
-
-
返回值 0
成功
0 以外
异常
-
注意事项 - 请以拥有root权限的用户身份执行该命令。请在启动了服务器的EXPRESSCLUSTER Daemon的状态下执行。设置超时倍率时,请务必指定延长期间。但如果超时倍率指定为"1",则无法指定延长期间。指定延长期间时不能指定为"2m3h"等组合。
-
执行示例 例1: 将超时倍率设为3天2倍时
# clptoratio -r 2 -t 3d
例2: 还原超时倍率时
# clptoratio -i
例3: 参考当前超时倍率时
# clptoratio -s
present toratio : 2
即可知当前的超时倍率为2。
-
错误消息 消息
原因/处理方法
Log in as root.
请以拥有root权限的用户身份执行该命令。
Invalid configuration file. Create valid cluster configuration data.
请在Cluster WebUI中作成正确的集群配置信息。
Invalid option.
请指定正确的选项。
Specify a number in a valid range.
请在正确的范围内指定数字。
Specify a correct number.
请指定正确的数字。
Scale factor must be specified by integer value of 1 or more.
请将倍率指定为1以上的整数值。
Specify scale factor in a range less than the maximum scale factor.
请在不超越最大倍率的范围内指定倍率。
Set the correct extension period.
请设置正确的延长期间。
Ex) 2m, 3h, 4d
请在不超越最大延长期间的范围内设置延长时间。
Set the extension period in a range less than the maximum extension period.
请确认EXPRESSCLUSTER Daemon是否启动。
Could not connect to the server. Check if the cluster daemon is active.
请确认EXPRESSCLUSTER Daemon是否启动。
Server is not active. Check if the cluster daemon is active.
请确认集群内是否存在EXPRESSCLUSTER Daemon停止的服务器。
Connection was lost. Check if there is a server where the cluster daemon is stopped in the cluster.
请确认集群内是否存在EXPRESSCLUSTER Daemon停止的服务器。
Invalid parameter.
命令参数中可执行设置了错误的值。
Internal communication timeout has occurred in the cluster server. If it occurs frequently, set the longer timeout.
EXPRESSCLUSTER内部通信发生超时。如果频繁发生超时,请延长内部通信超时时间。
Processing failed on some servers. Check the status of failed servers.
存在处理失败的服务器。请确认集群内服务器的状态。在集群内所有服务器都为启动状态下执行。Internal error. Check if memory or OS resources are sufficient.
可执行是内存不足或者OS资源不足。请确认。
2.10. 日志级别/大小更改命令 (clplogcf 命令)
更改和显示日志级别,日志输出文件大小的设置。
-
命令行 clplogcf -t type -l level -s size
-
说明 - 更改日志级别,日志输出文件大小的设置。显示当前的设置值。
-
选项 -
-ttype¶ - 指定要更改设置的模块类型。省略-l或-s时,显示指定的模块类型中设置的信息。可指定的类型请参考"日志级别/大小更改命令 (clplogcf 命令)"表。
-
-llevel¶ - 指定日志级别。可指定的日志级别如下。1,2,4,8,16,32数值越大输出的日志越详细。
-
-ssize¶ - 指定要输出日志的文件的大小。单位是byte。
-
无¶ 显示当前设置的所有信息。
-
-
返回值 0
成功
0以外
异常
-
备注 EXPRESSCLUSTER输出的日志在各类型上使用 4个日志文件。因此需要4 倍于-s 所指定的磁盘容量。
-
注意事项 - 请以拥有root权限的用户身份执行该命令。执行本命令需要EXPRESSCLUSTER事件服务处于运行状态。服务器重启的话设定会被恢复为原来到设置。
-
执行示例 例1: 更改pm的日志级别时
# clplogcf -t pm -l 8
例2: 参考pm的日志级别,日志文件大小时
# clplogcf -t pm
TYPE, LEVEL, SIZE
pm, 8, 1000000
例3: 显示当前的设置值
# clplogcf
TYPE, LEVEL, SIZE
trnsv, 4, 1000000
xml, 4, 1000000
logcf, 4, 1000000
-
错误消息 消息
原因/处理方法
Log in as root.
请用root用户执行。
Invalid option.
选项无效。请确认选项。
Failed to change the configuration. Check if clpevent is running.
可执行clpevent未启动。
Invalid level
指定的级别无效。
Invalid size
指定的大小无效。
Failed to load the configuration file. Check if memory or OS resources are sufficient.
未被生成的服务器。
Failed to initialize the xml library. Check if memory or OS resources are sufficient.
可执行是内存不足或OS资源不足。请确认。
Failed to print the configuration. Check if clpevent is running.
可执行clpevent未启动。
-t选项中可指定的类型
类型
模块
说明
本体
apicl
libclpapicl.so.1.0
API客户端库
✓
apisv
libclpapisv.so.1.0
API服务器
✓
bmccnf
clpbmccnf
BMC信息更新命令
✓
cl
clpcl
启动,停止命令
✓
cfctrl
clpcfctrl
生成,信息备份命令
✓
cfmgr
libclpcfmgr.so.1.0
配置信息操作库
✓
cpufreq
clpcpufreq
CPU频率控制命令
✓
grp
clpgrp
组启动,停止命令
✓
rsc
clprsc
组资源启动,停止命令
✓
haltp
clpuserw
关机停止(stall)监视
✓
healthchk
clphealthchk
进程健全性确认命令
✓
ibsv
clpibsv
Information Base 服务器
✓
lcns
libclplcns.so.1.0
License库
✓
lcnsc
clplcnsc
License登录命令
✓
logcc
clplogcc
日志收集命令
✓
logcf
clplogcf
日志级别,大小更改命令
✓
logcmd
clplogcmd
警报输出命令
✓
clpmail
Mail通告
✓
mgtmib
libclpmgtmib.so.1.0
SNMP 联动库
✓
monctrl
clpmonctrl
监视控制命令
✓
nm
clpnm
节点图管理
✓
pm
clppm
进程管理
✓
rc/rc_ex
clprc
组,组资源管理
✓
reg
libclpreg.so.1.0
重启次数控制库
✓
regctrl
clpregctrl
重启次数控制命令
✓
rm
clprm
监视器管理
✓
roset
clproset
磁盘控制
✓
relpath
clprelpath
进程强行结束命令
✓
scrpc
clpscrpc
脚本日志轮询执行命令
✓
stat
clpstat
状态显示命令
✓
stdn
clpstdn
服务器关机命令
✓
toratio
clptoratio
超时倍率更改命令
✓
trap
clptrap
SNMP Trap发送命令
✓
trncl
libclptrncl.so.1.0
事务库
✓
rexec
clprexec
外部监视联动处理请求命令
✓
trnsv
clptrnsv
事务服务器
✓
volmgrc
clpvolmgrc
VxVM磁盘组 import/deport命令
✓
alert
clpaltinsert
警报
✓
webmgr
clpwebmc
WebManager服务
✓
webalert
clpaltd
警报同步
✓
exec
clpexec
EXEC资源
✓
vm
clpvm
VM资源
✓
diskw
clpdiskw
磁盘监视资源
✓
ipw
clpipw
IP监视资源
✓
miiw
clpmiiw
NIC Link Up/Down监视资源
✓
mtw
clpmtw
Multi-Target监视资源
✓
pidw
clppidw
PID监视资源
✓
volmgrw
clpvolmgrw
卷管理器监视资源
✓
userw
clpuserw
用户空间监视资源
✓
vmw
clpvmw
VM监视资源
✓
mrw
clpmrw
消息接收监视资源
✓
snmpmgr
libclp snmpmgr
SNMP Trap接收库
✓
lanhb
clplanhb
LAN心跳
✓
oraclew
clp_oraclew
Oracle监视资源
✓
db2w
clp_db2w
DB2监视资源
✓
psqlw
clp_psqlw
PostgreSQL监视资源
✓
mysqlw
clp_mysqlw
MySQL监视资源
✓
sybasew
clp_sybasew
Sybase监视资源
✓
odbcw
clp_odbcw
ODBC监视资源
✓
sqlserverw
clp_sqlserverw
SQL Server监视资源
✓
sambaw
clp_sambaw
Samba监视资源
✓
nfsw
clp_nfsw
NFS监视资源
✓
httpw
clp_httpw
HTTP监视资源
✓
ftpw
clp_ftpw
FTP监视资源
✓
smtpw
clp_smtpw
SMTP监视资源
✓
pop3w
clp_pop3w
POP3监视资源
✓
imap4w
clp_imap4w
IMAP4监视资源
✓
tuxw
clp_tuxw
Tuxedo监视资源
✓
wlsw
clp_wlsw
WebLogic监视资源
✓
wasw
clp_wasw
WebSphere监视资源
✓
otxw
clp_otxw
WebOTX监视资源
✓
jraw
clp_jraw
JVM 监视资源
✓
sraw
clp_sraw
系统监视资源
✓
psrw
clp_psrw
进程资源监视资源
✓
psw
Clppsw
进程名监视资源
✓
vmctrl
libclpvmctrl.so.1.0
VMCTRL库
✓
vmwcmd
clpvmwcmd
VMW 命令
✓
perfc
clpperfc
集群统计信息显示命令
✓
cfchk
clpcfchk
集群配置信息检查命令
✓
2.11. License管理命令 (clplcnsc 命令)
进行License的管理。
-
命令行: - clplcnsc -i [licensefile...]clplcnsc -l [-a]clplcnsc -d serialno [-q]clplcnsc -d -t [-q]clplcnsc -d -a [-q]clplcnsc --reregister licensefile...
-
说明 进行本产品的产品版/试用版License的登录,参照,删除。
-
选项 -
-i[licensefile...]¶ 如果指定License文件,则通过该文件获取并登录License信息。可以指定多个License文件。如果不指定,则通过交互方式输入并登录License信息。
-
-l[-a]¶ 浏览注册的License。显示的项目如下所示。
项目名
说明
Serial No
序列号(只适用产品版)
User name
用户名(只适用试用版)
Key
License Key
Licensed Number of CPU
License许可数(CPU个数)
Licensed Number of Computers
License许可数(节点个数)
Start date
End date
Status
License的状态
License的状态
状态
说明
valid
有效
invalid
无效
unknown
未知
inactive
expired
未指定-a选项时,不显示状态为invalid,unknown, expired的License。指定-a选项时,无论License的状态如何,显示全部的License。
-
-d<param>¶ param
- serialno
删除指定序列号的License。
- -t
删除已注册的全部试用版License。
- -a
删除已注册的全部License。
-
-q¶ 删除License时不显示确认信息。请与-d选项一起指定。
-
--reregisterlicensefile...¶ 请重新注册期间定制License。一般不需要执行该选项命令。
-
-
返回值 0
正常结束
1
取消
3
初始化错误
5
选项无效
8
其它内部错误
-
执行示例 注册 交互方式
# clplcnsc -i
产品版,期间定制版
选择产品区分
Selection of License Version
1.  Product Version
2.  Trial Version
e. Exit
Select License Version. [1, 2, or e (default:1)]...
输入序列号
Enter serial number [ Ex. XXXXXXXX000000 ] ...
输入License key
Enter license key
[ Ex. XXXXXXXX-XXXXXXXX-XXXXXXXX-XXXXXXXX] ...
试用版
选择产品区分
Selection of License Version
1.  Product Version
2.  Trial Version
e. Exit
Select License Version. [1, 2, or e (default:1)]...
输入用户名
Enter user name [ 1 to 63byte ]...
输入License key
Enter license key
[Ex. XXXXX-XXXXXXXX-XXXXXXXX-XXXXXXXX]...
指定License文件
# clplcnsc -i /tmp/cpulcns.key
浏览
# clplcnsc -l
产品版
< EXPRESSCLUSTER X SingleServerSafe <PRODUCT> >

Seq... 1
Key..... A1234567-B1234567-C1234567-D1234567
Licensed Number of CPU... 2
Status... valid

Seq... 2
Serial No..... AAAAAAAA000002
Key..... E1234567-F1234567-G1234567-H1234567
Licensed Number of Computers... 1
Status... valid
期间定制版
< EXPRESSCLUSTER X SingleServerSafe <PRODUCT> >

Seq... 1
Serial No..... AAAAAAAA000001
Key..... A1234567-B1234567-C1234567-D1234567
Start date..... 2018/01/01
End date...... 2018/01/31
Status........... valid

Seq... 2
Serial No..... AAAAAAAA000002
Key..... E1234567-F1234567-G1234567-H1234567
Status........... inactive
试用版
< EXPRESSCLUSTER X SingleServerSafe <TRIAL> >

Seq... 1
Key..... A1234567-B1234567-C1234567-D1234567
User name... NEC
Start date..... 2018/01/01
End date...... 2018/02/28
Status........... valid
删除
# clplcnsc -d AAAAAAAA000001 -q
删除
# clplcnsc -d -t -q
删除
# clplcnsc -d -a
删除确认
Are you sure to remove the license? [y/n] ...
-
注意事项 - 请以拥有root权限的用户身份执行该命令。使用-d选项时,同时指定-a选项,试用版License和产品版License将被全部删除。仅删除试用版License时,请并用-t选项。如果删除了产品版License时,请重新注册产品版License。浏览License时,如果License中包含多个License,它们将分别显示。
-
错误消息 消息
原因/处理方法
Processed license num(success : %d, error : %d).处理的License数(成功: %d, 失败: %d)失败数不为0时,说明某种原因下处理License失败。请确认License信息是否正确。Command succeeded.
命令成功。
Command failed.
命令失败。
Log in as root.
无执行命令的权限。请用有root权限的用户执行。
Invalid cluster configuration data. Check the cluster configuration information.
集群配置信息无效。请使用Cluster WebUI确认集群配置信息。
Initialization error. Check if memory or OS resources are sufficient.
初始化失败。可执行是内存不足或OS资源不足。请确认。
The command is already run.
命令已经执行。请用ps命令等确认执行状态。
The license is not registered.
未注册License。请注册License。
Could not opened the license file. Check if the license file exists on the specified path.Could not read the license file. Check if the license file exists on the specified path.无法向License文件进行I/O。请确认License文件是否存在于指定的路径。The field format of the license file is invalid. The license file may be corrupted. Check the destination from where the file is sent.
License文件的域格式无效。可执行License文件有破损。请确认文件的发送源。
The cluster configuration data may be invalid or not registered.
可执行是集群配置信息无效或未被登录。请确认。
Failed to terminate the library. Check if memory or OS resources are sufficient.
可执行是内存不足或OS资源不足。请确认。
Failed to register the license. Check if the entered license information is correct.Failed to open the license. Check if the entered license information is correct.请确认输入的License信息是否正确。Failed to remove the license.
删除License失败。可执行是参数错误或内存不足或OS资源不足。请确认。
This license is already registered.
该License已注册。请确认已注册的License。
This license is already activated.
该License已经被使用。请确认已注册的License。
This license is unavailable for this product.
该License不适用于该产品。请确认License。
The maximum number of licenses was reached.
已达到可以注册的最大License数。请删除到期的License。
Internal error. Check if memory or OS resources are sufficient.
可执行是内存不足或OS资源不足。请确认。
2.12. 消息输出命令 (clplogcmd 命令)
将指定的消息登录syslog,警报日志或者mail通告的命令。
-
命令行 clplogcmd -m message [--syslog] [--alert] [--mail] [-i eventID] [-l level]
注解
一般在 服务器的构筑和操作中不必要执行该命令。该命令是在EXEC资源的脚本中描述后使用的命令。
-
说明 在EXEC资源的脚本中描述,将任意的消息输出到输出目标。
-
选项 -
-
--syslog
-
--alert
-
--mail
-
--trap¶ - 从syslog,alert,mail,trap中指定输出目标(可指定多个。)。该参数可省略。省略时,输出目标是syslog和alert。
-
-ieventID¶ - 指定事件ID。事件ID的最大值是10000。该参数可省略。省略时,eventID被设为1。
-
-llevel¶ - 指输出警报的级别。指定ERR,WARN,INFO中的任意一个。通过该级别指定Cluster WebUI上的警报日志的图标。该参数可省略。省略时,level被设为INFO。详细信息请参考在线版手册。
-
-
返回值 0
成功
0 以外
异常
-
注意事项 - 请以拥有root权限的用户身份执行该命令。输出目标中指定mail时,请进行可用mail命令发送mail的设置。
-
执行示例 - 例1: 只指定消息时(输出目标syslog,alert)EXEC资源的脚本中进行了以下描述时,往syslog,alert中输出消息。
clplogcmd -m test1
syslog中输出以下日志。
Sep 1 14:00:00 server1 clusterpro: <type: logcmd><event: 1> test1
例2: 指定消息,输出目标,事件ID,级别时(输出目标 mail)EXEC资源的脚本中进行了以下描述时,消息被发送到Cluster WebUI的集群的属性中设置的邮件地址。clplogcmd -m test2 --mail -i 100 -l ERR
以下内容的邮件被发送到mail的发送目标。
Message:test2
Type: logcmd
ID: 100
Host: server1
Date: 2018/09/01 14:00:00
例3: 指定消息,输出目标,事件ID,级别时(输出目标trap)EXEC资源的脚本中进行了以下描述时,消息被发送到Cluster WebUI集群的属性中设置的SNMP Trap 发送目标。clplogcmd -m test3 --trap -i 200 -l ERR
以下内容的SNMP Trap被发送到SNMP Trap的发送目标。
Trap OID: clusterEventError添付数据1: clusterEventMessage = test3添付数据2: clusterEventID = 200添付数据3: clusterEventDateTime = 2011/08/01 09:00:00添付数据4: clusterEventServerName = server1添付数据5: clusterEventModuleName = logcmd
- 3
消息中含有记号时的注意事项如下。
需要用""括起来的记号
# & ' ( ) ~ | ; : * < > , .(例 在消息中指定"#"时,输出#。)需要在前面加\的记号
\ ! " & ' ( ) ~ | ; : * < > , .(例 在消息中指定\\时,输出\。)需要用""括起来,且前面需要加上\的记号
`(例 在消息中指定"\ `"时,输出`。)
消息中含有空格时,需要用""括起来。
消息中不能使用%。
2.13. 控制监视资源 (clpmonctrl 命令)
控制监视资源。
-
命令行 - clpmonctrl -s [-m resource_name] [-w wait_time]clpmonctrl -r [-m resource_name] [-w wait_time]clpmonctrl -c [-m resource_name]clpmonctrl -v [-m resource_name]clpmonctrl -e -m resource_nameclpmonctrl -n [-m resource_name]
-
说明 暂停/重新启动监视资源。
-
选项 -
-s¶ 暂停监视。
-
-r¶ 重新启动监视。
-
-c¶ 复位复原操作次数的计数器。
-
-v¶ 显示复原操作次数的计数器。
-
-e¶ 将障碍验证功能设为有效。请务必使用-m选项指定监视资源名。
-
-n¶ 将障碍验证功能设为无效。请务必使用-m选项指定监视资源名,此时只有该资源属于对象。省略-m选项时,所有监视资源属于对象。
-
-mresource_name¶ - 指定要控制的监视资源。可省略。省略时对所有监视资源进行控制。
-
-wwait_time¶ - 以监视资源为单位等待监视控制。(秒)可省略。省略时的默认值是5秒。
-
-
返回值 0
正常结束
1
执行权限非法
2
选项非法
3
初始化错误
4
配置信息非法
5
监视资源未登录
6
指定监视资源非法
10
EXPRESSCLUSTER未启动状态
11
EXPRESSCLUSTER Daemon挂起状态
90
监视控制等待超时
128
二重启动
255
其它内部错误
-
执行示列 例1: 暂停所有的监视资源时
# clpmonctrl -s
Command succeeded.
例2: 重新启动所有的监视资源时
# clpmonctrl -r
Command succeeded.
-
备注 对已经暂停的监视资源进行暂停或者对已经启动的监视资源进行重新启动操作时,本命令异常结束,监视资源状态不变化。
-
注意事项 - 请以拥有root权限的用户身份执行该命令。监视资源的状态通过状态显示命令或Cluster WebUI确认。请通过clpstat命令或Cluster WebUI确认监视资源的状态处于"已启动"或"暂停"后执行。监视资源的恢复动作设置为如下内容时,通过-v选项显示的"FinalAction Count"显示"最终动作前脚本"的执行次数。
最终动作前执行脚本: 有效
最终动作: "不操作"
-
错误消息 消息
原因/处理
Command succeeded.
命令成功。
Log in as root.
无执行命令的权限。请使用有root权限的用户执行。
Initialization error. Check if memory or OS resources are sufficient.
可执行是内存不足或OS资源不足。请确认。
Invalid cluster configuration data. Check the cluster configuration information.
集群配置信息无效。请使用Cluster WebUI确认集群配置信息。
Monitor resource is not registered.
监视资源未被登录。
Specified monitor resource is not registered. Check the cluster configuration information.指定的监视资源未被登录。请使用Cluster WebUI确认集群配置信息。The cluster has been stopped. Check the active status of the cluster daemon by using the command such as ps command.集群处于停止状态。请用ps命令等确认EXPRESSCLUSTER Daemon的启动状态。The cluster has been suspended. The cluster daemon has been suspended. Check activation status of the cluster daemon by using a command such as the ps command.
EXPRESSCLUSTER Daemon处于挂起状态。请用ps命令等确认EXPRESSCLUSTER Daemon的启动状态。
Waiting for synchronization of the cluster. The cluster is waiting for synchronization. Wait for a while and try again.集群处于同步等待状态。请在集群同步等待结束后再次执行。Monitor %1 was unregistered, ignored. The specified monitor resources %1 is not registered, but continue processing. Check the cluster configuration data.
有未登录到指定监视资源的监视资源,但可以忽略继续进行处理。请使用Cluster WebUI确认集群配置信息。%1:监视资源名Monitor %1 denied control permission, ignored. but continue processing.在指定的监视资源中存在无法控制的监视资源,请忽略,继续处理。%1:监视资源名This command is already run.
命令已经执行。请用ps 命令等确认执行状态。
Internal error. Check if memory or OS resources are sufficient.
可执行是内存不足或OS资源不足。请确认。
可指定-m选项的监视资源类型
diskw
✓
✓
✓
ipw
✓
✓
✓
miiw
✓
✓
✓
mtw
✓
✓
✓
pidw
✓
✓
✓
volmgrw
✓
✓
✓
userw
✓
✓
n/a
vmw
✓
✓
n/a
mrw
✓
✓
n/a
genw
✓
✓
✓
oraclew
✓
✓
✓
db2w
✓
✓
✓
psqlw
✓
✓
✓
mysqlw
✓
✓
✓
sybasew
✓
✓
✓
odbcw
✓
✓
✓
sqlserverw
✓
✓
✓
sambaw
✓
✓
✓
nfsw
✓
✓
✓
httpw
✓
✓
✓
ftpw
✓
✓
✓
smtpw
✓
✓
✓
pop3w
✓
✓
✓
imap4w
✓
✓
✓
tuxw
✓
✓
✓
wlsw
✓
✓
✓
wasw
✓
✓
✓
otxw
✓
✓
✓
jraw
✓
✓
✓
sraw
✓
✓
✓
psrw
✓
✓
✓
psw
✓
✓
✓
2.14. 控制组资源 (clprsc命令)
执行组资源的控制。
-
命令行 - clprsc -s resource_name [-f] [--apito timeout]clprsc -t resource_name [-f] [--apito timeout]
-
说明 启动/停止组资源。
-
选择 -
-s¶ 启动组资源。
-
-t¶ 停止组资源。
-
-f¶ - 启动组资源时,启动指定的组资源所依赖的所有的组资源。停止组资源时,停止依赖指定组资源的所有组资源。
-
--apito¶ - 以秒为单位指定等待EXPRESSCLUSTER Damon的停止,重启,挂起的时间(内部通信超时)。可指定1-9999的值。不指定[--apito]选项时,按照集群属性的内部通信超时所设置的值,进行等待。
-
-
返回值 0
正常终止
0以外
异常终止
-
执行示例 组资源构成
# clpstat
========== CLUSTER STATUS  ==========
Cluster : cluster
<server>
    server1     : Online
      lanhb1    : Normal
      lanhb2    : Normal
<group>
    ManagementGroup     : Online
      current   : server1
      ManagementIP      : Online
    failover1   : Online
      current   : server1
      exec1     : Online
<monitor>
    ipw1        : Normal
==================================
例1:停止组failover1的资源exec1时
# clprsc -t exec1
Command succeeded.

# clpstat

========== CLUSTER STATUS ==========
<省略>
<group>
ManagementGroup: Online
Current: server1
ManagementIP: Online
failover1: Online
current: server1
exec1: Offline
<省略>
例2:启动组failover1的资源exec1时
# clprsc -s exec1
Command succeeded.

# clpstat
========== CLUSTER STATUS ==========
<省略>
<group>
ManagementGroup: Online
Current: server1
ManagementIP: Online
failover1: Online
current: server1
exec1: Online
<省略>
-
注意事项 - 请使用有root权限的用户执行该命令。组资源的状态,请通过状态显示命令或者Cluster WebUI确认。
-
错误消息 消息
原因/处理方法
Log in as root.
请使用有root权限的用户执行。
Invalid cluster configuration data. Check the cluster configuration information.
集群配置信息不正确。请通过Cluster WebUI确认集群配置信息。
Invalid option.
请使用正确的选项。
Could not connect server. Check if the cluster service is active.
请确认EXPRESSCLUSTER的服务是否已经启动。
Invalid server status. Check if the cluster service is active.
请确认EXPRESSCLUSTER的服务是否已经启动。
Server is not active. Check if the cluster service is active.
请确认EXPRESSCLUSTER的服务是否已经启动。
Invalid server name. Specify a valid server name in the cluster.
请指定集群内的正确的服务器名。
Connection was lost. Check if there is a server where the cluster service is stopped in the cluster.
请确认集群内是否有EXPRESSCLUSTER服务停止的服务器。
Internal communication timeout has occurred in the cluster server. If it occurs frequently, set the longer timeout.EXPRESSCLUSTER的内部通讯发生超时。如果频繁出现,请将内部通讯超时延长。The group resource is busy. Try again later.
由于组资源正处于启动处理过程中,或停止处理过程中,请稍等片刻再执行。
An error occurred on group resource. Check the status of group resource.
请使用Cluster WebUI或clpstat命令确认组资源状态。
Could not start the group resource. Try it again after the other server is started, or after the Wait Synchronization time is timed out.
等待其他服务器启动,或等待启动等待超时,启动组资源。
No operable group resource exists in the server.
请确认请求的服务器中是否有可以处理的组资源。
The group resource has already been started on the local server.
请使用Cluster WebUI或clpstat命令确认组资源状态。
The group resource has already been started on the other server.
请使用Cluster WebUI或clpstat命令确认组资源状态。通过本地服务器启动组资源时,请停止组。The group resource has already been stopped.
请使用Cluster WebUI或clpstat命令确认组资源状态。
Failed to start group resource. Check the status of group resource.
请使用Cluster WebUI或clpstat命令确认组资源状态。
Failed to stop resource. Check the status of group resource.
请使用Cluster WebUI或clpstat命令确认组资源状态。
Depended resource is not offline. Check the status of resource.
由于所依赖的组资源状态不是停止,无法停止组资源。请停止依赖的组资源或者指定-f选项。
Depending resource is not online. Check the status of resource.
由于所依赖的组资源状态不是启动,无法启动组资源。请启动依赖的组资源或者指定-f选项。
Invalid group resource name. Specify a valid group resource name in the cluster.
组资源未登录。
Server is not in a condition to start resource or any critical monitor error is detected.请使用Cluster WebUI或clpstat命令确认组资源状态。在准备启动组资源的服务器上检测出排除列表中包含的监视异常。Internal error. Check if memory or OS resources are sufficient.
可执行是由于内存不足或OS资源不足。请确认。
2.15. CPU频率控制命令 (clpcpufreq 命令)
进行CPU频率控制。
-
命令行 - clpcpufreq --highclpcpufreq --lowclpcpufreq -iclpcpufreq -s
-
说明 通过CPU频率控制,控制节能模式的有效/无效。
-
选项 -
--high¶ 将CPU频率数设置到最大。
-
--low¶ 降低CPU频率数设置为节能模式。
-
-i¶ 对CPU频率的控制返回到由EXPRESSCLUSTER X SingleServerSafe 控制。
-
-s¶ 显示当前的设置状态。
performance 将CPU频率数设置到最大。
powersave 降低CPU频率数设置为节能模式。
-
-
返回值 0
正常结束
0以外
异常结束
-
备注 - CPU频率控制用驱动器没有被负载时会出错。如果在服务器属性的节能设置中没有选中[使用CPU频率控制功能],则执行本命令会出错。
-
注意事项 - 请以拥有root权限的用户身份执行该命令。使用CPU频率控制功能时,可以在BIOS设置中变更CPU频率,CPU通过OS电源管理功能支持频率控制,以及内核必须对应。
-
错误消息 消息
原因/处理方法
Log in as root.
请以拥有root权限的用户身份执行该命令。
This command is already run.
该命令已经被执行。
Invalid option.
请指定正确的选项。
Invalid mode.Check if --high or --low or -i or -s option is spedified.请确认--high, --low, -l, -s其中一个选项已经被指定。Failed to initialize the xml library.Check if memory or OS resources are sufficient.内存不足或者OS资源不足。请确认。Failed to load the configuration file.Check if memory or OS resources are sufficient.内存不足或者OS资源不足。请确认。Failed to load the all.pol file.Reinstall the RPM.请重新安装EXPRESSCLUSTER服务器RPM。Failed to load the cpufreq.pol file.Reinstall the RPM.请重新安装EXPRESSCLUSTER服务器RPM。Failed to get the install path.Reinstall the RPM.请重新安装EXPRESSCLUSTER服务器RPM。Failed to get the cpufreq path.Reinstall the RPM.请重新安装EXPRESSCLUSTER服务器RPM。Failed to initialize the apicl library.Reinstall the RPM.内存不足或者OS资源不足。请确认。Failed to change CPU frequency settings.Check the BIOS settings and the OS settings.Check if the cluster is started.Check if the setting is configured so that CPU frequencycontrol is used.请确认BIOS和OS的设置。请确认是否已启动EXPRESSCLUSTER服务。请确认是否设置为使用CPU频率控制功能。Failed to acquire CPU frequency settings.Check the BIOS settings and the OS settings.Check if the cluster is started.Check if the setting is configured so that CPU frequencycontrol is used.请确认BIOS和OS的设置。请确认是否已启动EXPRESSCLUSTER服务。请确认是否设置为使用CPU频率控制功能。Internal error. Check if memory or OS resources are sufficient.
内存不足或者OS资源不足。请确认。
2.16. 集群间的处理请求命令 (clptrnreq 命令)
向服务器请求执行处理。
-
命令行 clptrnreq -t request_code -h IP [-r resource_name] [-s script_file] [-w timeout]
-
说明 向运行EXPRESSCLUSTER X SingleServerSafe的其他服务器及通过EXPRESSCLUSTER X配置集群的其他服务器发送指定的处理执行请求。
-
选项 -
-trequest_code¶ - 指定执行处理的Request Code。可以指定以下的Request Code。GRP_FAILOVER 组失效切换EXEC_SCRIPT 脚本执行
-
-hIP¶ - 通过IP地址指定发出处理执行请求的服务器。可以指定多个,用逗号隔开。可以指定的IP地址最大数为32。在Request Code中指定组失效切换时,请指定集群内所有服务器的IP地址。
-
-rresource_name¶ - 在Request Code中指定GRP_FAILOVER时,指定作为处理请求对象的服务器所属的资源名。指定了GRP_FAILOVER时,不可省略-r。
-
-sscript_file¶ - 在Request Code中指定EXEC_SCRIPT时,指定执行的脚本(Shell script或可执行文件等)文件名。必须在-h指定的各个服务器的EXPRESSCLUSTER安装目录下的work\trnreq目录中预先做成脚本。指定了EXEC_SCRIPT时,不可以省略-s。
-
-wtimeout¶ - 命令的超时值以秒为单位指定。超时值最小可以指定为5秒。如果没有指定-w选项,则脚本固定等待30秒。
-
-
返回值 0
正常结束
0以外
异常结束
-
注意事项 请以拥有root权限的用户身份执行该命令。
-
执行示例 例1: 让拥有其他集群的exec1资源的组失效切换时
# clptrnreq -t GRP_FAILOVER -h 10.0.0.1,10.0.0.2 -r exec1
Command succeeded.
例2: 在IP地址10.0.0.1的服务器中执行脚本scrpit1.sh时
# clptrnreq -t EXEC_SCRIPT -h 10.0.0.1 -s script1.sh
Command Succeeded.
-
错误消息 消息
原因/处理方法
Log in as root.
请以拥有root权限的用户身份执行该命令。
Invalid option.
命令行选项不正确。请指定正确的选项。
Could not connect to the data transfer server.Check if the server has started up.请确认是否启动服务器。Could not connect to all data transfer server.Check if the server has started up.请确认是否启动集群内所有的服务器。Command timeout.
考虑OS负荷等原因。请确认。
All server are busy. Check if this command is already run.
可执行已经执行本命令。请确认。
GRP_FAILOVER %s : Group that specified resource(%s) belongs to is offline.
被指定的资源所属组因为处于停止状态,失效切换处理不能进行。
EXEC_SCRIPT %s : Specified script(%s) does not exist.
指定的脚本不存在。请确认。
EXEC_SCRIPT %s : Specified script(%s) does not executable.
指定的脚本不能执行。请确认是否具有执行权限。
%s %s : This server is not permitted to execute clptrnreq.
执行命令的服务器没有执行权限。请确认是否被登录到Cluster WebUI的连接限制IP一览表中。
GRP_FAILOVER %s : Specified resource(%s) is not exist.
指定的资源不存在。请确认。
%s %s : %s failed in execute..
执行指定的处理失败。
Internal error. Check if memory or OS resource is sufficient.
内存不足或者OS资源不足。请确认。
2.17. 请求集群服务器处理 (clprexec命令)
要求安装了EXPRESSCLUSTER的其他服务器处理执行。
-
命令行 - clprexec --failover [group_name] -h IP [-r resource_name] [-w timeout] [-p port_number] [-o logfile_path]clprexec --script script_file -h IP [-p port_number] [-w timeout] [-o logfile_path]clprexec --notice [mrw_name] -h IP[-k category[.keyword]] [-p port_number] [-w timeout] [-o logfile_path]clprexec --clear [mrw_name] -h IP [-k category[.keyword]] [-p port_number] [-w timeout] [-o logfile_path]
-
说明 是在原有clptrnreq命令中添加了外部监视向EXPRESSCLUSTER服务器发出处理请求等功能(出现异常通知)的命令。
-
选项 -
--failover¶ 执行组失效切换请求。请在group_name中指定组名。
省略组名时,请使用-r选项指定组所属资源名。
-
--scriptscript_name¶ 请求执行脚本。
在scirpt_name中指定要执行脚本(shell脚本及可执行文件等)的文件名。
需事先在以-h指定的各服务器上的EXPRESSCLUSTER安装目录下的work/rexec子目录下创建脚本。
-
--notice¶ 向EXPRESSCLUSTER服务器发送异常发生通知。
请在mrw_name中指定消息接收监视资源名。
省略监视资源名时,请使用-k选项指定消息接收监视资源的监视类型,监视对象。
-
--clear¶ 请求将消息接收监视资源的状态从"异常"更改为"正常"。
请在mrw_name中指定消息接收监视资源名。
省略监视资源名时,请使用-k选项指定消息接收监视资源的监视类型,监视对象。
-
-hIP Address¶ 请指定发出处理请求的EXPRESSCLUSTER服务器的IP地址。
通过使用逗号隔开可指定多个IP地址,最多可指定32个IP地址。
※ 如省略本选项,则处理请求发行目标变成自身服务器。
-
-rresource_name¶ 指定—failover选项时,指定成为处理请求对象的组所属的资源名。
-
-kcategory[.keyword]¶ 指定—notice或—clear选项时,请在category中指定消息接收监视资源上设置的category。
指定消息接收监视资源的关键字时,请使用逗号在catergory的后面进行指定。
-
-pport_number¶ 指定端口号。
请在port_number中指定处理请求发行目标服务器中设置的数据传送端口号。
省略本选项时,使用缺省29002。
-
-ologfile_path¶ 在logfile_path指定输出本命令详细日志的文件路径。
文件中会保存1次命令的日志。
※ 未安装EXPRESSCLUSTER的服务器不指定本选项时,则只变成标准输出。
-
-wtimeout¶ 指定命令的超时时间。不指定时,为缺省30秒。
最大可指定为5~MAXINT。
-
-
返回值 0
正常结束
0以外
异常结束
-
注意事项 使用[clprexec]命令发行异常发生通知时,需预先登录/启动EXPRESSCLUSTER服务器中已设置的想要执行的异常时动作的消息接受监视资源。
拥有以-h选项指定的IP地址的服务器需满足以下条件。=安装有EXPRESSCLUSTER X3.0以上版本= EXPRESSCLUSTER已启动( 除--script 选项以外时)=已设置/启动mrw( --notice, --clear 选项时)[根据客户端IP地址限制连接]有效时,要追加执行[clprexec]命令设备的IP地址。
[根据客户端IP地址限制连接]的详细信息,请参考《设置指南》的"其他设置的详细信息" - "集群属性" - "WebManager标签页"。
-
实行示例 例1: 向EXPRESSCLUSTER服务器1(10.0.0.1)发行组failover1的失效切换请求时
# clprexec --failover failover1 -h 10.0.0.1 -p 29002
例2: 向EXPRESSCLUSTER服务器1(10.0.0.1)发行组资源(exec1)所在组的失效切换请求时
# clprexec --failover -r exec1 -h 10.0.0.1
例3: 向EXPRESSCLUSTER服务器1(10.0.0.1)发行脚本(script1.sh)执行请求时
# clprexec --script script1.sh -h 10.0.0.1
例4: 向EXPRESSCLUSTER服务器1(10.0.0.1)发行异常发生通知
※ mrw1设置 监视类型:earthquake,监视对象:scale3
指定消息接收监视资源名时
# clprexec --notice mrw1 -h 10.0.0.1 -w 30 -p /tmp/clprexec/ lprexec.log
指定消息接收监视资源中设置的监视类型和监视对象时
# clprexec --notice -h 10.0.0.1 -k earthquake.scale3 -w 30 -p /tmp/clprexec/clprexec.log
例5: 向EXPRESSCLUSTER服务器1(10.0.0.1)发行mrw1的监视状态更改请求
※ mrw1设置 监视类型:earthquake,监视对象:scale3
指定消息接收监视资源名时
# clprexec --clear mrw1 -h 10.0.0.1
指定消息接收监视资源中设置的监视类型和监视对象时
# clprexec --clear -h 10.0.0.1 -k earthquake.scale3
-
错误消息 消息
原因/处理方法
rexec_ver:%s
-
%s %s : %s succeeded.
-
%s %s : %s will be executed from now.
请通过请求发行目标的服务器确认处理结果。
%s %s : Group Failover did not execute because Group(%s) is offline.
-
%s %s : Group migration did not execute because Group(%s) is offline.
-
Invalid option.
请确认命令的参数。
Could not connect to the data transfer servers. Check if the servers have started up.
请确认指定IP地址是否正确或拥有IP地址的服务器是否已启动。
Command timeout.
请确认拥有指定IP地址的服务器是否已完成处理。
All servers are busy.Check if this command is already run.
可执行已经执行本命令。请确认。
%s %s : This server is not permitted to execute clprexec.
请确认执行命令的服务器的IP地址是否已注册到限制Cluster WebUI连接的客户端IP地址列表中。
%s %s : Specified monitor resource(%s) does not exist.
请确认命令的参数。
%s failed in execute.
请确认发行请求的目标EXPRESSCLUSTER服务器的状态。
2.18. BMC信息变更命令 (clpbmccnf 命令)
变更BMC用户名/密码信息。
-
命令行 clpbmccnf [-u username] [-p password]
-
说明 变更EXPRESSCLUSTER使用的基板管理控制器(BMC)的用于访问LAN的用户名/密码。
-
选项 -
-uusername¶ - 指定EXPRESSCLUSTER使用的BMC LAN访问用的用户名。必须指定拥有root权限的用户名。-u选项可以省略。省略时如果指定-p选项,用户名为当前设置的值。如果没有指定选项,则以对话形式设置。
-
-ppassword¶ 指定EXPRESSCLUSTER使用的BMC LAN访问用的密码。-p选项可以省略。省略时如果-u选项被指定,则密码为当前设置的值。如果没有指定选项,则以对话形式设置。
-
-
返回值 0
正常结束
0以外
异常结束
-
注意事项 - 请以拥有root权限的用户身份执行该命令。请在服务器正常状态下执行本命令。通过本命令进行BMC信息的更新,在下一次集群启动时/复原时设为有效。命令不是变更BMC的设置。要进行BMC账户设置的确认/变更,请使用服务器自带的工具或者以IPMI规格为基准的其他工具。
-
执行示例 server1的BMC的IPMI账户密码变更为mypassword时,在server1上执行下述命令。
# clpbmccnf -p mypassword
此外,以如下的对话形式输入。
# clpbmccnf
New user name: <- If there is no change, press Return to skip
New password: **************
Retype new password: **************
Cluster configuration updated successfully.
-
错误消息 消息
原因/处理方法
Log in as root.
请以拥有root权限的用户身份执行该命令。
Invalid option.
命令行选项不正确。请指定正确的选项。
Failed to download the cluster configuration data. Check if the cluster status is normal.
下载集群配置信息失败。请确认集群状态是否正常。
Failed to upload the cluster configuration data. Check if the cluster status is normal.
上传集群配置信息失败。请确认集群状态是否正常。
Invalid configuration file. Create valid cluster configuration data.
集群配置信息不正确。请在Cluster WebUI中确认集群配置信息。
Internal error. Check if memory or OS resources are sufficient.
内存不足或者OS资源不足。请确认。
2.19. 重启次数控制命令 (clpregctrl 命令)
进行重启次数限制的控制。
-
命令行 - clpregctrl --getclpregctrl -gclpregctrl --clear -t type -r registryclpregctrl -c -t type -r registry
-
说明 在服务器上显示/初始化重启次数。
-
选项 -
-g,--get¶ 显示重启次数信息。
-
-c,--clear¶ 初始化重启次数。
-
-ttype¶ 指定要初始化重启次数的类型。可指定的类型是rc或rm。
-
-rregistry¶ 指定注册表名称。可指定的注册表名称是haltcount。
-
-
返回值 0
正常结束
1
执行权限无效
2
二重启动
3
选项无效
4
配置信息非法
10~17
内部错误
20~22
获取重启次数信息失败
90
内存定位失败
91
工作目录更改失败
-
执行示例 显示重启次数信息
# clpregctrl -g
******************************
-------------------------
type : rc
registry : haltcount
comment : halt count
kind : int
value : 0
default : 0
-------------------------
type : rm
registry : haltcount
comment : halt count
kind : int
value : 3
default : 0
******************************
Command succeeded.(code:0)
#
例1,2初始化重启次数。
例1: 因组资源异常而初始化重启次数时
# clpregctrl -c -t rc -r haltcount
Command succeeded.(code:0)
#
例2: 因监视资源异常而初始化重启次数时
# clpregctrl -c -t rm -r haltcount
Command succeeded.(code:0)
#
-
注意事项 请以拥有root权限的用户身份执行该命令。
-
错误消息 消息
原因/处理
Command succeeded.
命令成功。
Log in as root.
无执行命令的权限。请使用有root 权限的用户执行。
The command is already executed. Check the execution state by using the "ps" command or some other command.
命令已经执行。请用ps 命令等确认执行状态。
Invalid option.
选项无效。
Internal error. Check if memory or OS resources are sufficient.
可执行是内存不足或OS资源不足。请确认。
2.20. 资源使用量预测 (clpprer命令)
通过输入文件中记载的资源使用量数据的趋势,预测未来值,并将预测结果输出到文件。另外,也能够确认预测数据的阈值。
-
命令行 clpprer -i <inputfile> -o <outputfile> [-p <number>] [-t <number> [-l]]
-
说明 通过给出的资源使用量数据的趋势,预测未来值。
-
选项 -
-i<inputfile>¶ 指定要计算的未来值的资源数据。
-
-o<outputfile>¶ 指定输出预测结果的文件。
-
-p<number>¶ 指定预测数据数。不指定时,求得30条预测数据。
-
-t<number>¶ 指定与预测数据相比较的阈值。
-
-l¶ 仅在通过[-t]选项设置阈值时有效的选项。小于阈值时,判定为异常。
-
-
返回值 0
没有执行阈值判定,正常结束的情况。
1
发生异常的情况
2
输入数据经过阈值判定,判定为大于阈值的情况。
3
预测数据经过阈值判定,判定为大于阈值的情况。
4
阈值判定的结果,判定为小于阈值的情况。
5
分析目标数据数少于分析推荐数据数(120)的情况下,
输入数据经过阈值判定的结果,判定为大于阈值的情况。
6
分析目标数据数少于分析推荐数据数(120)的情况下,
预测数据经过阈值判定的结果,判定为大于阈值的情况。
7
分析目标数据数少于分析推荐数据数(120)的情况下,
经阈值判定的结果,判定为小于阈值的情况。
-
注意事項 - 仅在系统监视资源(System Resource Agent) 已登录权限的情况下,可以使用本命令。(注册License后需要在集群构成中配置系统监视资源。)在选项-i 中指定的资源数据文件最多为500条输入数据。预测资源使用量需要一定的输入数据数。但是,输入数据数过多时,会延长分析所需的处理时间,因此,推荐的输入数据数为120条左右。另外,在选项-p可指定的输出数据最多为500条。输入数据的时刻数据没有按升序排列时会发生不能执行正确预测的情况。输入文件,请按升序排列时刻数据。
-
输入文件 - 有关输入文件格式的说明。输入文件中关于取得预测结果所希望的资源使用量,请按照如下格式准备文件。输入文件为CSV格式,1条数据按照[日期时间,数值]的形式进行记载。另外,日期时间格式为YYYY/MM/DD hh:mm:ss。
文件例
2012/06/14 10:00:00,10.0
2012/06/14 10:01:00,10.5
2012/06/14 10:02:00,11.0
-
执行例 通过简单的预测未来值例进行说明
在输入数据中检测异常
输入数据的最新值大于阈值的情况下,判定为异常并返回值2。输入数据数少于推荐值(=120)的情况下,返回值5。
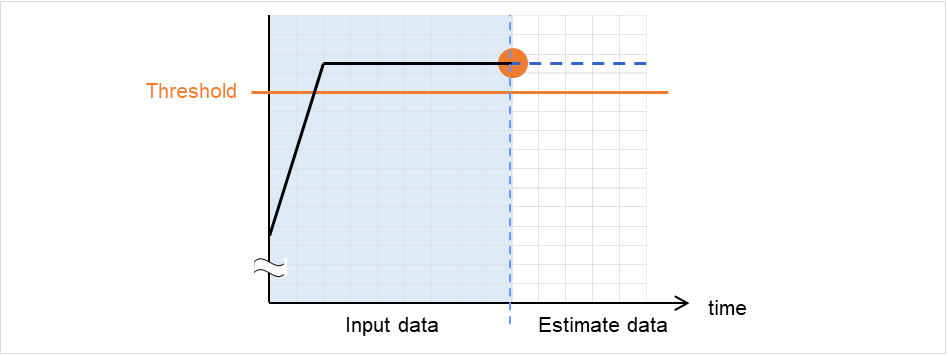
图 2.3 在输入数据中检测出异常
在预测数据中检测出异常
预测数据大于阈值的情况下,判定为异常并返回值3。输入数据数少于推荐值(=120)的情况下,返回值6。
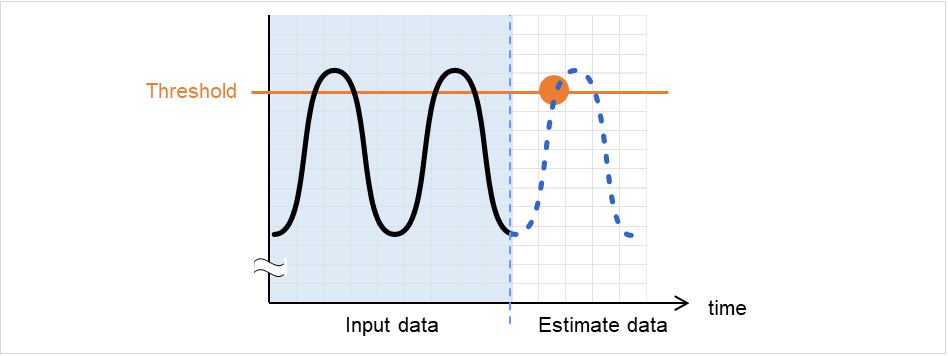
图 2.4 在预测数据中检测出异常
没有检测出阈值异常
输入数据,预测数据均小于阈值的情况下,返回值4。输入数据数少于推荐值(=120)的情况下,返回值7。
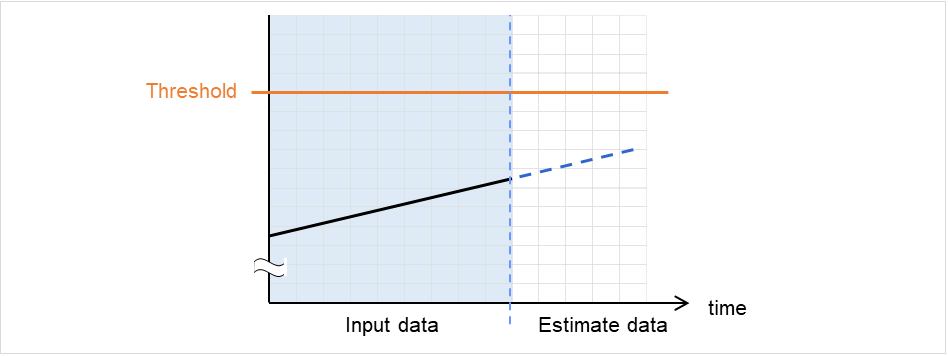
图 2.5 没有检测出阈值异常
使用-l选项的情况下
使用-l选项的情况下,低于阈值时,判定为异常。
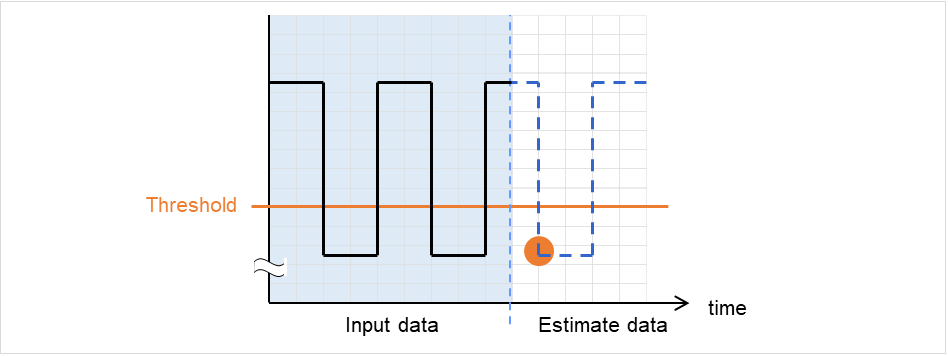
图 2.6 利用 -l 选项
-
执行示例 准备指定格式的文件,通过执行clpprer命令将预测结果作为输出文件来确认。
输入文件 test.csv
2012/06/14 10:00:00,10.0
2012/06/14 10:01:00,10.5
2012/06/14 10:02:00,11.0
# clpprer -i test.csv -o result.csv
输出结果 result.csv
2012/06/14 10:03:00,11.5
2012/06/14 10:04:00,12.0
2012/06/14 10:05:00,12.5
2012/06/14 10:06:00,13.0
2012/06/14 10:07:00,13.5
    :
另外,通过在选项中设置阈值能够在命令提示符上确认预测值的阈值判定结果。
# clpprer -i test.csv -o result.csv -t 12.5
执行结果
Detect over threshold. datetime = 2012/06/14 10:06:00, data = 13.00, threshold = 12.5
-
错误消息 消息
原因/处理方法
Normal state.
经过阈值判定的结果,没有大于阈值的数据。
Detect over threshold. datetime = %s, data = %s, threshold = %s
经过阈值判定的结果,检测出大于阈值的数据。
Detect under threshold. datetime = %s, data = %s, threshold = %s
通过-l选项的阈值判定结果,检测出小于阈值的数据。
License is nothing.
没有登录有效的System Resrouce Agent权限。请确认权限。
Inputfile is none.
指定的输入数据文件不存在。
Inputfile length error.
指定的输入数据文件路径过长。请指定在1023字节以下。
Output directory does not exist.
在输出文件指定的目录不存在。请确认指定的目录是否存在。
Outputfile length error.
指定的输出文件路径过长。请指定在1023字节以下。
Invalid number of -p.
指定-p选项的值不正确。
Invalid number of -t.
指定-t选项的值不正确。
Not analyze under threshold(not set -t).
没有指定-t选项。使用-l选项时,请指定-t选项。
File open error [%s]. errno = %s
打开文件失败。认为内存不足或OS资源不足。请确认。
Inputfile is invalid. cols = %s
输入数据不正确。请将输入数据设定在2条以上。
Inputfile is invalid. rows = %s
输入数据的格式不正确。每行必须为2列。
Invalid date format. [expected YYYY/MM/DD HH:MM:SS]
输入数据的日期格式不正确。请确认数据。
Invalid date format. Not sorted in ascending order.
输入数据没有按升序排列。请确认数据。
File read error.
输入数据设定错误值。请确认数据。
Too large number of data [%s]. Max number of data is %s.
输入数据数大于最大值 (500)。请减少数据数。
Input number of data is smaller than recommendable number.输入数据数少于分析推荐数据数(120)。※即使分析推荐数据很少的情况下,也进行分析。Internal error.
发生内部错误。
2.21. 确认进程的健全性 (clphealthchk 命令)
确认进程的健全性。
-
命令行 clphealthchk [ -t pm | -t rc | -t rm | -t nm | -h]
注解
本命令在单一服务器上确认进程的健全性。请在要确认健全性的服务器上执行。
-
说明 确认单一服务器上的进程健全性。
-
选项 -
无¶ 确认pm/rc/rm/nm的健全性。
-
-t<process>¶ process
- pm
确认pm的健全性。
- rc
确认rc的健全性。
- rm
确认rm的健全性。
- nm
确认nm的健全性。
-
-h¶ 显示Usage。
-
-
返回值
0 |
正常结束 |
1 |
执行权限非法 |
2 |
二重启动 |
3 |
初始化错误 |
4 |
选项无效 |
10 |
进程失控监视功能未设置 |
11 |
集群未启动状态(包含集群启动处理中,集群停止处理中) |
12 |
集群挂起状态 |
100 |
存在一定时间内没有更新健全性信息的进程 -t选项指定时,指定进程的健全性信息一定时间内未更新 |
255 |
其它内部错误 |
-
执行示例 例1:健全时
# clphealthchk
pm OK
rc OK
rm OK
nm OK
例2:clprc失控时
# clphealthchk
pm OK
rc NG
rm OK
nm OK

# clphealthchk -t rc
rc NG
例3:集群停止时
# clphealthchk
The cluster has been stopped
-
备注 集群停止或挂起时进程是停止的。
-
注意事项 请以拥有root权限的用户身份执行该命令。
-
错误消息 消息
原因/处理方法
Log in as root.
无执行命令的权限。请用有root权限的用户执行。
Initialization error. Check if memory or OS resources are sufficient.
可执行是内存不足或OS资源不足。请确认。
Invalid option.
请指定正确的选项。
The function of process stall monitor is disabled.
进程失控监视功能无效。
The cluster has been stopped.
集群处于停止状态。
The cluster has been suspended.
集群处于挂起状态。
This command is already run.
命令已经执行。请用ps 命令等确认执行状态。
Internal error. Check if memory or OS resources are sufficient.
可执行是内存不足或OS资源不足。请确认。
2.22. 显示集群统计信息(clpperfc 命令)
显示集群统计信息。
-
命令行 - clpperfc --starttime -g group_nameclpperfc --stoptime -g group_nameclpperfc -g [group_name]clpperfc -m monitor_name
-
说明 显示组的启动,停止时间的中位数(毫秒)。
显示监视资源的监视处理时间(毫秒)。
-
选项 -
--starttime-g group_name¶ 显示组的启动时间的中位数。
-
--stoptime-g group_name¶ 显示组的停止时间的中位数。
-
-g[group_name]¶ 显示组的启动,停止时间的中位数。
省略groupname时,显示所有组的启动,停止时间的中位数。
-
-mmonitor_name¶ 显示最近的监视资源的监视处理时间。
-
-
返回值 0
正常结束
1
命令选项不正确
2
用户认证错误
3
加载配置信息错误
4
加载配置信息错误
5
初始化错误
6
内部错误
7
内部通信初始化错误
8
内部通信连接错误
9
内部通信处理错误
10
对象组检查错误
12
超时错误
-
执行示例 (显示组的启动时间的中位数时) # clpperfc --starttime -g failover1 200
-
执行示例 (显示特定组的启动,停止时间的中位数时) # clpperfc -g failover1 start time stop time failover1 200 150
-
执行示例 (显示监视资源的监视处理时间时) # clpperfc -m monitor1 100
-
备注 本命令输出的时间单位为毫秒。
无法取得有效的组的启动时间,停止时间时,显示 - 。
无法取得有效的监视资源的监视时间时,显示0。
-
注意事项 请有root权限的用户执行本命令。
-
错误消息 消息
原因/处理办法
Log in as root.
请以拥有root权限的用户身份执行该命令。
Invalid option.
命令选项不正确。请确认命令选项。
Command timeout.
命令执行超时。
Internal error.
内存不足或者OS资源不足。请确认。
2.23. 检查集群配置信息 (clpcfchk 命令)
检查集群配置信息。
-
命令行 - clpcfchk -o path [-i conf_path]
-
说明 根据集群配置信息,确认设定值的妥当性。
-
返回值 0
正常结束
0以外
异常结束
-
执行示例 (检查已反映的配置信息时) # clpcfchk -o /tmp server1 : PASS
-
执行示例 (检查已保存的配置信息时) # clpcfchk -o /tmp -i /tmp/config server1 : PASS
-
执行结果 在本命令的结果中显示的检查结果(综合结果)如下所示。
检查结果(综合结果)
说明
PASS
没有问题。
FAIL
存在问题。请确认检查结果。
-
备注 仅显示各服务器的综合结果。
-
注意事项 请有root权限的用户执行本命令。
要使用Cluster WebUI 检查导出的配置信息时,请事先对其进行解压缩。
-
错误消息 消息
原因/处理方法
Log in as root.
请有root权限的用户执行本命令。
Invalid option.
请指定正确的选项。
Could not opened the configuration file. Check if the configuration file exists on the specified path.
指定的路径不存在。请指定正确的路径。
Server is busy. Check if this command is already run.
本命令已启动。
Failed to obtain properties.
获取属性失败。
Failed to check validation.
检查集群配置失败。
Internal error. Check if memory or OS resources are sufficient.
内存不足或者OS资源不足。请确认。
3. 注意限制事项
本章将说明注意事项,现有问题及其避免方法。
本章中介绍的内容如下。
3.1. 操作EXPRESSCLUSTER X SingleServerSafe后
请注意集群操作开始后的现象。
3.1.1. 关于驱动程序加载时的消息
加载clpka驱动程序时,如下消息有时显示在控制台和syslog上,此现象不属于异常。
kernel: clpka: no version for "struct_module" found: kernel tainted.
kernel: clpka: module license 'unspecified' taints kernel.
3.1.2. 关于ipmi的消息
在用户空间监视资源中使用IPMI时,将向syslog输出许多下述kernel模块警告日志。
modprobe: modprobe: Can't locate module char-major-10-173
要避免该日志的输出,请重命名/dev/ipmikcs。
3.1.3. 恢复运行中的操作限制
使用查出监视资源异常时的设置,为恢复对象指定组资源(磁盘资源,EXEC资源......),请不要在查出监视资源异常,正在恢复运行时(重新启动 -> 最终运行),控制如下命令或者来源于Cluster WebUI的集群和组。
服务器的停止/挂起
组的开始 / 停止
如果在监视资源异常,正在恢复运行时执行上述控制,该组的其他组资源可执行不会停止。然而,监视资源异常时,如果执行了最终运行,则可以进行上述的控制。
3.1.4. 关于命令参考里没有记载的可执行文件和脚本文件
安装目录下存在命令篇中未被记载的执行形式的文件及脚本文件。但是,请不要在EXPRESSCLUSTER X SingleServerSafe以外执行。
不支持执行后的影响。
3.1.5. 收集日志时的消息
执行日志收集时,控制台上可执行显示下列消息,不属于异常。日志被正常收集。
hd#: bad special flag: 0x03
ip_tables: (C) 2000-2002 Netfilter core team
(在hd#内有存在于服务器IDE的设备名)
kernel: Warning: /proc/ide/hd?/settings interface is obsolete, and will be removed soon!
3.1.6. 关于服务启动/停止用脚本
init.d环境中,在下列情况下,服务器启动/停止脚本中输出错误。systemd环境中不输出错误。
- Express Cluster Server 安装后立刻(SUSE Linux时)关闭OS时下列服务停止脚本中输出错误。由于出错原因为各服务尚未启动,因此没有问题。
clusterpro_alertsync
clusterpro_webmgr
clusterpro
clusterpro_api
clusterpro_ib
clusterpro_trn
clusterpro_evt
- 手动停止服务后关闭OS(SUSE Linux时)用clpcl命令或从Cluster WebUI停止服务后,关闭OS时所停止服务的停止脚本中输出错误。由于是服务停止引起的错误,因此没有问题。
clusterpro
下列情况下,服务的停止脚本执行的顺序有误。
- 执行chkconfig --del name 将所有服务设置为无效后关闭OSEXPRESSCLUSTER的服务设置为无效后关闭OS时,EXPRESSCLUSTER的服务由于顺序错误而停止。这是由于关闭OS时失效的EXPRESSCLUSTER服务没有被停止所造成的。从Cluster WebUI执行的集群关闭或使用clpstdn命令等EXPRESSCLUSTER命令关闭集群时,即使由于错误顺序造成服务停止也没有问题。
3.1.7. 关于systemd环境中的服务状态确认
systemd环境中,通过systemctl命令显示服务状态时,可执行与集群实际的状态不一致。
请使用clpstat命令,Cluster WebUI确认集群状态。
3.1.8. 关于在EXEC资源中使用的脚本文件
在EXEC资源中使用的脚本文件保存于各服务器的以下路径中。
/安装路径/scripts/组名/EXEC资源名/
更改配置时进行以下更改的情况下,更改前的脚本文件不会从服务器上删除。
删除EXEC资源时或更改EXEC资源名时
EXEC资源所在的组被删除或组名被更改时
若不需要更改前的脚本文件时,可以删除。
3.1.9. 关于启动时监视设置的监视资源
启动时监视设置的监视资源的暂停/继续有以下限制事项。
- 暂停监视资源后,停止监视对象资源时监视资源处于停止状态。所以不能再次打开监视。
暂停监视资源后,停止/启动监视对象资源时,监视对象资源启动时机,因监视资源不同而不同。
3.1.10. 关于Cluster WebUI
如果在与连接目标无法通信的状态下进行操作,则等待控制返回可执行会花费些许时间。
经由Proxy服务器时请对Proxy服务器进行设置,以便可以中转Cluster WebUI的端口号。
- 经由Reverse Proxy服务器时,Cluster WebUI不能正常运行。对EXPRESSCLUSTER X SingleServerSafe进行升级后,请关闭所有运行中的Web浏览器。清空浏览器的缓存后再重启浏览器。
使用比本产品更新的版本创建的集群配置信息,不能在本产品中使用。
- 结束Web浏览器后(窗口边框中的[X]等),可执行会弹出确认对话框。
 若要保存当前配置,请选择[留在此页]。
 - 刷新Web浏览器(菜单中的[刷新]及工具条上的[刷新]等)后,可执行会弹出确认对话框。
 若要保存当前配置,请选择[留在此页]。
 有关上述以外的 Cluster WebUI 注意限制事项请参考在线版手册。
3.1.11. 关于系统监视资源,进程资源监视资源
变更设置内容时,需要进行集群的挂起。
不支持监视资源的延迟警报。
- SELinux 请设置为 permissive 或 disabled 。如果设为enforcinfg ,则可执行无法用EXPRESSCLUSTER 进行必要的通信。
集群正在运行时更改了OS的日期或时间的情况,由于每隔10分钟进行一次解析处理,所以在最初的1回可执行会出现延迟。从而会导致以下的情况的发生,请根据需求对集群进行挂起集群和恢复集群操作。
已经过了异常检出所要时间而无法检测出异常。
在异常检出所要时间之前就已经检测出异常
系统监视资源的磁盘资源监视功能可以同时监视的最大磁盘数为64台。
3.1.12. 关于JVM监视资源
重启监视对象的Java VM的情况,需要挂起集群或者停止集群后在进行重启。
变更设置内容时,需要进行集群的挂起。
不支持监视资源的延迟警报。
JVM监视资源登录后从Cluster WebUI上进行语言(集群属性->信息标签页->语言)变更的情况,(例:日语->简体中文),请先删除JVM监视资源后再次追加JVM监视资源。
3.1.13. 关于HTTP监视资源
HTTP监视资源使用了以下其中的一个OpenSSL 的共享库的符号链接。
libssl.so
libssl.so.1.1 (OpenSSL 1.1.1的共享库)
libssl.so.10 (OpenSSL 1.0的共享库)
libssl.so.6 (OpenSSL 0.9的共享库)
根据OS的发布,版本以及软件包的安装状况,上述的符号链接可执行不存在。HTTP监视资源找不到上述的符号链接时会发生以下错误。Detected an error in monitoring<Module Resource Name>. (1 :Can not found library. (libpath=libssl.so, errno=2))
因此,发生上述错误时,请确认/usr/lib或者/usr/lib64等目录下是否存在上诉的符号链接。另外,上述的符号链接不存在时,请像下面的命令例那样做成libssl.so符号链接。命令例:
cd /usr/lib64 # Move to /usr/lib64.
ln -s libssl.so.1.0.1e libssl.so # 符号链接作成
4. 错误消息一览表
本章介绍EXPRESSCLUSTER X SingleServerSafe运行中显示的错误消息一览表。
本章包含以下内容。
4.1. syslog,警报,邮件通告消息,SNMP Trap消息,Message Topic
EXPRESSCLUSTER X SingleServerSafe 的消息如下所示。
注解
通过facility = daemon(0x00000018), identity = "clusterpro"在syslog中输出。下表的"事件分类"相当于syslog的日志级别。
下表中使用的记号如下所示。
[1]alert, [2]syslog, [3]Mail Report, [4]SNMP Trap, [5]Message Topic
模块类型 |
事件分类 |
事件ID |
消息 |
描述 |
处理方法 |
1 |
2 |
3 |
4 |
5 |
|---|---|---|---|---|---|---|---|---|---|---|
sss |
错误 |
8 |
Failed to update config file. |
配置文件的更新失败。 |
请确认配置信息。 |
● |
● |
|||
sss |
信息 |
10 |
Updated config file successfully. |
配置文件已被更新。 |
- |
● |
||||
sss |
错误 |
12 |
Information in config file is invalid. |
配置文件内容不正确。 |
请确认配置信息。 |
● |
||||
sss |
错误 |
14 |
Failed to obtain server name. |
服务器获取失败。 |
可执行是内存不足或OS资源不足。请确认。 |
● |
||||
sss |
信息 |
16 |
Server name is updated. |
服务器名已被更新。 |
- |
● |
● |
|||
pm |
信息 |
1 |
Starting the cluster daemon... |
EXPRESSCLUSTER Daemon已正常启动。 |
- |
● |
● |
|||
pm |
信息 |
2 |
Shutting down the cluster daemon... |
正在停止EXPRESSCLUSTER Daemon。 |
- |
● |
● |
|||
pm |
信息 |
3 |
Shutdown monitoring is started... |
关机监视已经启动。 |
- |
● |
● |
|||
pm |
错误 |
10 |
The cluster daemon has already started. |
EXPRESSCLUSTER Daemon已经启动。 |
请确认EXPRESSCLUSTER Daemon的状态。 |
● |
● |
|||
pm |
错误 |
11 |
A critical error occurred in the cluster daemon. |
EXPRESSCLUSTER Daemon上发生重大错误。 |
执行用户没有root权限,或内存不足或OS的资源不足。请确认。 |
● |
● |
● |
● |
● |
pm |
错误 |
12 |
A problem was detected in XML library. |
查出XML库的问题。 |
可执行是内存不足或OS资源不足。请确认。 |
● |
● |
|||
pm |
错误 |
13 |
A problem was detected in cluster configuration data. |
查出配置信息中的问题。 |
请使用Cluster WebUI确认配置信息。 |
● |
● |
● |
● |
● |
pm |
错误 |
14 |
No cluster configuration data is found. |
配置信息不存在。 |
请使用Cluster WebUI创建服务器配置,并将其上载到服务器上。 |
● |
● |
|||
pm |
错误 |
15 |
No information about this server is found in the cluster configuration data. |
自身服务器上不存在配置信息。 |
请使用Cluster WebUI确认配置信息。 |
● |
● |
|||
pm |
错误 |
20 |
Process %1 was terminated abnormally. |
%1进程异常结束。 |
可执行是内存不足或OS资源不足。请确认。 即使nm进程异常结束,也不会影响业务,但是无法执行集群停止操作。 要复原,请使用Cluster WebUI或clpdown命令重新启动OS。 |
● |
● |
● |
● |
● |
pm |
错误 |
21 |
The system will be stopped because the cluster daemon process terminated abnormally. |
EXPRESSCLUSTER Daemon的进程异常结束,因此将停止系统。 |
可执行是组资源的停止失败。请按照组资源的消息提示处理。 |
● |
● |
|||
pm |
错误 |
22 |
An error occurred when initializing process %1.(return code:%2) |
%1进程的初始化错误。 |
可执行是事件进程尚未启动。 |
● |
● |
● |
● |
● |
pm |
信息 |
23 |
The system will be stopped. |
将停止系统。 |
- |
● |
● |
|||
pm |
信息 |
24 |
The cluster daemon will be stopped. |
将停止EXPRESSCLUSTER Daemon。 |
- |
● |
● |
|||
pm |
信息 |
25 |
The system will be rebooted. |
将重启系统。 |
- |
● |
● |
|||
pm |
信息 |
26 |
Process %1 will be restarted. |
将重启%1进程。 |
- |
● |
● |
|||
pm |
信息 |
30 |
Received a request to stop the system from %1. |
从%1收到了停止系统的请求。 |
- |
● |
● |
|||
pm |
信息 |
31 |
Received a request to stop the cluster daemon from %1. |
从%1收到了停止EXPRESSCLUSTER Daemon的请求。 |
- |
● |
● |
|||
pm |
信息 |
32 |
Received a request to reboot the system from %1. |
从%1收到了系统重启的请求。 |
- |
● |
● |
|||
pm |
信息 |
33 |
Received a request to restart the cluster daemon from %1. |
从%1收到了重启EXPRESSCLUSTER Daemon重启的请求。 |
- |
● |
● |
|||
pm |
信息 |
34 |
Received a request to resume the cluster daemon from %1. |
从%1收到了复原服务器的请求。 |
- |
● |
● |
|||
pm |
信息 |
35 |
Received a request to suspend the cluster daemon from %1. |
从%1收到了挂起服务器的请求。 |
- |
● |
● |
|||
pm |
信息 |
36 |
Received a request to panic by sysrq from %1. |
从%1收到了由sysrq引发的panic请求。 |
- |
● |
● |
|||
pm |
信息 |
37 |
Received a request to reset by keepalive driver from %1. |
从%1收到了由keepalive驱动引发的reset请求。 |
- |
● |
● |
|||
pm |
信息 |
38 |
Received a request to panic by keepalive driver from %1. |
从%1收到了由keepalive驱动引发的panic请求。 |
- |
● |
● |
|||
pm |
信息 |
39 |
Received a request to reset by BMC from %1. |
从%1收到了由BMC引发的reset请求。 |
- |
● |
● |
|||
pm |
信息 |
40 |
Received a request to power down by BMC from %1. |
从%1收到了由BMC引发的power down请求。 |
- |
● |
● |
|||
pm |
信息 |
41 |
Received a request to power cycle by BMC from %1. |
从%1收到了由BMC引发的power cycle请求。 |
- |
● |
● |
|||
pm |
信息 |
42 |
Received a request to send NMI by BMC from %1. |
从%1收到了由BMC引发的发送NMI请求。 |
- |
● |
● |
|||
pm |
错误 |
66 |
An attempt to panic by sysrq from %1 failed. |
尝试从%1由sysrq引发panic,但失败了。 |
请确认系统能否使用sysrq。 |
● |
● |
|||
pm |
错误 |
67 |
An attempt to reset by keepalive driver from %1 failed. |
尝试从%1由keepalive驱动引发reset,但失败了。 |
请确认环境能否使用keepalive驱动。 |
● |
● |
|||
pm |
错误 |
68 |
An attempt to panic by keepalive driver from %1 failed. |
尝试从%1由keepalive驱动引发panic,但失败了。 |
请确认环境能否使用keepalive驱动。 |
● |
● |
|||
pm |
错误 |
69 |
An attempt to reset by BMC from %1 failed. |
尝试从%1由BMC引发reset,但失败了。 |
请确认能否使用ipmitool命令。 |
● |
● |
|||
pm |
错误 |
70 |
An attempt to power down by BMC from %1 failed. |
尝试从%1由BMC引发power down,但失败了。 |
请确认能否使用ipmitool命令。 |
● |
● |
|||
pm |
错误 |
71 |
An attempt to power cycle by BMC from %1 failed. |
尝试从%1由BMC引发power cycle,但失败了。 |
请确认能否使用ipmitool命令。 |
● |
● |
|||
pm |
错误 |
72 |
An attempt to send NMI by BMC from %1 failed. |
尝试从%1由BMC引发发送NMI,但失败了。 |
请确认能否使用ipmitool命令。 |
● |
● |
|||
nm |
信息 |
1 |
Server %1 has started. |
服务器%1已经启动。 |
- |
● |
● |
|||
nm |
信息 |
2 |
Server %1 has been stopped. |
服务器%1已经停止。 |
- |
● |
● |
● |
● |
● |
nm |
信息 |
3 |
Resource %1 of server %2 has started. |
服务器%2的%1资源已经启动。 |
- |
● |
● |
|||
nm |
信息 |
4 |
Resource %1 of server %2 has stopped. |
服务器%2的%1资源已经停止。 |
- |
● |
● |
|||
nm |
信息 |
5 |
Waiting for all servers to start. |
等待服务器启动。 |
- |
● |
● |
|||
nm |
信息 |
6 |
All servers have started. |
服务器已启动。 |
- |
● |
● |
|||
nm |
信息 |
7 |
Timeout occurred during the wait for startup of all servers. |
等待所有服务器启动超时。 |
- |
● |
● |
|||
nm |
错误 |
8 |
Timeout occurred during the wait for startup of all servers. (Cannot communicate with some servers.) |
等待所有服务器启动超时。(与某些服务器不能进行内部通信。) |
请确认网络适配器中是否有错误,网络连接是否正确。 |
● |
● |
|||
nm |
信息 |
9 |
Waiting for startup of all servers has been canceled. |
已取消服务器启动等待。 |
- |
● |
● |
|||
nm |
错误 |
10 |
Status of resource %1 of server %2 is unknown. |
服务器%2的%1 资源的状态不明。 |
请确认%1资源相关的线缆或网络设置是否正确。 |
● |
● |
● |
● |
● |
nm |
警告 |
11 |
NP resolution process at the cluster startup is disabled. |
禁用集群启动时的网络分区解决处理。 |
禁用集群启动时的网络分区解决处理。 |
● |
● |
|||
nm |
错误 |
20 |
Process %1 was terminated abnormally. |
%1进程异常结束。 |
可执行是内存不足或OS资源不足。请确认。 |
● |
● |
● |
● |
● |
nm |
信息 |
21 |
The system will be stopped. |
系统将停止。 |
- |
● |
● |
|||
nm |
信息 |
22 |
The cluster daemon will be stopped. |
EXPRESSCLUSTER Daemon将停止。 |
- |
● |
● |
|||
nm |
信息 |
23 |
The system will be rebooted. |
系统将重启。 |
- |
● |
● |
|||
nm |
信息 |
24 |
Process %1 will be restarted. |
%1进程将重启。 |
- |
● |
● |
|||
nm |
错误 |
30 |
Network partition was detected. Shut down the server %1 to protect data. |
查出网络分区。为了保护数据关闭了服务器%1。 |
所有心跳资源将无法使用。请确认网络适配器中是否有错误,网络连接是否正确。使用DISKHB时,请确认共享磁盘的状态。
使用COMHB时,请确认COM线缆连接是否正确。
|
● |
● |
|||
nm |
错误 |
31 |
An error occurred while confirming the network partition. Shut down the server %1. |
在确认网络分区时发生错误。为了保护数据关闭了服务器%1。 |
请确认在网络分区解决资源中是否发生了错误。 |
● |
● |
|||
nm |
错误 |
32 |
Shut down the server %1. (reason:%2) |
关闭了服务器%1。(原因:%2) |
所有心跳资源将无法使用。请确认网络适配器中是否有错误,网络连接是否正确。
使用DISKHB时,请确认共享磁盘的状态。
使用COMHB时,请确认COM线缆连接是否正确。
|
● |
● |
|||
nm |
错误 |
33 |
Cluster service will be stopped. (reason:%1) |
停止了服务。(原因:%1) |
请排除原因所示的故障。 |
● |
● |
|||
nm |
错误 |
34 |
The combination of the network partition resources is invalid. (server name:%1) |
网络分区解决资源的组合不正确(服务器名:%1) |
请确认配置信息。 |
● |
● |
|||
nm |
错误 |
35 |
Failed to start the resource %1. Server name:%2 |
资源%1启动失败。(服务器名:%2) |
请确认在网络分区解决资源中是否发生了错误。 |
● |
● |
|||
nm |
信息 |
36 |
The network partition %1 of the server %2 has been recovered to the normal status. |
服务器%2的网络分区%1复原正常。 |
- |
● |
● |
|||
nm |
错误 |
37 |
The network partition %1 of the server %2 has an error. |
请确认在网络分区解决资源中是否发生了错误。 |
● |
● |
||||
nm |
错误 |
38 |
The resource %1 of the server %2 is unknown. |
请确认配置信息。 |
● |
● |
||||
nm |
信息 |
39 |
The server %1 canceled the pending failover. |
- |
● |
● |
||||
nm |
错误 |
80 |
Cannot communicate with server %1. |
与服务器%1不能进行内部通信。 |
请确认网络适配器中是否有错误,或者网络连接是否正确。 |
● |
● |
|||
nm |
信息 |
81 |
Recovered from internal communication error with server %1. |
与服务器%1的内部通信从异常状态复原。 |
- |
● |
● |
|||
rc |
信息 |
10 |
Activating group %1 has started. |
开始了%1组的启动处理。 |
- |
● |
● |
|||
rc |
信息 |
11 |
Activating group %1 has completed. |
%1组的启动处理已结束。 |
- |
● |
● |
|||
rc |
错误 |
12 |
Activating group %1 has failed. |
%1组的启动处理失败。 |
请按照组资源的消息提示处理。 |
● |
● |
|||
rc |
信息 |
15 |
Waiting for group %1 to start has started. |
已开始组的启动等待处理。 |
- |
● |
● |
|||
rc |
信息 |
16 |
Waiting for group %1 to start has been completed. |
组的启动等待处理正常完成。 |
- |
● |
● |
|||
rc |
错误 |
17 |
Group start has been canceled because waiting for group %1 to start has timed out |
在组的启动等待处理中发生了超时 |
请确认启动等待目标组的状态。
组未启动时,请在启动组后再次执行组操作。
|
● |
● |
|||
rc |
警告 |
18 |
Waiting for group %1 to start has timed out. However, group start continues. |
在组的启动等待处理中,虽发生了超时,但仍继续启动组。 |
- |
● |
● |
|||
rc |
信息 |
20 |
Stopping group %1 has started. |
开始了%1组的停止处理。 |
- |
● |
● |
|||
rc |
信息 |
21 |
Stopping group %1 has completed. |
%1组的停止处理已结束。 |
- |
● |
● |
|||
rc |
错误 |
22 |
Stopping group %1 has failed. |
%1组的停止处理失败。 |
请按照组资源的消息提示处理。 |
● |
● |
|||
rc |
错误 |
23 |
Server %1 is not in a condition to start group %2. |
服务器%1未处于能启动组%2的状态。 |
已启动完全排他组的服务器不能再启动完全排他组。请停止完全排他组之后再执行。 |
● |
● |
|||
rc |
信息 |
25 |
Waiting for group %1 to stop has started. |
开始了组的停止等待处理。 |
- |
● |
● |
|||
rc |
信息 |
26 |
Waiting for group %1 to stop has been completed. |
所依存组的停止等待处理正常完成。 |
- |
● |
● |
|||
rc |
错误 |
27 |
Group stop has been canceled because waiting for group %1 to stop has timed out. |
在组的停止等待处理中发生了超时。 |
请确认停止等待目标组的状态。
组未停止时,请在停止组后再次执行组操作。
|
● |
● |
|||
rc |
警告 |
28 |
Waiting for group %1 to stop has timed out. However, group stop continues. |
在停止等待处理中,虽发生了超时,但仍继续停止组。 |
- |
|||||
rc |
信息 |
30 |
Activating %1 resource has started. |
开始了%1资源的启动处理。 |
- |
● |
||||
rc |
信息 |
31 |
Activating %1 resource has completed. |
%1资源的启动处理已结束。 |
- |
● |
||||
rc |
错误 |
32 |
Activating %1 resource has failed.(%2 : %3) |
%1资源的启动处理失败。 |
请参考"组资源启动/停止时的详细信息"。
在启动的时候有1%的资源输出状态失败。(99:命令提示 超时)
|
● |
● |
● |
● |
● |
rc |
信息 |
40 |
Stopping %1 resource has started. |
开始了%1资源的停止处理。 |
- |
● |
||||
rc |
信息 |
41 |
Stopping %1 resource has completed. |
%1资源的停止处理已结束。 |
- |
● |
||||
rc |
错误 |
42 |
Stopping %1 resource has failed.(%2 : %3) |
%1资源的停止处理失败。 |
请参考"组资源启动/停止时的详细信息"。
在作停止动作的时候,1%的资源会输出现停止失败状态(99:注释超时)
|
● |
● |
● |
● |
● |
rc |
信息 |
50 |
Moving group %1 has started. |
开始了%1组的移动处理。 |
- |
● |
● |
|||
rc |
信息 |
51 |
Moving group %1 has completed. |
%1组的移动处理已结束。 |
- |
● |
● |
|||
rc |
错误 |
52 |
Moving group %1 has failed. |
%1组的移动处理失败。 |
请按照组资源的消息提示处理。 |
● |
● |
|||
rc |
信息 |
55 |
Migrating group %1 has started. |
开始了%1 组的移动处理。 |
- |
● |
● |
|||
rc |
信息 |
56 |
Migrating group %1 has completed. |
结束了%1 组的移动处理。 |
- |
● |
● |
|||
rc |
错误 |
57 |
Migrating group %1 has failed. |
%1 组的移动处理失败。 |
请按组资源的提示进行处理。 |
● |
● |
|||
rc |
错误 |
58 |
Server %1 is not in a condition to migrate group %2. |
服务器%1未处于能移动组%2的状态。 |
请确认移动目标服务器的状态。
移动目标服务器不存在时,%1服务器名不能被输出。
|
|||||
rc |
信息 |
60 |
Failover group %1 has started. |
开始了%1组的失效切换处理。 |
- |
● |
● |
|||
rc |
信息 |
61 |
Failover group %1 has completed. |
%1组的失效切换处理已结束。 |
- |
● |
● |
|||
rc |
错误 |
62 |
Failover group %1 has failed. |
%1组的失效切换处理失败。 |
请按照组资源的消息提示处理。 |
● |
● |
|||
rc |
错误 |
63 |
Server %1 is not in a condition to move group %2. |
服务器%1未处于能移动组%2的状态。 |
请确认移动目标服务器的状态。
移动目标服务器不存在时%1服务器名不能被输出。
|
● |
● |
|||
rc |
情報 |
64 |
Server %1 has been set as the destination for the group %2 (reason: %3). |
服务器%1被设置为组%2的失效切换目标。(理由: %3) |
- |
● |
● |
|||
rc |
错误 |
65 |
There is no appropriate destination for the group %1 (reason: %2). |
组%1没有恰当的失效切换目标(理由: %2) |
没有可失效切换的服务器。
服务器可执行已经停止,或发生了无法执行失效切换的监视资源异常。
请启动服务器,或排除监视资源异常的原因,也可以停止查出异常的监视资源。
|
● |
● |
|||
rc |
警告 |
66 |
Server %1 is not in a condition to start group %2 (reason: %3). |
服务器%1处于不能启动组%2的状态(理由: %2) |
发生监视资源异常导致组无法启动。
请排除监视资源异常的原因,也可以停止查出异常的监视资源。
|
● |
● |
|||
rc |
信息 |
67 |
Server %1 in the same server group (%2) has been set as the destination for the group %3. |
相同服务器组%2内的服务器%1被设置为组%3的失效切换目标。 |
- |
● |
● |
|||
rc |
信息 |
68 |
Server %1 not in the same server group (%2) has been set as the destination for the group %3. |
非服务器组%2中的服务器%1被设置为组%3的失效切换目标。 |
- |
● |
● |
|||
rc |
警告 |
69 |
Can not failover the group %1 because there is no appropriate destination in the same server group %2. |
服务器组%2中不存在可对组%1进行失效切换的服务器。 |
请启动服务器组内的服务器,然后在其他服务器组内的服务器中启动组。 |
● |
● |
|||
rc |
信息 |
70 |
Restarting group %1 has started. |
开始了%1组的重启处理。 |
- |
● |
● |
|||
rc |
信息 |
71 |
Restarting group %1 has completed. |
%1组的重启处理已结束。 |
- |
● |
● |
|||
rc |
错误 |
72 |
Restarting group %1 has failed. |
%1组的重启处理失败。 |
请按照组资源的消息提示处理。 |
● |
● |
|||
rc |
信息 |
74 |
Failback group %s has started. |
开始了%1组的失效切换处理。 |
- |
● |
● |
|||
rc |
信息 |
75 |
Failback group %s has completed. |
%1组的失效切换处理已结束。 |
- |
● |
● |
|||
rc |
信息 |
76 |
Failback group %s has failed. |
%1组的失效切换处理失败。 |
请按照组资源的消息提示处理。 |
● |
● |
|||
rc |
信息 |
80 |
Restarting resource %1 has started. |
开始了%1资源的重启处理。 |
- |
● |
● |
|||
rc |
信息 |
81 |
Restarting resource %1 has completed. |
%1资源的重启处理已结束。 |
- |
● |
● |
|||
rc |
错误 |
82 |
Restarting resource %1 has failed. |
%1资源的重启处理失败。 |
请按照组资源的消息提示处理。 |
● |
● |
|||
rc |
信息 |
83 |
Starting a single resource %1. |
启动单个资源%1。 |
- |
● |
● |
|||
rc |
信息 |
84 |
A single resource %1 has been started. |
启动单个资源%1结束。 |
- |
● |
● |
|||
rc |
错误 |
85 |
Failed to start a single resource %1. |
启动单个资源%1失败。 |
请按照组资源的消息提示处理。 |
● |
● |
|||
rc |
错误 |
86 |
Server %1 is not in a condition to start a single resource %2. |
服务器%1未处于能启动单个资源%2的状态。 |
请确认服务器及组的状态。 |
● |
● |
|||
rc |
信息 |
87 |
Stopping a single resource %1. |
停止单个资源%1。 |
- |
● |
● |
|||
rc |
信息 |
88 |
A single resource %1 has been stopped. |
停止单个资源%1结束。 |
- |
● |
● |
|||
rc |
错误 |
89 |
Failed to stop a single resource %1. |
停止单个资源%1失败。 |
请按照组资源的消息提示处理。 |
● |
● |
|||
rc |
信息 |
90 |
All the servers in the cluster were shut down. |
服务器已停止。 |
- |
● |
● |
|||
rc |
信息 |
91 |
The server was shut down. |
服务器已停止。 |
- |
● |
● |
|||
rc |
警告 |
100 |
Restart count exceeded the maximum value %1. Final action of resource %2 will not be executed. |
重启次数超过了最大值%1。资源%2 的最终动作无法执行。 |
请按照组资源的消息提示处理。 |
● |
● |
|||
rc |
信息 |
121 |
The CPU frequency has been set to high. |
设置CPU频率级别为最高。 |
- |
● |
● |
|||
rc |
信息 |
122 |
The CPU frequency has been set to low. |
设置CPU频率级别为最低。 |
- |
● |
● |
|||
rc |
信息 |
124 |
CPU frequency setting has been switched to automatic control by cluster. |
通过服务器切换CPU频率设置为自动控制。 |
- |
● |
● |
|||
rc |
错误 |
140 |
CPU frequency control cannot be used. |
CPU频率控制功能不能使用。 |
请确认BIOS的设置和kernel的设置。 |
● |
● |
|||
rc |
错误 |
141 |
Failed to set the CPU frequency to high. |
不能设置CPU频率级别为最高。 |
请确认BIOS设置和kernel设置。
确认expressCluster是否启动。
请确认是否设置为使用CPU频率控制功能。
|
● |
● |
|||
rc |
错误 |
142 |
Failed to set the CPU frequency to low. |
不能设置CPU频率级别为最低。 |
同上 |
● |
● |
|||
rc |
错误 |
144 |
Failed to switch the CPU frequency setting to automatic control by cluster. |
不能通过服务器切换CPU频率设置为自动控制。 |
请确认EXPRESSCLUSTER是否启动。
请确认是否设置为使用CPU频率控制功能。
|
● |
● |
|||
rc |
信息 |
160 |
Script before final action upon deactivation failure in resource %1 started. |
开始资源(%1)的停止异常时最终动作前脚本。 |
- |
● |
● |
|||
rc |
信息 |
161 |
Script before final action upon deactivation failure in resource %1 completed. |
结束资源(%1)的停止异常时最终动作前脚本。 |
- |
● |
● |
|||
rc |
信息 |
162 |
Script before final action upon deactivation failure in resource %1 started. |
开始资源(%1)的停止异常时最终动作前脚本。 |
- |
● |
● |
|||
rc |
信息 |
163 |
Script before final action upon deactivation failure in resource %1 completed. |
结束资源(%1)的停止异常时最终动作前脚本。 |
- |
● |
● |
|||
rc |
错误 |
180 |
Script before final action upon activation failure in resource %1 failed. |
资源(%1)的启动异常时最终动作前脚本失败。 |
请确认脚本失败原因,进行对应处理。 |
● |
● |
|||
rc |
错误 |
181 |
Script before final action upon deactivation failure in resource %1 failed. |
资源(%1)的停止异常时最终动作前脚本失败。 |
同上 |
● |
● |
|||
rc |
信息 |
200 |
Resource(%1) will be reactivated since activating resource(%2) failed. |
由于资源%1的启动处理失败造成将重新启动资源%2。 |
请按照组资源的消息提示处理。 |
● |
● |
|||
rc |
信息 |
201 |
Group(%1) will be moved to server(%2) since activating resource(%3) failed. |
由于资源%3的启动处理失败,新组 %1将移动到服务器%2。 |
请按照组资源的消息提示处理。 |
● |
● |
|||
rc |
信息 |
202 |
Group(%1) will be stopped since activating resource(%2) failed. |
由于资源%2的启动处理失败造成组%1将停止。 |
请按照组资源的消息提示处理。 |
● |
● |
|||
rc |
信息 |
203 |
Cluster daemon will be stopped since activating resource(%1) failed. |
由于资源%1的启动处理失败造成集群Daemon将停止。 |
请按照组资源的消息提示处理。 |
● |
● |
|||
rc |
信息 |
204 |
System will be halted since activating resource(%1) failed. |
由于资源%1的启动处理失败造成OS将关闭。 |
请按照组资源的消息提示处理。 |
● |
● |
|||
rc |
信息 |
205 |
System will be rebooted since activating resource(%1) failed. |
由于资源%1的启动处理失败造成OS将重启。 |
请按照组资源的消息提示处理。 |
● |
● |
|||
rc |
信息 |
206 |
Activating group(%1) will be continued since failover process failed. |
由于失效切换失败,将继续进行组 %1的启动处理。 |
请按照组资源的消息提示处理。 |
● |
● |
|||
rc |
信息 |
220 |
Resource(%1) will be stopping again since stopping resource(%2) failed. |
由于资源%2的停止处理失败造成将重试资源%1的停止。 |
请按照组资源的消息提示处理。 |
● |
● |
|||
rc |
信息 |
222 |
Group(%1) will be stopped since stopping resource(%2) failed. |
由于资源%2的停止处理失败造成组%1将停止。 |
请按照组资源的消息提示处理。 |
● |
● |
|||
rc |
信息 |
223 |
Cluster daemon will be stopped since stopping resource(%1) failed. |
由于资源%1的停止处理失败造成集群Daemon将停止。 |
请按照组资源的消息提示处理。 |
● |
● |
|||
rc |
信息 |
224 |
System will be halted since stopping resource(%1) failed. |
由于资源%1的停止处理失败造成 OS 将停止。 |
请按照组资源的消息提示处理。 |
● |
● |
|||
rc |
信息 |
225 |
System will be rebooted since stopping resource(%1) failed. |
由于资源%1的停止处理失败造成 OS 将重启。 |
请按照组资源的消息提示处理。 |
● |
● |
|||
rc |
信息 |
240 |
System panic by sysrq is requested since activating resource(%1) failed. |
由于资源%1的启动异常,sysrq引发了系统panic请求。 |
请按照组资源的消息提示处理。 |
● |
● |
|||
rc |
信息 |
241 |
System reset by keepalive driver is requested since activating resource(%1) failed. |
由于资源%1的启动异常,keepalive驱动引发了系统reset请求。 |
请按照组资源的消息提示处理。 |
● |
● |
|||
rc |
信息 |
242 |
System panic by keepalive driver is requested since activating resource(%1) failed. |
由于资源%1的启动异常,keepalive驱动引发了系统panic请求。 |
请按照组资源的消息提示处理。 |
● |
● |
|||
rc |
信息 |
243 |
System reset by BMC is requested since activating resource(%1) failed. |
由于资源%1的启动异常,BMC引发了系统reset请求。 |
请按照组资源的消息提示处理。 |
● |
● |
|||
rc |
信息 |
244 |
System power down by BMC is requested since activating resource(%1) failed. |
由于资源%1的启动异常,BMC引发了系统power down请求。 |
请按照组资源的消息提示处理。 |
● |
● |
|||
rc |
信息 |
245 |
System power cycle by BMC is requested since activating resource(%1) failed. |
由于资源%1的启动异常,BMC引发了系统power cycle请求。 |
请按照组资源的消息提示处理。 |
● |
● |
|||
rc |
信息 |
246 |
NMI send by BMC is requested since activating resource(%1) failed. |
由于资源%1的启动异常,BMC引发了发送NMI请求。 |
请按照组资源的消息提示处理。 |
● |
● |
|||
rc |
错误 |
260 |
An attempt to panic system by sysrq due to failure of resource(%1) activation failed. |
由于资源%1的启动异常,尝试由sysrq引发系统panic,但失败了。 |
请确认系统能否使用sysrq。 |
● |
● |
|||
rc |
错误 |
261 |
An attempt to reset system by keepalive driver due to failure of resource(%1) activation failed. |
由于资源%1的启动异常,尝试由keepalive驱动引发系统reset,但失败了。 |
请确认环境能否使用keepalive驱动。 |
● |
● |
|||
rc |
错误 |
262 |
An attempt to panic system by keepalive driver due to failure of resource(%1) activation failed. |
由于资源%1的启动异常,尝试由keepalive驱动引发系统panic,但失败了。 |
请确认环境能否使用keepalive驱动。 |
● |
● |
|||
rc |
错误 |
263 |
An attempt to reset system by BMC due to failure of resource(%1) activation failed. |
由于资源%1的启动异常,尝试由BMC引发系统reset,但失败了。 |
请确认能否使用ipmitool命令。 |
● |
● |
|||
rc |
错误 |
264 |
An attempt to power down system by BMC due to failure of resource(%1) activation failed. |
由于资源%1的启动异常,尝试由BMC引发系统power down,但失败了。 |
请确认能否使用ipmitool命令。 |
● |
● |
|||
rc |
错误 |
265 |
An attempt to power cycle system by BMC due to failure of resource(%1) activation failed. |
由于资源%1的启动异常,尝试由BMC引发系统power cycle,但失败了。 |
请确认能否使用ipmitool命令。 |
● |
● |
|||
rc |
错误 |
266 |
An attempt to send NMI by BMC due to failure of resource(%1) activation failed. |
由于资源%1的启动异常,尝试由BMC引发发送NMI,但失败了。 |
请确认能否使用ipmitool命令。 |
● |
● |
|||
rc |
信息 |
280 |
System panic by sysrq is requested since deactivating resource(%1) failed. |
由于资源%1的停止异常,由sysrq引发了系统panic请求。 |
请按照组资源的消息提示处理。 |
● |
● |
|||
rc |
信息 |
281 |
System reset by keepalive driver is requested since deactivating resource(%1) failed. |
由于资源%1的停止异常,由keepalive驱动引发了系统reset请求。 |
请按照组资源的消息提示处理。 |
● |
● |
|||
rc |
信息 |
282 |
System panic by keepalive driver is requested since deactivating resource(%1) failed. |
由于资源%1的停止异常,由keepalive驱动引发了系统panic请求。 |
请按照组资源的消息提示处理。 |
● |
● |
|||
rc |
信息 |
283 |
System reset by BMC is requested since deactivating resource(%1) failed. |
由于资源%1的停止异常,由BMC引发了系统reset请求。 |
请按照组资源的消息提示处理。 |
● |
● |
|||
rc |
信息 |
284 |
System power down by BMC is requested since deactivating resource(%1) failed. |
由于资源%1的停止异常,由BMC引发了系统power down请求。 |
请按照组资源的消息提示处理。 |
● |
● |
|||
rc |
信息 |
285 |
System power cycle by BMC is requested since deactivating resource(%1) failed. |
由于资源%1的停止异常,由BMC引发了系统power cycle请求。 |
请按照组资源的消息提示处理。 |
● |
● |
|||
rc |
信息 |
286 |
Sending NMI by BMC is requested since deactivating resource(%1) failed. |
由于资源%1的停止异常,由BMC引发了发送NMI请求。 |
请按照组资源的消息提示处理。 |
● |
● |
|||
rc |
错误 |
300 |
An attempt to panic system by sysrq due to failure of resource(%1) deactivation failed. |
由于资源%1的停止异常,尝试由sysrq引发系统panic,但失败了。 |
请确认系统能否使用sysrq。 |
● |
● |
|||
rc |
错误 |
301 |
An attempt to reset system by keepalive driver due to failure of resource(%1) deactivation failed. |
由于资源%1的停止异常,尝试由keepalive驱动引发系统reset,但失败了。 |
请确认环境能否使用keepalive驱动。 |
● |
● |
|||
rc |
错误 |
302 |
An attempt to panic system by keepalive driver due to failure of resource(%1) deactivation failed. |
由于资源%1的停止异常,尝试由keepalive驱动引发系统panic,但失败了。 |
请确认环境能否使用keepalive驱动。 |
● |
● |
|||
rc |
错误 |
303 |
An attempt to reset system by BMC due to failure of resource(%1) deactivation failed. |
由于资源%1的停止异常,尝试由BMC引发系统reset,但失败了。 |
请确认能否使用ipmitool命令。 |
● |
● |
|||
rc |
错误 |
304 |
An attempt to power down system by BMC due to failure of resource(%1) deactivation failed. |
由于资源%1的停止异常,尝试由BMC引发系统power down,但失败了。 |
请确认能否使用ipmitool命令。 |
● |
● |
|||
rc |
错误 |
305 |
An attempt to power cycle system by BMC due to failure of resource(%1) deactivation failed. |
由于资源%1的停止异常,尝试由BMC引发系统power cycle,但失败了。 |
请确认能否使用ipmitool命令。 |
● |
● |
|||
rc |
错误 |
306 |
An attempt to send NMI by BMC due to failure of resource(%1) deactivation failed. |
由于资源%1的停止异常,尝试由BMC引发发送NMI,但失败了。 |
请确认能否使用ipmitool命令。 |
● |
● |
|||
rc |
错误 |
340 |
Group start has been canceled because waiting for group %1 to start has failed. |
在组启动等待处理中发生了错误。 |
可执行是内存不足或
OS资源不足。请确
认。
|
● |
● |
|||
rc |
信息 |
400 |
System power down by BMC is requested. (destination server : %1) |
请求通过BMC进行系统power down。(对象服务器 : %1) |
- |
● |
● |
|||
rc |
信息 |
401 |
System power cycle by BMC is requested. (destination server : %1) |
请求通过BMC进行系统power cycle。(对象服务器 : %1) |
- |
● |
● |
|||
rc |
信息 |
402 |
System reset by BMC is requested. (destination server : %1) |
请求通过BMC进行系统重置。(对象服务器 : %1) |
- |
● |
● |
|||
rc |
信息 |
403 |
Sending NMI by BMC is requested. (destination server : %1) |
请求通过BMC发送NMI。(对象服务器 : %1) |
- |
● |
● |
|||
rc |
信息 |
410 |
Forced stop of virtual machine is requested. (destination server : %s) |
请求虚拟机的强制停止。(对象服务器 : %1) |
- |
● |
● |
|||
rc |
信息 |
411 |
Script for forced stop has started. |
强制停止脚本已经开始。 |
- |
● |
● |
|||
rc |
信息 |
412 |
Script for forced stop has completed. |
强制停止脚本已经结束。 |
- |
● |
● |
|||
rc |
错误 |
420 |
An attempt to power down system by BMC failed. (destination server : %1) |
请求通过BMC进行系统power down失败。(对象服务器 : %1) |
请确认ipmitool命令是否可以使用。 |
● |
● |
|||
rc |
错误 |
421 |
An attempt to power cycle system by BMC failed. (destination server : %1) |
请求通过BMC进行系统power cycle失败。(对象服务器 : %1) |
请确认ipmitool命令是否可以使用。 |
● |
● |
|||
rc |
错误 |
422 |
An attempt to reset system by BMC failed. (destination server : %1) |
请求通过BMC进行系统重置失败。(对象服务器 : %1) |
请确认ipmitool命令是否可以使用。 |
● |
● |
|||
rc |
错误 |
423 |
An attempt to send NMI by BMC failed. (destination server : %1) |
请求通过BMC发送NMI失败。(对象服务器 : %1) |
请确认ipmitool命令是否可以使用。 |
● |
● |
|||
rc |
错误 |
430 |
An attempt to force stop virtual machine failed. (destination server : %s) |
请求虚拟机的强制停止,但失败了。(对象服务器 : %1) |
请确认VMware vSphere CLI是否可以使用。 |
● |
● |
|||
rc |
错误 |
431 |
Script for forced stop has failed. (%1) |
强制停止脚本失败。(%1) |
请确认脚本失败的原因,进行对应处理。 |
● |
● |
|||
rc |
错误 |
432 |
Script for forced stop has timed out. |
强制停止脚本发生超时。 |
请确认脚本超时的原因,进行对应处理。 |
● |
● |
|||
rc |
警告 |
441 |
Waiting for group %1 to stop has failed. However, group stop continues. |
在组启动等待处理中发生了错误。 |
可执行是内存不足或
OS资源不足。请确
认。
|
● |
● |
|||
rc |
警告 |
500 |
Since there is no other normally running server, the final action for an activation error of group resource %1 was suppressed. |
因没有其他正常运行中的服务器,控制了组资源%1启动异常的最终动作。 |
- |
● |
● |
|||
rc |
警告 |
501 |
Since there is no other normally running server, the final action for a deactivation error of group resource %1 was suppressed. |
因没有其他正常运行中的服务器,控制了组资源%1停止异常的最终动作。 |
- |
● |
● |
|||
rc |
警告 |
510 |
Cluster action is disabled. |
集群动作无效。 |
- |
● |
● |
|||
rc |
警告 |
511 |
Ignored the automatic start of groups because automatic group startup is disabled. |
由于已禁用组的自动启动,因此组的自动启动被忽略。 |
- |
● |
● |
|||
rc |
警告 |
512 |
Ignored the recovery action in resource activation because recovery action caused by group resource activation error is disabled. |
由于已禁用组资源启动异常时的复归动作,因此资源的复归动作被忽略。 |
- |
● |
● |
|||
rc |
警告 |
513 |
Ignored the recovery action in resource deactivation because recovery action caused by group resource deactivation error is disabled. |
由于已禁用组资源停止异常时的复归动作,因此资源的复归动作被忽略。 |
- |
● |
● |
|||
rc |
信息 |
514 |
Cluster action is set disabled. |
集群动作无效。 |
- |
● |
● |
|||
rc |
信息 |
515 |
Cluster action is set enabled. |
集群动作有效。 |
- |
● |
● |
|||
rm |
信息 |
1 |
Monitoring %1 has started. |
开始了%1的监视。 |
- |
● |
● |
|||
rm |
信息 |
2 |
Monitoring %1 has stopped. |
%1的监视已停止。 |
- |
● |
● |
|||
rm |
信息 |
3 |
%1 is not monitored by this server. |
%1的监视在本服务器上不执行。 |
- |
● |
● |
|||
rm |
警告 |
4 |
Warn monitoring %1. (%2 : %3) |
警告%1的监视。 |
请参考"监视资源异常时的详细信息"。
监视资源处于监视准备中时,()内可执行设置为以下的消息。不需要处理此次消息。
(100 : not ready for monitoring.)
|
● |
● |
|||
rm |
警告 |
5 |
The maximum number of monitor resources has been exceeded. (registered resource is %1) |
超过了最大监视资源数。 |
请使用Cluster WebUI确认配置信息。 |
● |
● |
|||
rm |
警告 |
6 |
Monitor configuration of %1 is invalid. (%2 : %3) |
%1的监视配置无效。 |
请使用Cluster WebUI确认配置信息。 |
● |
● |
|||
rm |
错误 |
7 |
Failed to start monitoring %1. |
启动%1的监视失败。 |
可执行是内存不足或OS资源不足。请确认。 |
● |
● |
● |
● |
|
rm |
错误 |
8 |
Failed to stop monitoring %1. |
%1的监视的停止失败。 |
可执行是内存不足或OS资源不足。请确认。 |
● |
● |
|||
rm |
错误 |
9 |
Detected an error in monitoring %1. (%2 : %3) |
%1的监视中查出异常。 |
请参考"监视资源异常时的详细信息"。
查出监视超时时,()内将显示以下消息。
(99 : Monitor was timeout.)
如果在一定时间内没有接收到监视资源的响应,()内设置以下的消息。
(202: couldn't receive reply from monitor resource in time.)
|
● |
● |
● |
● |
|
rm |
信息 |
10 |
%1 is not monitored. |
未监视%1。 |
- |
● |
● |
|||
rm / mm |
信息 |
12 |
Recovery target %1 has stopped because an error was detected in monitoring %2. |
由于%2的监视中查出异常,复原目标 %1已被停止。 |
- |
● |
● |
|||
rm / mm |
信息 |
13 |
Recovery target %1 has restarted because an error was detected in monitoring %2. |
由于%2的监视中查出异常,复原目标 %1已被重启。 |
- |
● |
● |
|||
rm / mm |
信息 |
14 |
Recovery target %1 failed over because an error was detected in monitoring %2. |
由于%2的监视中查出异常,复原目标 %1已被失效切换。 |
- |
● |
● |
|||
rm / mm |
信息 |
15 |
Stopping the cluster has been required because an error was detected in monitoring %1. |
由于%1的监视中查出异常,请求停止集群。 |
- |
● |
● |
|||
rm / mm |
信息 |
16 |
Stopping the system has been required because an error was detected in monitoring %1. |
由于%1的监视中查出异常,请求停止系统。 |
- |
● |
● |
|||
rm / mm |
信息 |
17 |
Rebooting the system has been required because an error was detected in monitoring %1. |
由于%1的监视中查出异常,请求重启系统。 |
- |
● |
● |
|||
rm / mm |
错误 |
18 |
Attempted to stop the recovery target %1 due to the error detected in monitoring %2, but failed. |
由于%2的监视异常,试图停止复原目标%1,但是失败了。 |
请确认%1资源的状态。 |
● |
● |
|||
rm / mm |
错误 |
19 |
Attempted to restart the recovery target %1 due to the error detected in monitoring %2, but failed. |
由于%2的监视异常,试图重启复原目标%1但是失败了。 |
请确认%1资源的状态。 |
● |
● |
|||
rm / mm |
错误 |
20 |
Attempted to fail over %1 due to the error detected in monitoring %2, but failed. |
由于%2的监视异常,试图失效切换复原目标%1,但是失败了。 |
请确认%1资源的状态。 |
● |
● |
|||
rm / mm |
错误 |
21 |
Attempted to stop the cluster due to the error detected in monitoring %1, but failed. |
由于%1的监视异常,试图停止服务器,但是失败了。 |
可执行是内存不足或OS资源不足。请确认。 |
● |
● |
|||
rm / mm |
错误 |
22 |
Attempted to stop the system due to the error detected in monitoring %1, but failed. |
由于%1的监视异常,试图停止系统,但是失败了。 |
可执行是内存不足或OS资源不足。请确认。 |
● |
● |
|||
rm / mm |
错误 |
23 |
Attempted to reboot the system due to the error detected in monitoring %1, but failed. |
由于%1的监视异常,试图重启系统,但是失败了。 |
可执行是内存不足或OS资源不足。请确认。 |
● |
● |
|||
rm |
错误 |
24 |
The group of %1 resource is unknown. |
%1资源所属组不明。 |
可执行集群配置信息不一致。请确认。 |
● |
● |
|||
rm / mm |
警告 |
25 |
Recovery will not be executed since the recovery target %1 is not active. |
由于复原目标%1为停止,无法进行复原操作。 |
- |
● |
● |
|||
rm / mm |
信息 |
26 |
%1 status changed from error to normal. |
%1的监视已从异常复原为正常。 |
- |
● |
● |
|||
rm / mm |
信息 |
27 |
%1 status changed from error or normal to unknown. |
%1的监视从异常或正常变为不明状态。 |
可执行是内存不足或OS资源不足。请确认。 |
● |
● |
|||
rm |
错误 |
28 |
Initialization error of monitor process. (%1 : %2) |
监视进程的初始化错误。 |
可执行是内存不足或OS资源不足。请确认。 |
● |
● |
|||
rm |
信息 |
29 |
Monitoring %1 was suspended. |
暂时停止了%1的监视。 |
- |
● |
● |
|||
rm |
信息 |
30 |
Monitoring %1 was resumed. |
重新开始了%1的监视。 |
- |
● |
● |
|||
rm |
信息 |
31 |
All monitors were suspended. |
暂时停止所有监视。 |
- |
● |
● |
|||
rm |
信息 |
32 |
All monitors were resumed. |
重新开始了所有监视。 |
- |
● |
● |
|||
rm / mm |
信息 |
35 |
System panic by sysrq has been required because an error was detected in monitoring %1. |
由于在%1的监视中查出异常,sysrq引发了系统panic请求。 |
- |
● |
● |
|||
rm / mm |
错误 |
36 |
Attempted to panic system by sysrq due to the error detected in monitoring %1, but failed. |
由于%1的监视异常,尝试由sysrq引发系统panic,但失败了。 |
请确认系统能否使用sysrq。 |
● |
● |
|||
rm / mm |
信息 |
37 |
System reset by keepalive driver has been required because an error was detected in monitoring %1. |
由于在%1的监视中查出异常,由keepalive驱动引发了系统reset请求。 |
- |
● |
● |
|||
rm / mm |
错误 |
38 |
Attempted to reset system by keepalive driver due to the error detected in monitoring %1, but failed. |
由于%1的监视异常,尝试由keepalive驱动引发系统reset,但失败了。 |
请确认环境能否使用keepalive驱动。 |
● |
● |
|||
rm / mm |
信息 |
39 |
System panic by keepalive driver has been required because an error was detected in monitoring %1. |
由于在%1的监视中查出异常,由keepalive驱动引发了系统panic请求。 |
- |
● |
● |
|||
rm / mm |
错误 |
40 |
Attempted to panic system by keepalive driver due to the error detected in monitoring %1, but failed. |
由于%1的监视异常,尝试由keepalive驱动引发系统panic,但失败了。 |
请确认环境能否使用keepalive驱动。 |
● |
● |
|||
rm / mm |
信息 |
41 |
System reset by BMC has been required because an error was detected in monitoring %1. |
由于在%1的监视中查出异常,由BMC引发了系统reset请求。 |
- |
● |
● |
|||
rm / mm |
错误 |
42 |
Attempted to reset system by BMC due to the error detected in monitoring %1, but failed. |
由于%1的监视异常,尝试由BMC引发系统reset,但失败了。 |
请确认能否使用ipmitool命令。 |
● |
● |
|||
rm / mm |
信息 |
43 |
System power down by BMC has been required because an error was detected in monitoring %1. |
由于在%1的监视中查出异常,由BMC引发了系统power down请求。 |
- |
● |
● |
|||
rm / mm |
错误 |
44 |
Attempted to power down system by BMC due to the error detected in monitoring %1, but failed. |
由于%1的监视异常,尝试由BMC引发系统power down,但失败了。 |
请确认能否使用ipmitool命令。 |
● |
● |
|||
rm / mm |
信息 |
45 |
System power cycle by BMC has been required because an error was detected in monitoring %1. |
由于在%1的监视中查出异常,由BMC引发了系统power cycle请求。 |
- |
● |
● |
|||
rm / mm |
错误 |
46 |
Attempted to power cycle system by BMC due to the error detected in monitoring %1, but failed. |
由于%1的监视异常,尝试由BMC引发系统power cycle,但失败了。 |
请确认能否使用ipmitool命令。 |
● |
● |
|||
rm / mm |
信息 |
47 |
NMI send by BMC has been required because an error was detected in monitoring %1. |
由于在%1的监视中检出异常,由BMC引发了系统NMI请求。 |
- |
● |
● |
|||
rm / mm |
错误 |
48 |
Attempted to send NMI by BMC due to the error detected in monitoring %1, but failed. |
由于%1的监视异常,尝试由BMC引发系统的NMI,但失败了。 |
请确认能否使用ipmitool命令。 |
● |
● |
|||
rm |
信息 |
49 |
%1 status changed from warning to normal. |
%1的监视从警告状态恢复到正常。 |
- |
● |
● |
|||
rm |
错误 |
57 |
Stopping the cluster is required since license (%1) is invalid. |
由于License无效,请求停止集群。 |
请注册有效的
License。
|
● |
● |
● |
● |
|
rm |
错误 |
58 |
Stopping the cluster due to invalid license (%1) failed. |
由于License无效,无法停止集群。 |
请注册有效的
License。
|
● |
● |
|||
rm |
警告 |
71 |
Detected a monitor delay in monitoring %1. (timeout=%2*%3 actual-time=%4 delay warning rate=%5) |
%1的监视中查出监视延迟。当前的超时值为%2(秒) x %3(每秒的tick count)。查出延迟时的实测值为%4(tick count),超过了延迟警告比例 %5(%)。 |
请确认查出监视延迟的服务器的负载情况,并清除负载。
如果仍然查出监视超时,则需要延长监视超时时间。
|
● |
● |
|||
rm |
警告 |
72 |
%1 could not Monitoring. |
%1不能执行监视处理。 |
内存不足或者OS资源不足。请确认。 |
● |
● |
|||
rm / mm |
信息 |
81 |
Script before %1 upon failure in monitor resource %2 started. |
开始%2监视资源的%1前脚本。 |
- |
● |
● |
|||
rm / mm |
信息 |
82 |
Script before %1 upon failure in monitor resource %2 completed. |
结束%2监视资源的%1前脚本。 |
- |
● |
● |
|||
rm / mm |
错误 |
83 |
Script before %1 upon failure in monitor resource %2 failed. |
%2监视资源的%1前脚本失败。 |
请确认脚本失败原因,进行对应处理。 |
● |
● |
|||
rm |
警告 |
100 |
Restart count exceeded the maximum of %1. Final action of monitoring %2 will not be executed. |
由于再启动次数超过了最大值%1,%1的最终动作没有被执行。 |
- |
● |
● |
|||
rm |
信息 |
120 |
The virtual machine (%1) has been migrated to %2 by an external operation. |
%1资源管理的虚拟机通过外部操作被迁移。 |
- |
● |
● |
|||
rm |
信息 |
121 |
The virtual machine (%1) has been started by an external operation. |
%1资源管理的虚拟机通过外部操作被启动。 |
- |
● |
● |
|||
rm |
信息 |
130 |
The collecting of detailed information triggered by monitor resource %1 error has been started (timeout=%2). |
开始收集监视资源检测到$1监视异常时的详细信息。 |
- |
● |
● |
|||
rm |
信息 |
131 |
The collection of detailed information triggered by monitor resource %1 error has been completed. |
完成收集监视资源检测到$1收集监视异常查出时的详细信息。 |
- |
● |
● |
|||
rm |
警告 |
132 |
The collection of detailed information triggered by monitor resource %1 error has been failed (%2). |
收集监视资源检测到$1监视异常时的详细信息失败。 |
- |
● |
● |
|||
rm |
信息 |
140 |
Process %1 has started. |
启动了进程%1。 |
- |
● |
● |
|||
rm |
警告 |
141 |
Process %1 has restarted |
重启了进程%1。 |
- |
● |
● |
|||
rm |
警告 |
142 |
Process %1 does not exist. |
不存在进程%1。 |
- |
● |
● |
|||
rm |
错误 |
143 |
Process %1 was restarted %2 times, but terminated abnormally. |
虽%2次重启了进程%1,但异常结束。 |
内存不足或者OS资源不足。请确认。 |
● |
● |
|||
rm |
错误 |
150 |
The cluster is stopped since process %1 was terminated abnormally. |
因进程%1异常结束,停止集群。 |
内存不足或者OS资源不足。请确认。 |
● |
● |
|||
rm |
错误 |
151 |
The server is shut down since process %1 was terminated abnormally. |
因进程%1异常结束,关闭服务器。 |
内存不足或者OS资源不足。请确认。 |
● |
● |
|||
rm |
错误 |
152 |
The server is restarted since process %1 was terminated abnormally. |
因进程%1异常结束,重启服务器。 |
内存不足或者OS资源不足。请确认。 |
● |
● |
|||
rm |
错误 |
160 |
Monitor resource %1 cannot be controlled since the license is invalid. |
因License无效,无法控制监视资源%1。 |
请注册有效的License。 |
● |
● |
|||
rm |
信息 |
170 |
Recovery script has been executed since an error was detected in monitoring %1. |
在%1的监视中查出了异常,因此执行了复归脚本。 |
- |
● |
● |
|||
rm |
错误 |
171 |
An attempt was made to execute the recovery script due to a %1 monitoring failure, but failed. |
由于%1的监视异常实行了复归脚本,结果失败。 |
请确认复归脚本失败的原因,并采取对策。 |
● |
● |
|||
rm |
信息 |
180 |
Dummy Failure of monitor resource %1 is enabled. |
开始监视资源%1的模拟故障。 |
- |
● |
● |
|||
rm |
信息 |
181 |
Dummy Failure of monitor resource %1 is disabled. |
停止了监视资源%1的模拟故障。 |
- |
● |
● |
|||
rm |
信息 |
182 |
Dummy Failure of all monitor will be enabled. |
开始所有监视资源的模拟故障。 |
- |
● |
● |
|||
rm |
信息 |
183 |
Dummy Failure of all monitor will be disabled. |
停止监视资源%1的模拟故障。 |
- |
● |
● |
|||
rm |
警告 |
184 |
An attempt was made to enable Dummy Failure of monitor resource %1, but failed. |
开始监视资源%1的模拟故障失败。 |
请确认监视资源%1是否支持模拟故障功能。 |
● |
● |
|||
rm |
警告 |
185 |
An attempt was made to disable Dummy Failure of monitor resource %1, but failed. |
停止监视资源%1的模拟故障失败。 |
请确认监视资源%1是否支持模拟故障功能。 |
● |
● |
|||
rm |
信息 |
190 |
Recovery action caused by monitor resource error is disabled. |
监视资源异常时的复归动作无效。 |
- |
● |
● |
|||
rm |
信息 |
191 |
Recovery action caused by monitor resource error is enabled. |
监视资源异常时的复归动作执行有效。 |
- |
● |
● |
|||
rm |
警告 |
192 |
Ignored the recovery action in monitoring %1 because recovery action caused by monitor resource error is disabled. |
由于监视资源异常时的复归动作为无效,因此监视资源%1的复归动作被忽视。 |
- |
● |
● |
|||
rm |
警告 |
193 |
Recovery action at timeout occurrence was disabled, so the recovery action of monitor %1 was not executed. |
由于发生超时时的复归动作为无效,因此监视资源%1的复归动作未被执行。 |
- |
● |
● |
|||
rm |
警告 |
200 |
Since there is no other normally running server, the final action(%1) for the error detection of monitor resource %2 was suppressed. |
由于没有其他正常运行中的服务器,因此,查出监视资源异常时%2,控制最终动作(%1)。 |
- |
● |
● |
|||
mm |
信息 |
901 |
Message monitor has been started. |
消息监视(消息接收监视的相关模块)已开始。 |
- |
● |
● |
|||
mm |
错误 |
902 |
Failed to initialize message monitor. (%1 : %2) |
消息监视(消息接收监视的相关模块)初始化失败。 |
内存不足或者OS资源不足。请确认。 |
● |
● |
|||
mm |
警告 |
903 |
An error of %1 type and %2 device has been detected. (%3) |
接收到范畴%1,关键词%2,的外部错误%3。 |
- |
● |
● |
|||
mm |
错误 |
905 |
An error has been detected in monitoring %1. (%2) |
对监视资源%1的监视中,查出异常。 |
请按照%2的消息采取对策。 |
● |
● |
● |
● |
● |
mm |
错误 |
906 |
Message monitor was terminated abnormally. |
消息监视(消息接收监视的相关模块)异常结束。 |
内存不足或者OS资源不足。请确认。 |
● |
● |
|||
mm |
错误 |
907 |
Failed to execute action. (%1) |
复归操作执行失败。 |
内存不足或者OS资源不足。请确认。 |
● |
● |
|||
mm |
信息 |
908 |
The system will be stopped. |
关闭OS。 |
- |
● |
● |
|||
mm |
信息 |
909 |
The cluter daemon will be stopped. |
停止集群。 |
- |
● |
● |
|||
mm |
信息 |
910 |
The system will be rebooted. |
重启OS。 |
- |
● |
● |
|||
mm |
信息 |
911 |
Message monitor will be restarted. |
重启消息监视(消息接收监视的相关模块)。 |
- |
● |
● |
|||
mm |
信息 |
912 |
Received a message by SNMP Trap from external. (%1 : %2) |
接收到SNMP Trap 的消息。消息中包含了项目 (%1)的信息 (%2)。 |
- |
● |
● |
|||
trnsv |
信息 |
1 |
There was a notification from external (IP=%1), but it was denied. |
虽收到来自%1的连接请求,未被许可。 |
- |
● |
● |
|||
trnsv |
信息 |
10 |
There was a notification (%1) from external (IP=%2). |
从%2收到执行处理(%1)的请求。 |
- |
● |
● |
|||
trnsv |
信息 |
20 |
Recovery action (%1) of monitoring %2 has been executed because a notification arrived from external. |
根据外部通知开始执行监视资源%2异常时动作(%1)。 |
- |
● |
● |
|||
trnsv |
信息 |
21 |
Recovery action (%1) of monitoring %2 has been completed. |
成功执行监视资源%2的异常时动作(%1)。 |
- |
● |
● |
|||
trnsv |
错误 |
22 |
Attempted to recovery action (%1) of monitoring %2, but it failed. |
执行监视资源%2的异常动作(%1)后失败。 |
请确认环境是否允许执行异常动作。 |
● |
● |
|||
trnsv |
信息 |
30 |
Action (%1) has been completed. |
操作(%1)执行成功。 |
- |
● |
● |
|||
trnsv |
警告 |
31 |
Attempted to execute action (%1), but it failed. |
操作(%1)执行失败。 |
请确认环境是否允许执行操作。 |
● |
● |
|||
trnsv |
信息 |
40 |
Script before action of monitoring %1 has been executed. |
执行监视资源(%1)的异常动作前脚本。 |
- |
● |
||||
trnsv |
信息 |
41 |
Script before action of monitoring %1 has been completed. |
监视资源(%1)的异常动作前脚本执行成功。 |
- |
● |
||||
trnsv |
错误 |
42 |
Attempted to execute script before action of monitoring %1, but it failed. |
监视资源(%1)的异常动作前脚本执行失败。 |
请确认环境是否允许执行异常动作。 |
● |
||||
lanhb |
警告 |
71 |
Heartbeats sent from HB resource %1 of server %2 are delayed.(timeout=%3*%4 actual-time=%5 delay warning rate=%6) |
服务器%2的HB资源%1的心跳确认发生延迟。当前的超时值为 %3(秒) x %4(每秒的tick count)。发生延迟时的实测值为 %5(tick count),超过了延迟警告比例 %6(%)。 |
请确认服务器%2的负载情况,并清除负载。
如果仍然发生HB超时,则需要延长HB超时时间。
|
● |
● |
|||
lanhb |
警告 |
72 |
Heartbeats sent from HB resource %1 are delayed.(server=%2 timeout=%3*%4 actual-time=%5 delay warning rate=%6) |
发送HB资源%1的心跳信息时发生延迟。收信服务器为%2。当前的超时值为%3(秒) x %4(每秒的tick count)。发生延迟时的实测值为 %5(tick count),超过了延迟警告比例 %6(%)。 |
请确认被警告有延迟的服务器的负荷状况,并清除负荷。
如果仍然发生HB超时,则需要延长HB超时时间。
|
|||||
lanhb |
警告 |
73 |
Heartbeats received by HB resource %1 are delayed.(server=%2 timeout=%3*%4 actual-time=%5 delay warning rate=%6) |
接收HB资源%1的心跳信息时发生延迟。发信的源服务器为%2。当前的超时值为%3(秒) x %4(每秒的tick count)。发生延迟时的实测值为 %5(tick count),超过延迟警告比例 %6(%)。 |
请确认被警告有延迟的服务器的负荷状况,并清除负荷。
如果仍然发生HB超时,则需要延长HB超时时间。
|
|||||
lankhb |
警告 |
71 |
Heartbeats sent from HB resource %1 of server %2 are delayed.(timeout=%3*%4 actual-time=%5 delay warning rate=%6) |
服务器%2的HB资源%1的心跳确认发生延迟。当前的超时值为%3(秒) x %4(每秒的tick count)。发生延迟时的实测值为 %5(tick count),超过了延迟警告比例 %6(%)。 |
请确认服务器%2的负载情况,并清除负载。
如果仍然发生HB超时,则需要延长HB超时时间。
|
● |
● |
|||
lankhb |
警告 |
73 |
Heartbeats received from HB resource %1 is delayed.(timeout=%2*%3 actual-time=%4 delay warning rate=%5) |
接收HB资源 %1 的心跳信息时发生延迟。发信的源服务器为%2。当前的超时值为%3(秒) x %4(每秒的tick count)。发生延迟时的实测值为 %5(tick count),超过延迟警告比例 %6(%)。 |
请确认被警告有延迟的服务器的负荷状况,并清除负荷。
如果仍然发生HB超时,则需要延长HB超时时间。
|
|||||
diskhb |
错误 |
10 |
Device(%1) of resource(%2) does not exist. |
设备不存在。 |
请确认配置信息。 |
● |
● |
|||
diskhb |
错误 |
11 |
Device(%1) of resource(%2) is not a block device. |
设备不存在。 |
请确认配置信息。 |
● |
● |
|||
diskhb |
错误 |
12 |
Raw device(%1) of resource(%2) does not exist. |
设备不存在。 |
请确认配置信息。 |
● |
● |
|||
diskhb |
错误 |
13 |
Binding device(%1) of resource(%2) to raw device(%3) failed. |
设备不存在。 |
请确认配置信息。 |
● |
● |
|||
diskhb |
错误 |
14 |
Raw device(%1) of resource(%2) has already been bound to other device. |
资源%2的raw设备 %1捆绑在其他设备上。 |
请设置尚未使用的raw设备。 |
● |
● |
|||
diskhb |
错误 |
15 |
File system exists on device(%1) of resource(%2). |
资源%2的设备%1 中存在文件系统。 |
如果使用设备%1 ,则请删除文件系统。 |
● |
● |
|||
diskhb |
情報 |
20 |
Resource %1 recovered from initialization error. |
资源%1从初始化错误中已复原。 |
- |
● |
● |
|||
diskhb |
警告 |
71 |
Heartbeats sent from HB resource %1 of server %2 are delayed.(timeout=%3*%4 actual-time=%5 delay warning rate=%6) |
服务器 %2 的HB资源 %1 的心跳确认发生延迟。当前的超时值为 %3(秒) x %4(每秒的tick count)。发生延迟时的实测值为 %5(tick count),超过了延迟警告比例 %6(%)。 |
请确认服务器 %2 的负载情况,并清除负载。
如果仍然发生HB超时,则需要延长HB超时时间。
|
● |
● |
|||
diskhb |
警告 |
72 |
Heartbeat write of HB resource %1 is delayed.(server=%2 timeout=%3*%4 actual-time=%5 delay warning rate=%6). |
发送HB资源%1的心跳信息时发生延迟。收信服务器为%2。当前的超时值为%3(秒) x %4(每秒的tick count)。发生延迟时的实测值为 %5(tick count),超过了延迟警告比例 %6(%)。 |
请确认被警告有延迟的服务器的负荷状况,并清除负荷。
如果仍然发生HB超时,则需要延长HB超时时间。
|
|||||
diskhb |
警告 |
73 |
Heartbeat read of HB resource %1 is delayed.(server=%2 timeout=%3*%4 actual-time=%5 delay warning rate=%6) |
接收HB资源%1的心跳信息时发生延迟。发信的源服务器为%2。当前的超时值为%3(秒) x %4(每秒的tick count)。发生延迟时的实测值为 %5(tick count),超过延迟警告比例 %6(%)。 |
请确认被警告有延迟的服务器的负荷状况,并清除负荷。
如果仍然发生HB超时,则需要延长HB超时时间。
|
|||||
comhb |
信息 |
1 |
Device (%1) does not exist. |
设备不存在。 |
请确认配置信息。 |
● |
● |
|||
comhb |
信息 |
2 |
Failed to open the device (%1). |
设备开启失败。 |
可执行是内存不足或OS资源不足。请确认。 |
● |
● |
|||
comhb |
警告 |
71 |
Heartbeats sent from HB resource %1 of server %2 are delayed.(timeout=%3*%4 actual-time=%5 delay warning rate=%6) |
服务器%2的HB资源%1的心跳确认发生延迟。当前的超时值为%3(秒) x %4(每秒的tick count)。发生延迟时的实测值为 %5(tick count),超过了延迟警告比例 %6(%)。 |
请确认服务器%2的负载情况,并清除负载。
如果仍然发生HB超时,则需要延长HB超时时间。
|
● |
● |
|||
comhb |
警告 |
72 |
Heartbeat write of HB resource %1 is delayed.(server=%2 timeout=%3*%4 actual-time=%5 delay warning rate=%6). |
发送HB资源%1的心跳信息时发生延迟。收信服务器为%2。当前的超时值为%3(秒) x %4(每秒的tick count)。发生延迟时的实测值为 %5(tick count),超过了延迟警告比例 %6(%)。 |
请确认被警告有延迟的服务器的负荷状况,并清除负荷。
如果仍然发生HB超时,则需要延长HB超时时间。
|
|||||
comhb |
警告 |
73 |
Heartbeat read of HB resource %1 is delayed.(server=%2 timeout=%3*%4 actual-time=%5 delay warning rate=%6) |
接收HB资源%1的心跳信息时发生延迟。发信的源服务器为%2。当前的超时值为%3(秒) x %4(每秒的tick count)。发生延迟时的实测值为 %5(tick count),超过延迟警告比例 %6(%)。 |
请确认被警告有延迟的服务器的负荷状况,并清除负荷。
如果仍然发生HB超时,则需要延长HB超时时间。
|
|||||
bmchb |
错误 |
10 |
Failed to initialize to BMC. |
BMC初始化失败。 |
请确认硬件是否可使用BMC连接功能。 |
● |
● |
|||
bmchb |
警告 |
71 |
Heartbeats sent from HB resource %1 of server %2 are delayed.(timeout=%3*%4 actual-time=%5 delay warning rate=%6) |
服务器2的HB资源%1的心跳读入发生延迟。目前的超时值是 %3(秒) x %4(1秒左右的tick count)。发生延迟时的实测值为 %5(tick count),超出延迟警告比例 %6(%)。 |
请确认服务器%2的负荷状况,并清除负荷。
如果仍然发生HB超时,则需要延长HB超时时间。
|
● |
● |
|||
monp |
错误 |
1 |
An error occurred when initializing monitored process %1. (status=%2) |
监视对象进程 %1的初始化错误。 |
可执行是内存不足,OS资源不足,或集群配置信息不准确。请确认。
如果未登录配置信息,将会输出下列进程的消息,但是没有问题。
+ mdagnt
+ webmgr
+ webalert
|
● |
● |
|||
monp |
错误 |
2 |
Monitor target process %1 terminated abnormally. (status=%2) |
监视对象进程 %1异常结束。 |
可执行是内存不足或OS资源不足。请确认。 |
● |
● |
|||
monp |
信息 |
3 |
Monitor target process %1 will be restarted. |
重启监视对象进程 %1 。 |
- |
● |
● |
|||
monp |
信息 |
4 |
The cluster daemon will be stopped since the monitor target process %1 terminated abnormally. |
由于监视对象进程 %1的异常结束,停止服务器。 |
- |
● |
● |
|||
monp |
错误 |
5 |
Attempted to stop the cluster daemon, but failed. |
欲停止服务器,但失败。 |
可执行是服务器未启动,内存不足或OS资源不足。请确认。 |
● |
● |
|||
monp |
信息 |
6 |
The system will be stopped since the monitor target process %1 terminated abnormally. |
由于监视对象进程%1的异常结束,停止系统。 |
- |
● |
● |
|||
monp |
错误 |
7 |
Attempted to stop the system, but failed. (status=%#x) |
欲停止系统,但失败。 |
可执行是集群未启动,内存不足或OS资源不足。请确认。 |
● |
● |
|||
monp |
信息 |
8 |
System will be rebooted since monitor target process %1 terminated abnormally. |
由于监视对象进程%1的异常结束,重启系统。 |
- |
● |
● |
|||
monp |
错误 |
9 |
Attempted to reboot the system, but failed. (status=%#x) |
欲重启系统,但失败。 |
可执行是集群未启动,内存不足或OS资源不足。请确认。 |
● |
● |
|||
cl |
信息 |
1 |
There was a request to start %1 from the %2. |
出现从%2发出的启动%1的请求。 |
- |
● |
● |
|||
cl |
信息 |
2 |
There was a request to stop %1 from the %2. |
出现从%2发出的停止%1的请求。 |
- |
● |
● |
|||
cl |
信息 |
3 |
There was a request to suspend %1 from the %2. |
出现从%2发出的挂起%1的请求。 |
- |
● |
● |
|||
cl |
信息 |
4 |
There was a request to resume %s from the %s. |
出现从%2发出的复原%1的请求。 |
- |
● |
● |
|||
cl |
错误 |
11 |
A request to start %1 failed(%2). |
%1的启动请求失败。 |
请确认服务器的状态。 |
● |
● |
|||
cl |
错误 |
12 |
A request to stop %1 failed(%2). |
%1的停止请求失败。 |
请确认服务器的状态。 |
● |
● |
|||
cl |
错误 |
13 |
A request to suspend %1 failed(%2). |
%1的挂起请求失败。 |
请确认服务器的状态。 |
● |
● |
|||
cl |
错误 |
14 |
A request to resume %1 failed(%2). |
%1的复原请求失败。 |
请确认服务器的状态。 |
● |
● |
|||
cl |
错误 |
15 |
A request to %1 cluster failed on some servers(%2). |
集群的%1请求在某些服务器上失败。 |
请确认服务器的状态。 |
● |
● |
|||
cl |
错误 |
16 |
A request to start %1 failed on some servers(%2). |
某些服务器中%1的启动失败。 |
请确认%1的状态。 |
● |
● |
|||
cl |
错误 |
17 |
A request to stop %1 failed on some servers(%2). |
某些服务器中%1的停止失败。 |
请确认%1的状态。 |
● |
● |
|||
cl |
警告 |
18 |
Automatic start is suspended because the cluster service was not stopped according to the normal procedure. |
由于没有设置了"关机后自动启动",因此中止了自动启动。 |
为启动集群服务,请通过Cluster WebUI或使用clpcl命令启动集群服务。 |
● |
● |
|||
cl |
警告 |
20 |
A request to start %1 failed because cluster is running(%2). |
由于集群已经启动,%1启动失败。 |
请确认集群状态。 |
● |
● |
|||
cl |
警告 |
21 |
A request to stop %1 failed because cluster is running(%2). |
由于集群已经启动, %1停止失败。 |
请确认集群状态。 |
● |
● |
|||
错误 |
1 |
The license is not registered. (%1) |
请购买并注册License。 |
- |
● |
● |
||||
错误 |
2 |
The trial license has expired in %1. (%2) |
请注册有效License。 |
- |
● |
● |
||||
错误 |
3 |
The registered license is invalid. (%1) |
请注册有效License。 |
- |
● |
● |
||||
错误 |
4 |
The registered license is unknown. (%1) |
请注册有效License。 |
- |
● |
● |
||||
错误 |
5 |
mail failed(%s).(SMTP server: %s) |
邮件通报失败。 |
请确认是否发生了SMTP服务器错误,或与SMTP服务器的通信是否出现问题。 |
● |
● |
||||
信息 |
6 |
mail successed.(SMTP server: %s) |
邮件通报成功。 |
- |
● |
● |
||||
userw |
警告 |
1 |
Detected a monitor delay in monitoring %1. (timeout=%2*%3 actual-time=%4 delay warning rate=%5) |
通过%1的监视查出监视延迟。当前的超时值为%2(秒) x %3(1秒左右的tick count)。查出延迟时的实测值为 %4(tick count),超出延迟警告比例 %5(%)。 |
请确认检测出监视延迟的服务器的复合状态,并且减轻负荷。
如果检测出监视超时,则需要延长监视超时时间。
|
● |
● |
|||
vipw |
警告 |
1 |
Detected a monitor delay in monitoring %1. (timeout=%2*%3 actual-time=%4 delay warning rate=%5) |
通过%1的监视查出监视延迟。当前的超时值为%2(秒) x %3(1秒左右的tick count)。查出延迟时的实测值为 %4(tick count),超出延迟警告比例 %5(%)。 |
请确认检测出监视延迟的服务器的复合状态,并且减轻负荷。
如果检测出监视超时,则需要延长监视超时时间。
|
● |
● |
|||
ddnsw |
警告 |
1 |
Detected a monitor delay in monitoring %1. (timeout=%2*%3 actual-time=%4 delay warning rate=%5) |
通过%1的监视查出监视延迟。当前的超时值为%2(秒) x %3(1秒左右的tick count)。查出延迟时的实测值为 %4(tick count),超出延迟警告比例 %5(%)。 |
请确认检测出监视延迟的服务器的复合状态,并且减轻负荷。
如果检测出监视超时,则需要延长监视超时时间。
|
● |
● |
|||
vmw |
警告 |
1 |
Detected a monitor delay in monitoring %1. (timeout=%2*%3 actual-time=%4 delay warning rate=%5) |
通过%1的监视查出监视延迟。当前的超时值为%2(秒) x %3(1秒左右的tick count)。查出延迟时的实测值为 %4(tick count),超出延迟警告比例 %5(%)。 |
请确认检测出监视延迟的服务器的复合状态,并且减轻负荷。
如果检测出监视超时,则需要延长监视超时时间。
|
● |
● |
|||
apisv |
信息 |
1 |
There was a request to stop cluster from the %1(IP=%2). |
%1要求服务器停止。 |
- |
● |
● |
|||
apisv |
信息 |
2 |
There was a request to shutdown cluster from the %1(IP=%2). |
%1要求服务器关机。 |
- |
● |
● |
|||
apisv |
信息 |
3 |
There was a request to reboot cluster from the %1(IP=%2). |
%1要求服务器重启。 |
- |
● |
● |
|||
apisv |
信息 |
4 |
There was a request to suspend cluster from the %1(IP=%2). |
%1要求服务器挂机。 |
- |
● |
● |
|||
apisv |
信息 |
10 |
There was a request to stop server from the %1(IP=%2). |
%1要求服务器停止。 |
- |
● |
● |
|||
apisv |
信息 |
11 |
There was a request to shutdown server from the %1(IP=%2). |
%1要求服务器关机。 |
- |
● |
● |
|||
apisv |
信息 |
12 |
There was a request to reboot server from the %1(IP=%2). |
%1要求服务器重启。 |
- |
● |
● |
|||
apisv |
信息 |
30 |
There was a request to start group(%1) from the %2(IP=%3). |
%2要求组%1的启动。 |
- |
● |
● |
|||
apisv |
信息 |
31 |
There was a request to start all groups from the %1(IP=%2). |
%1要求所有组的启动。 |
- |
● |
● |
|||
apisv |
信息 |
32 |
There was a request to stop group(%1) from the %2(IP=%3). |
%2要求组%1的停止。 |
- |
● |
● |
|||
apisv |
信息 |
33 |
There was a request to stop all groups from the %1(IP=%2). |
%1要求所有组的停止。 |
- |
● |
● |
|||
apisv |
信息 |
34 |
There was a request to restart group(%1) from the %2(IP=%3). |
%2要求组%1的重启。 |
- |
● |
● |
|||
apisv |
信息 |
35 |
There was a request to restart all groups from the %1(IP=%2). |
%1要求所有组的重启。 |
- |
● |
● |
|||
apisv |
信息 |
36 |
There was a request to move group(%1) from the %2(IP=%3). |
%2要求组%1的移动。 |
- |
● |
● |
|||
apisv |
信息 |
37 |
There was a request to move group from the %1(IP=%2). |
%1要求组的移动。 |
- |
● |
● |
|||
apisv |
信息 |
38 |
There was a request to failover group(%1) from the %2(IP=%3). |
%2要求组%1的失效切换。 |
- |
● |
● |
|||
apisv |
信息 |
39 |
There was a request to failover group from the %1(IP=%2). |
%1要求组的失效切换。 |
- |
● |
● |
|||
apisv |
信息 |
40 |
There was a request to migrate group(%1) from the %2(IP=%3). |
有来自%2的组%1的移动请求。 |
- |
● |
● |
|||
apisv |
信息 |
41 |
There was a request to migrate group from the %1(IP=%2). |
有来自%2的组的移动请求。 |
- |
● |
● |
|||
apisv |
信息 |
42 |
There was a request to failover all groups from the %1(IP=%2). |
有来自%2的组失效切换请求。 |
- |
● |
● |
|||
apisv |
信息 |
43 |
There was a request to cancel waiting for the dependence destination group of group the %1 was issued from %2. |
%2要求取消组%1的依存目标组等待处理。 |
- |
● |
● |
|||
apisv |
信息 |
50 |
There was a request to start resource(%1) from the %2(IP=%3). |
%2要求资源%1的启动。 |
- |
● |
● |
|||
apisv |
信息 |
51 |
There was a request to start all resources from the %1(IP=%2). |
%1要求所有资源的启动。 |
- |
● |
● |
|||
apisv |
信息 |
52 |
There was a request to stop resource(%1) from the %2(IP=%3). |
%2要求资源%1的停止。 |
- |
● |
● |
|||
apisv |
信息 |
53 |
There was a request to stop all resources from the %1(IP=%2). |
%1要求所有资源的停止。 |
- |
● |
● |
|||
apisv |
信息 |
54 |
There was a request to restart resource(%1) from the %2(IP=%3). |
%2要求资源%1的重启。 |
- |
● |
● |
|||
apisv |
信息 |
55 |
There was a request to restart all resources from the %1(IP=%2). |
%1要求所有资源的重启。 |
- |
● |
● |
|||
apisv |
信息 |
60 |
There was a request to suspend monitor resources from the %1(IP=%2). |
出现从%1发出的监视资源挂起请求。 |
- |
● |
● |
|||
apisv |
信息 |
61 |
There was a request to resume monitor resources from the %1(IP=%2). |
出现从%1发出的监视资源复原请求。 |
- |
● |
● |
|||
apisv |
信息 |
62 |
There was a request to enable Dummy Failure of monitor resources from the %1(IP=%2). |
出现从%1发出的监视资源模拟故障开始请求。 |
- |
● |
● |
|||
apisv |
信息 |
63 |
There was a request to disable Dummy Failure of monitor resources from the %1(IP=%2). |
出现从%1发出的监视资源模拟故障停止请求。 |
- |
● |
● |
|||
apisv |
信息 |
70 |
There was a request to set CPU frequency level from the %1(IP=%2). |
出现从%1发出的CPU频率设置要求。 |
- |
● |
● |
|||
apisv |
错误 |
101 |
A request to stop cluster was failed(0x%08x). |
服务器停止失败。 |
请确认服务器的状态。 |
● |
● |
|||
apisv |
错误 |
102 |
A request to shutdown cluster was failed(0x%08x). |
服务器关机失败。 |
请确认服务器的状态。 |
● |
● |
|||
apisv |
错误 |
103 |
A request to reboot cluster was failed(0x%08x). |
服务器重启失败。 |
请确认服务器的状态。 |
● |
● |
|||
apisv |
错误 |
104 |
A request to suspend cluster was failed(0x%08x). |
服务器挂机失败。 |
请确认服务器的状态。 |
● |
● |
|||
apisv |
错误 |
110 |
A request to stop server was failed(0x%08x). |
服务器停止失败。 |
请确认服务器的状态。 |
● |
● |
|||
apisv |
错误 |
111 |
A request to shutdown server was failed(0x%08x). |
服务器关机失败。 |
请确认服务器的状态。 |
● |
● |
|||
apisv |
错误 |
112 |
A request to reboot server was failed(0x%08x). |
服务器重启失败。 |
请确认服务器的状态。 |
● |
● |
|||
apisv |
错误 |
113 |
A request to server panic was failed(0x%08x). |
服务器Panic失败。 |
请确认服务器状态。 |
● |
● |
|||
apisv |
错误 |
114 |
A request to server reset was failed(0x%08x). |
服务器重置失败。 |
请确认服务器状态。 |
● |
● |
|||
apisv |
错误 |
115 |
A request to server sysrq was failed(0x%08x). |
SYSRQPanic失败。 |
请确认服务器状态。 |
● |
● |
|||
apisv |
错误 |
116 |
A request to KA RESET was failed(0x%08x). |
Keepalive重置失败。 |
请确认服务器状态。 |
● |
● |
|||
apisv |
错误 |
117 |
A request to KA PANIC was failed(0x%08x). |
Keepalive Panic失败。 |
请确认服务器状态。 |
● |
● |
|||
apisv |
错误 |
118 |
A request to BMC RESET was failed(0x%08x). |
BMC重置失败。 |
请确认服务器状态。 |
● |
● |
|||
apisv |
错误 |
119 |
A request to BMC PowerOff was failed(0x%08x). |
BMC关闭电源失败。 |
请确认服务器状态。 |
● |
● |
|||
apisv |
错误 |
120 |
A request to BMC PowerCycle was failed(0x%08x). |
BMC 电源循环失败。 |
请确认服务器状态。 |
● |
● |
|||
apisv |
错误 |
121 |
A request to BMC NMI was failed(0x%08x). |
BMC NMI失败。 |
请确认服务器状态。 |
● |
● |
|||
apisv |
错误 |
130 |
A request to start group(%1) was failed(0x%08x). |
组(%1)的启动失败。 |
请根据rc将输出的组启动失败的消息,进行相应处理。 |
● |
● |
|||
apisv |
错误 |
131 |
A request to start all groups was failed(0x%08x). |
全组的启动失败。 |
同上 |
● |
● |
|||
apisv |
错误 |
132 |
A request to stop group(%1) was failed(0x%08x). |
组(%1)的停止失败。 |
请根据rc输出的组停止失败消息,进行相应处理。 |
● |
● |
|||
apisv |
错误 |
133 |
A request to stop all groups was failed(0x%08x). |
全组的停止失败。 |
同上 |
● |
● |
|||
apisv |
错误 |
134 |
A request to restart group(%1) was failed(0x%08x). |
组(%1)的重启失败。 |
请根据rc输出的组停止失败的错误消息采取对策。 |
● |
● |
|||
apisv |
错误 |
135 |
A request to restart all groups was failed(0x%08x). |
全组重启失败。 |
同上 |
● |
● |
|||
apisv |
错误 |
136 |
A request to move group(%1) was failed(0x%08x). |
组(%1)的移动失败。 |
请根据rc输出的组移动失败消息,进行相应处理。 |
● |
● |
|||
apisv |
错误 |
137 |
A request to move all groups was failed(0x%08x). |
所有组的移动失败。 |
同上 |
● |
● |
|||
apisv |
错误 |
138 |
A request to failover group(%1) was failed(0x%08x). |
组(%1)的失效切换失败。 |
请根据rc输出的组失效切换失败消息,进行相应处理。 |
● |
● |
|||
apisv |
错误 |
139 |
A request to failover group was failed(0x%08x). |
所有组失效切换失败。 |
同上 |
● |
● |
|||
apisv |
错误 |
140 |
A request to migrate group(%1) was failed(0x%08x). |
组(%1)的移动失败。 |
请根据rc输出的组失效切换失败的错误消息采取对策。 |
● |
● |
|||
apisv |
错误 |
141 |
A request to migrate all groups was failed(0x%08x). |
所有组的移动失败。 |
同上 |
● |
● |
|||
apisv |
错误 |
142 |
A request to failover all groups was failed(0x%08x). |
所有组的失效切换失败。 |
同上 |
● |
● |
|||
apisv |
错误 |
143 |
A request to cancel waiting for the dependency destination group of group %1 has failed(0x%08x). |
取消组%1的依存目标组等待处理失败。 |
同上 |
● |
● |
|||
apisv |
错误 |
150 |
A request to start resource(%1) was failed(0x%08x). |
资源(%1)的启动失败。 |
请根据rc输出的资源启动失败消息,进行相应处理。 |
● |
● |
|||
apisv |
错误 |
152 |
A request to stop resource(%1) was failed(0x%08x). |
资源(%1)的停止失败。 |
请根据rc输出的资源停止失败消息,进行相应处理。 |
● |
● |
|||
apisv |
错误 |
154 |
A request to restart resource(%1) was failed(0x%08x). |
资源(%1)的重启动失败 |
请根据rc输出的资源重启失败消息,进行相应处理。 |
● |
● |
|||
apisv |
错误 |
155 |
A request to restart all resources was failed(0x%08x). |
所有资源重启失败。 |
同上 |
● |
● |
|||
apisv |
错误 |
160 |
A request to suspend monitor resource was failed(0x%08x). |
监视资源的挂起失败。 |
请确认监视资源的状态。 |
● |
● |
|||
apisv |
错误 |
161 |
A request to resume monitor resource was failed(0x%08x). |
监视资源的复原失败。 |
同上 |
● |
● |
|||
apisv |
错误 |
162 |
A request to enable Dummy Failure of monitor resource was failed(0x%08x). |
开始监视资源的模拟故障失败。 |
请确认监视资源的状态。 |
● |
● |
|||
apisv |
错误 |
163 |
A request to disable Dummy Failure of monitor resource was failed(0x%08x). |
结束监视资源的模拟故障失败。 |
同上 |
● |
● |
|||
apisv |
错误 |
170 |
A request to set CPU frequency was failed(0x%08x). |
CPU频率级别设置失败。 |
请根据rc输出的CPU频率级别设置失败消息,进行相应处理。 |
● |
● |
|||
cfmgr |
信息 |
1 |
The cluster configuration data has been uploaded by %1. |
已上传配置信息。 |
- |
● |
● |
|||
sra |
错误 |
1 |
system monitor closed because reading the SG file failed. |
在SG文件的读入处理中发生异常。 |
请确认另外输出的消息。 |
● |
||||
sra |
错误 |
2 |
Opening an ignore file failed. file name = %1, errno = %2.
%1:文件名
%2:errno
|
无法打开SG文件(%1)。 |
请重启集群或执行挂起/复原。 |
● |
||||
sra |
错误 |
3 |
Reading a configuration file failed. |
在SG文件的读入处理中发生异常。 |
请确认另外输出的消息。 |
● |
||||
sra |
错误 |
4 |
Trace log initialization failed. |
内部日志文件初始化失败。 |
请重启集群或执行挂起/复原。 |
● |
||||
sra |
错误 |
5 |
Creating a daemon process failed. |
发生内部错误。 |
内存不足或者OS资源不足。请确认。 |
● |
||||
sra |
错误 |
6 |
Reading a service configuration file failed. |
在SG文件的读入处理中发生异常。 |
请确认另外输出的消息。 |
● |
||||
sra |
错误 |
7 |
mlock() failed. |
发生内部错误。 |
内存不足或者OS资源不足。请确认。 |
● |
||||
sra |
错误 |
8 |
A daemon process could not be created. |
SystemResource Agent启动(进程的Daemon化)失败。 |
内存不足或者OS资源不足。请确认。 |
● |
||||
sra |
错误 |
9 |
stdio and stderr could not be closed. |
SystemResource Agent启动(关闭标准输入,输出)失败。 |
内存不足或者OS资源不足。请确认。 |
● |
||||
sra |
错误 |
10 |
A signal mask could not be set up. |
SystemResource Agent启动(信号掩码的设置)失败。 |
内存不足或者OS资源不足。请确认。 |
● |
||||
sra |
错误 |
11 |
A configuration file error occurred. (1) [line = %1, %2]
%1:行
%2:设定值
|
SystemResource Agent启动(SG文件的读入)失败。 |
请重启集群或执行挂起/复原。 |
● |
||||
sra |
错误 |
12 |
A configuration file error occurred. (2) [line=%1, %2]
%1:行
%2:设定值
|
SystemResource Agent启动(SG文件的读入)失败。 |
请重启集群或执行挂起/复原。 |
● |
||||
sra |
错误 |
13 |
A plugin event configuration file error occurred. The DLL pointer was not found. [line = %1, %2]
%1:行
%2:设定值
|
SystemResource Agent启动(登录插件事件)失败。 |
请重启集群或执行挂起/复原。 |
● |
||||
sra |
错误 |
14 |
malloc failed. [event structure] |
SystemResource Agent启动(登录插件事件)失败。 |
请重启集群或执行挂起/复原。 |
● |
||||
sra |
错误 |
15 |
A service configuration file error occurred due to an invalid event. [%1]
%1: 设定值
|
A service configuration file error occurred due to an invalid event. [%1]
%1:设定值
|
SystemResourceAgent 启动(服务文件的读入)失败。 |
● |
||||
sra |
错误 |
16 |
A plugin event configuration file
error occurred due to %1.
%1:错误原因
|
A plugin event configuration file
error occurred due to %1.
%1:错误原因
|
SystemResourceAgent的启动
(插件事件文件的读入)失败。
|
● |
||||
sra |
错误 |
17 |
Internal error occurred. |
Internal error occurred. |
发生共享内存访问错误。 |
● |
||||
sra |
警告 |
101 |
Opening an SG file failed. file name = %1, errno = %2
%1:文件名
%2:errno
|
无法打开SG文件(%1)。 |
请重新创建SG文件,并重启集群或执行挂起/复原。 |
● |
||||
sra |
警告 |
102 |
malloc(3) fail(1) . [%1]
%1:函数名
|
发生内部错误。 |
内存不足或者OS资源不足。请确认。 |
● |
||||
sra |
警告 |
103 |
malloc(3) fail(2). [%1]
%1:函数名
|
发生内部错误。 |
内存不足或者OS资源不足。请确认。 |
● |
||||
sra |
警告 |
104 |
An internal error occurred. rename(2) error (errno = %1)
%1:errno
|
本产品异常结束。 |
请参考之前输出的系统日志消息。 |
● |
||||
sra |
警告 |
105 |
realloc(3) fail. [%1].
%1:函数名
|
发生内部错误。 |
内存不足或者OS资源不足。请确认。 |
● |
||||
sra |
警告 |
106 |
A script timed out. (%1 %2)
%1:脚本文件名
%2:参数
|
发生内部错误。 |
请确认服务器的负载情况并清除负载。 |
● |
||||
sra |
警告 |
107 |
[%1] execvp(2) fail (%2).
%1:脚本名
%2:errno
|
发生内部错误。 |
内存不足或者OS资源不足。请确认。 |
● |
||||
sra |
警告 |
108 |
[%1] fork fail (%2). Suspended.
%1:脚本名
%2:errno
|
发生内部错误。 |
内存不足或者OS资源不足。请确认。 |
● |
||||
sra |
警告 |
109 |
malloc(3) fail. [%1]
%1:函数名
|
发生内部错误。 |
内存不足或者OS资源不足。请确认。 |
● |
||||
sra |
信息 |
201 |
A script was executed. (%1)
%1:脚本名
|
执行了脚本(%1)。 |
- |
● |
||||
sra |
信息 |
202 |
Running a script finished. (%1)
%1:脚本名
|
脚本正常终止。 |
- |
● |
||||
sra |
信息 |
203 |
An %1 event succeeded.
%1:执行的事件类型
|
执行了操作管理命令。
%1输出执行的事件类型(boot,shutdown,stop,start,flush)。
|
- |
● |
||||
sra |
错误 |
301 |
A process resource error was detected. (%1, type = cpu, pid = %2, %3)
%1:监视资源名
%2:进程ID
%3:进程名
|
通过特定进程的CPU使用率监视查出异常。 |
请确认监视异常的原因。 |
● |
● |
|||
sra |
错误 |
301 |
A process resource error was detected. (%1, type = memory leak, pid = %2, %3)
%1:监视资源名
%2:进程ID
%3:进程名
|
通过特定进程的内存使用量监视那个查出异常。 |
请确认监视异常的原因。 |
● |
● |
|||
sra |
错误 |
301 |
A process resource error was detected. (%1, type = file leak, pid = %2, %3)
%1:监视资源名
%2:进程ID
%3:进程名
|
通过特定进程的打开文件数(最大值)监视查出异常。 |
请确认监视异常的原因。 |
● |
● |
|||
sra |
错误 |
301 |
A process resource error was detected. (%1, type = open file, pid = %2, %3)
%1:监视资源名
%2:进程ID
%3:进程名
|
通过特定检查的打开文件数(内核上限值)监视查出异常。 |
请确认监视异常的原因。 |
● |
● |
|||
sra |
错误 |
301 |
A process resource error was detected. (%1, type = thread leak, pid = %2, %3)
%1:监视资源名
%2:进程ID
%3:进程名
|
通过特定进程的线程数监视查出异常。 |
请确认监视异常的原因。 |
● |
● |
|||
sra |
错误 |
301 |
A process resource error was detected. (%1, type = defunct, pid = %2, %3)
%1:监视资源名
%2:进程ID
%3:进程名
|
通过僵死进程监视查出异常。 |
请确认监视异常的原因。 |
● |
● |
|||
sra |
错误 |
301 |
A process resource error was detected. (%1, type = same name process, pid = %2, %3)
%1:监视资源名
%2:进程ID
%3:进程名
|
通过同一名称进程监视查出异常。 |
请确认监视异常的原因。 |
● |
● |
|||
sra |
错误 |
302 |
A system resource error was detected. (%1, type = cpu)
%1:监视资源名
|
通过系统的CPU使用率监视查出异常。 |
请确认监视异常的原因。 |
● |
● |
|||
sra |
错误 |
302 |
A system resource error was detected. (%1, type = memory)
%1:监视资源名
|
通过系统的总内存使用量监视查出异常。 |
请确认监视异常的原因。 |
● |
● |
|||
sra |
错误 |
302 |
A system resource error was detected. (%1, type = swap)
%1:监视资源名
|
通过系统的总虚拟内存使用量监视查出异常。 |
请确认监视异常的原因。 |
● |
● |
|||
sra |
错误 |
302 |
A system resource error was detected. (%1, type = file)
%1:监视资源名
|
通过系统的总打开文件数监视查出异常。 |
请确认监视异常的原因。 |
● |
● |
|||
sra |
错误 |
302 |
A system resource error was detected. (%1, type = thread)
%1:监视资源名
|
通过系统的总线程数监视查出异常。 |
请确认监视异常的原因。 |
● |
● |
|||
sra |
错误 |
303 |
A system resource error was detected. (%1, type = number of process, user name = %2)
%1:监视资源名
%2:用户名
|
通过启动系统的每个用户的进程数监视查出异常。 |
请确认监视异常的原因。 |
● |
● |
|||
sra |
错误 |
304 |
A disk resource error was detected. (%1, type = used rate, level = NOTICE, %2)
%1:监视资源名
%2:Mount点
|
通过磁盘使用率监视查出通知级别的异常。 |
请确认监视异常的原因。 |
● |
● |
|||
sra |
错误 |
304 |
A disk resource error was detected. (%1, type = used rate, level = WARNING, %2)
%1:监视资源名
%2:Mount点
|
通过磁盘使用率监视查出警告级别的异常。 |
请确认监视异常的原因。 |
● |
● |
|||
sra |
错误 |
304 |
A disk resource error was detected. (%1, type = free space, level = NOTICE, %2)
%1:监视资源名
%2:Mount点
|
通过磁盘剩余容量监视查出通知级别的异常。 |
请确认监视异常的原因。 |
● |
● |
|||
sra |
错误 |
304 |
A disk resource error was detected. (%1, type = free space, level = WARNING, %2)
%1:监视资源名
%2:Mount点
|
通过磁盘剩余容量监视查出警告级别的异常。 |
请确认监视异常的原因。 |
● |
● |
|||
sra |
警告 |
401 |
zip/unzip package is not installed. |
System Resource Agent收集的统计信息压缩失败。 |
请确认系统中是否已安装zip或者unzip的包。 |
● |
● |
|||
lcns |
信息 |
1 |
The number of licenses is %1. (Product name:%2) |
集群的License数为%1。
%1:License数
%2:产品名
|
- |
● |
● |
|||
lcns |
信息 |
2 |
The trial license is valid until %1. (Product name:%2) |
试用版License的有效期到%1为止。
%1:试用结束日期
%2:产品名
|
- |
● |
● |
|||
lcns |
警告 |
3 |
The number of licenses is insufficient. The number of insufficient licenses is %1. (Product name:%2) |
License不足。License不足的数为%1。
%1:不足License数
%2:产品名
|
请购买不够的部分,进行注册。
|
● |
● |
|||
lcns |
错误 |
4 |
The license is not registered. (Product name:%1) |
尚未注册License。
%1:产品名
|
请购买License并进行注册。
|
● |
● |
|||
lcns |
错误 |
5 |
The trial license has expired in %1. (Product name:%2) |
试用版License已经过期。
%1:试用结束日期
%2:产品名
|
请注册有效的
License。
|
● |
● |
|||
lcns |
错误 |
6 |
The registered license is invalid. (Product name:%1, Serial No:%2) |
注册的License无效。
%1:产品名
%2:序列号
|
请注册有效的
License。
|
● |
● |
|||
lcns |
错误 |
7 |
The registered license is unknown. (Product name:%1) |
注册的License状态不明。
%1:产品名
|
请注册有效的
License。
|
● |
● |
|||
lcns |
错误 |
8 |
The trial license is valid from %1. (Product name:%2) |
试用版License尚未到生效期。
%1:试用开始日期
%2:产品名
|
请注册有效的
License。
|
● |
● |
|||
lcns |
信息 |
9 |
The fixed term license is valid until %1. (Product name:%2) |
期间定制License的有效期到%1为止。
%1:有效期结束日期
%2:产品名
|
- |
● |
● |
|||
lcns |
错误 |
10 |
The fixed term license has expired in %1. (Product name:%2) |
期间定制License已经过期。
%1:有效期结束日期
%2:产品名
|
请注册有效的
License。
|
● |
● |
|||
webmgr |
警告 |
21 |
HTTPS configuration isn't correct, HTTPS mode doesn't work. Please access WebManager by HTTP mode. |
因为HTTPS的设置不正确,通过HTTPS无法使用WebManager。请通过HTTP 连接到WebManager。 |
- |
● |
● |
4.2. 驱动程序syslog消息
4.2.1. 内核模式LAN心跳驱动程序
模块类型
|
事件
分类
|
事件ID
|
消息
|
描述
|
处理方法
|
|---|---|---|---|---|---|
clpkhb |
信息 |
101 |
Kernel Heartbeat was initialized successfully. (major=%1, minor=%2) |
clpkhb驱动加载成功。 |
- |
clpkhb |
信息 |
102 |
Kernel Heartbeat was released successfully. |
clpkhb驱动卸载成功。 |
- |
clpkhb |
错误 |
103 |
Can not register miscdev on minor=%1. (err=%2) |
clpkhb驱动加载失败。 |
- |
clpkhb |
错误 |
104 |
Can not deregister miscdev on minor=%1. (err=%2) |
clpkhb驱动卸载失败。 |
- |
clpkhb |
信息 |
105 |
Kernel Heartbeat was initialized by %1. |
clpkhb驱动程序被[%1]模块正常初始化。 |
- |
clpkhb |
信息 |
106 |
Kernel Heartbeat was terminated by %1. |
clpkhb驱动程序被[%1]模块正常结束。 |
- |
clpkhb |
错误 |
107 |
Can not register Kernel Heartbeat proc file! |
clpkhb驱动用的proc文件创建失败。 |
- |
clpkhb |
错误 |
108 |
Version error. |
clpkhb驱动的内部版本信息不正确。 |
请重新安装
EXPRESSCLUSTER。
|
clpkhb |
信息 |
110 |
The send thread has been created. (PID=%1) |
clpkhb驱动程序得到正常创建。
进程ID是[%1]。
|
- |
clpkhb |
信息 |
110 |
The recv thread has been created. (PID=%1) |
clpkhb驱动程序的收信线程得到正常创建。
进程ID是[%1]。
|
|
clpkhb |
错误 |
111 |
Failed to create send thread. (err=%1) |
因为错误[%1],clpkhb驱动的发送线程创建失败。 |
- |
clpkhb |
错误 |
111 |
Failed to create recv thread. (err=%1) |
因为错误[%1],clpkhb驱动的接收线程创建失败。 |
|
clpkhb |
信息 |
112 |
Killed the send thread successfully. |
clpkhb驱动程序的发信线程得到正常停止。 |
- |
clpkhb |
信息 |
112 |
Killed the recv thread successfully. |
clpkhb驱动程序的收信线程得到正常停止。 |
|
clpkhb |
信息 |
113 |
Killed the recv thread successfully. |
clpkhb驱动退出。 |
- |
clpkhb |
信息 |
114 |
Killed the recv thread successfully. |
clpkhb驱动停止。 |
- |
clpkhb |
信息 |
115 |
Kernel Heartbeat has been stopped |
clpkhb驱动程序已经正常停止。 |
- |
clpkhb |
错误 |
120 |
Failed to create socket to send %1 packet. (err=%2) |
因为错误[%2],[%1](HB/DOWN/KA)数据包发送所用Socket创建失败。 |
- |
clpkhb |
错误 |
120 |
Failed to create socket to receive packet. (err=%2) |
因为错误[%2],数据包接收所用Socket创建失败。 |
|
clpkhb |
错误 |
121 |
Failed to create sending %1 socket address. (err=%2) |
[%1](HB/DOWN/KA)发送用Socket设置失败。 |
物理内存可执行不足。请增加物理内存或退出不使用的应用程序。 |
clpkhb |
错误 |
122 |
Failed to create %1 socket address. (err=%2) |
[%1](HB/DOWN/KA)发送用Socket设置失败。 |
物理内存可执行不足。请增加物理内存或退出不使用的应用程序。 |
clpkhb |
错误 |
123 |
Failed to bind %1 socket. (err=%2) |
[%1](HB/DOWN/KA/recv)所用Socket绑定失败。 |
请确认OS的状态。
用于clpkhb的通信端口可执行已经被其他应用程序使用。请确认通信端口的使用状况。
请确认私网LAN I/F中设置的IP地址是否错误,并确认集群配置信息中的服务器属性。
|
clpkhb |
错误 |
125 |
Failed to send %1 data to %2. (err=%3) |
[%1](HB/DOWN/KA)数据不能发送到[%2]。 |
请确认用于clpkhb通信的网络状态。
请确认对方服务器的状态。
请确认配置信息是否有问题。
|
clpkhb |
错误 |
126 |
Failed to receive data. (err=%3) |
数据接收失败。 |
对方服务器可执行宕机。请确认。
对方服务器没有宕机时,请确认用于clpkhb的网络的状态。
|
clpkhb |
信息 |
127 |
|
|
可执行其他应用程序在向用于clpkhb的端口发送数据。请确认端口的使用状况。 |
clpkhb |
错误 |
128 |
|
|
同上。 |
clpkhb |
信息 |
129 |
Receiving operation was interrupted by ending signal! |
收信线程通过结束信号退出。 |
- |
clpkhb |
信息 |
130 |
|
|
请确认发生重新设置的服务器的状态。 |
clpkhb |
信息 |
131 |
|
|
请确认发生Panic的服务器的状态。 |
clpkhb |
错误 |
140 |
Reference an inaccessible memory area! |
通过ioctl()与应用程序的数据收发失败。 |
请确认OS的状态。 |
clpkhb |
错误 |
141 |
Failed to allocate memory! |
内存确保失败。 |
物理内存可执行不足。请增加物理内存或退出不使用的应用程序。 |
clpkhb |
错误 |
142 |
Invalid argument, %1! |
传递给clpkhb驱动的参数不正确。 |
请确认设置是否正确。 |
clpkhb |
警告 |
143 |
Local node has nothing with current resource. |
传递给clpkhb驱动的心跳资源信息不正确。 |
同上。 |
4.2.2. KeepAlive驱动程序
模块类型 |
事件
分类
|
事件ID |
消息 |
描述 |
处理方法 |
|---|---|---|---|---|---|
clpka |
信息 |
101 |
Kernel Keepalive was initialized successfully. (major=%1, minor=%2) |
clpka驱动程序被正常
加载。
|
- |
clpka |
信息 |
102 |
Kernel Keepalive was released successfully. |
clpka驱动程序被正常
卸载。
|
- |
clpka |
错误 |
103 |
Can not register miscdev on minor=%1. (err=%2) |
clpka驱动程序的加载
失败。
|
请确认是不是内核模式LAN心跳支持的Distribution,内核。 |
clpka |
信息 |
105 |
Kernel Keepalive was Initialized by %1. |
clpka驱动被正常初始化。 |
- |
clpka |
错误 |
107 |
Can not register Kernel Keepalive proc file! |
clpka驱动所用的proc文件创建失败。 |
可执行是因为内存不足等导致内核没有正常运行。请增加物理内存或者结束不必要的应用程序。 |
clpka |
错误 |
108 |
Version error. |
clpka驱动的版本不正确。 |
请确认安装的clpka驱动是否为正规版本。 |
clpka |
错误 |
111 |
Failed to create notify thread. (err=%1) |
clpka驱动的线程创建失败。 |
可执行是因为内存不足等导致内核没有正常运行。请增加物理内存或者退出不适用的应用程序。 |
clpka |
信息 |
130 |
Reboot tried. |
根据设置,clpka驱动尝试重启机器。 |
- |
clpka |
信息 |
132 |
Kernel do nothing. |
根据设置,clpka驱动没有执行任何操作。 |
- |
clpka |
错误 |
140 |
Reference an inaccessible memory area! |
clpka驱动的版本信息不能传递给集群本体。 |
请确认安装的clpka驱动是否为正规版本。 |
clpka |
错误 |
141 |
Failed to allocate memory! |
物理内存不足。 |
物理内存不足。请增加物理内存或退出不使用的应用程序。 |
clpka |
错误 |
142 |
Invalid argument, %1! |
集群本体向clpka驱动传递的信息不正确。 |
请确认安装的clpka驱动是否为正规版本。 |
clpka |
错误 |
144 |
Process (PID=%1) is not set. |
试图通过集群之外的进程(%1)操作clpka驱动。 |
请确认是否存在错误访问clpka驱动的应用程序 (%1)。 |
4.3. 组资源启动/停止时的详细信息
4.3.1. EXEC资源
模块类型 |
分类 |
返值 |
消息 |
描述 |
处理方法 |
|---|---|---|---|---|---|
exec |
错误 |
1 |
Termination code %1 was returned. |
返回0以外的结束编码作为同步脚本或应用程序执行的结果。 |
对于脚本,可执行是脚本内容有问题。请确认脚本的记述是否正确。
对于应用程序,可执行是应用程序异常结束。请确认应用程序的运转。
|
exec |
错误 |
1 |
Command was not completed within %1 seconds. |
同步脚本或应用程序的执行未在指定时间内正常结束。 |
对于脚本,可执行是脚本内容有问题。请确认脚本的记述是否正确。
对于应用程序,可执行是应用程序异常结束。请确认应用程序的运转。
可执行从日志可以分别限定原因。
|
exec |
错误 |
1 |
Command was aborted. |
同步脚本或应用程序异常结束。 |
对于应用程序,可执行是应用程序异常结束。请确认应用程序的运转。
可执行是内存不足或OS资源不足。请确认。
|
exec |
错误 |
1 |
Command was not found. (error=%1) |
应用程序不存在。 |
应用程序的路径可执行不正确。请确认配置信息的应用程序的路径。 |
exec |
错误 |
1 |
Command string was invalid. |
应用程序的路径不正确。 |
请确认配置信息的应用程序的路径。 |
exec |
错误 |
1 |
Log string was invalid. |
日志输出目标的路径不正确。 |
请确认配置信息的日志输出目标的路径。 |
exec |
错误 |
1 |
Internal error. (status=%1) |
发生其他内部错误。 |
可执行是内存不足或OS资源不足。请确认。 |
4.3.2. 虚拟机资源
模块类型 |
分类 |
返值 |
消息 |
描述 |
处理方法 |
|---|---|---|---|---|---|
Vm |
错误 |
1~6,8 |
Initialize error occured. |
初期化中查出异常。 |
请确认集群配置信息是否正确。 |
Vm |
错误 |
7 |
Parameter is invalid. |
参数不正确。 |
请确认集群配置信息是否正确。 |
Vm |
错误 |
9~13 |
Failed to %s virtual machine %s. |
虚拟机的控制失败。 |
请确认虚拟机的状态。 |
Vm |
错误 |
22 |
Datastore must be setted. |
Cluster WebUI中必须设置磁盘共享目录。 |
通过Cluster WebUI设置虚拟机资源详细属性标签中,在虚拟机设定情报行中添入【磁盘共享目录】名。 |
Vm |
错误 |
23 |
VM configuration file path must be setted. |
Cluster WebUI中,必须设置创建VM文件路径。 |
通过Cluster WebUI设置虚拟机资源详细属性标签中,在[创建虚拟机文件路径]行中添入虚拟机详细设定路径。配置后上传。 |
Vm |
错误 |
其他 |
Internal error occured. |
发生了其他内部错误。 |
可执行是因为内存不足或OS资源不足。请进行确认。 |
4.4. 监视资源异常时的详细信息
4.4.1. 软件RAID监视资源
模块类型 |
分类 |
返值 |
消息 |
描述 |
处理方法 |
|---|---|---|---|---|---|
Lmdw |
警告 |
101 |
Device=(%1): Bad disks(%2) are detected in mirror disk. |
镜像磁盘下面的物理磁盘部分损坏,处于[警告]状态。 |
镜像磁盘本身可以使用,但需要更换损坏的物理磁盘。 |
Lmdw |
警告 |
102
190
|
Internal error.err=%1 |
显示发生内部错误。 |
可执行是内存不足或OS的资源不足。请确认。 |
Lmdw |
警告 |
102
190
|
Config file error.(err=%1) |
显示配置信息内容异常。 |
请确认配置信息是否正确。 |
Lmdw |
警告 |
190 |
Soft RAID module has a problem. (err=%1) |
Soft RAID关联的内核模块异常。 |
- |
Lmdw |
警告 |
190 |
Options or parameters are invalid. |
显示发生命令参数错误。 |
请确认配置信息是否正确。 |
Lmdw |
警告 |
190 |
Failed to read config file.(err=%1) |
显示配置文件读取失败。 |
请确认配置信息是否存在。 |
Lmdw |
警告 |
191 |
Device=(%1): Mirror disk is in recovery process (%2). |
镜像磁盘[复归中]。 |
- |
4.4.2. IP监视资源
模块类型 |
分类 |
返值 |
消息 |
描述 |
处理方法 |
|---|---|---|---|---|---|
Ipw |
错误 |
5 |
Ping was failed by timeout. IP=%s... |
由于ping命令超时导致失败。 |
可执行是系统高负荷,内存不足或OS资源不足。请确认。 |
Ipw |
错误 |
31 |
Ping cannot reach. (ret=%1) IP=%2... |
ping命令发出的包未到达。 |
请确认向该IP地址的 ping命令是否成功。ping命令失败时,请确认拥有该IP地址的机器的状态或网络界面的状态。 |
Ipw |
警告 |
102 |
Ping was failed. (ret=%1) IP=%2... |
ping命令失败。 |
可执行是内存不足或OS资源不足。请确认。 |
Ipw |
警告 |
106
108~121
|
Internal error. (status=%1) |
发生其他内部错误。 |
可执行是内存不足或OS资源不足。请确认。 |
Ipw |
警告 |
189 |
Internal error. (status=%1) |
IP监视资源的监视处理因超时而失败。 |
可执行是内存不足或OS资源不足。请确认。 |
4.4.3. 磁盘监视资源
模块类型 |
分类 |
返值 |
消息 |
描述 |
处理方法 |
|---|---|---|---|---|---|
diskw |
错误 |
12 |
Ioctl was failed. (err=%1) Device=%2 |
设备的控制失败。 |
请确认监视对象磁盘是否正确访问,监视对象磁盘的电源是否打开,或者监视对象磁盘内是否发生其他异常。 |
diskw |
错误 |
14 |
Open was failed. (err=%1) File=%2 |
文件的打开失败。 |
请确认是否存在文件名相同的目录,监视对象磁盘是否正确连接,监视对象磁盘的电源是否打开,或者监视对象磁盘内是否发生其他异常。
可执行是内存不足或OS资源不足。请确认。
|
diskw |
错误 |
14 |
Open was failed. (err=%1) Device=%2 |
设备打开失败。 |
请确认是否存在文件名相同的目录,监视对象磁盘是否正确连接,监视对象磁盘的电源是否打开,或者监视对象磁盘内是否发生其他异常。
可执行是内存不足或OS资源不足。请确认。
|
diskw |
错误 |
16 |
Read was failed. (err=%1) Device=%2 |
从设备的读入失败。 |
请确认监视对象磁盘是否正确访问,监视对象磁盘的电源是否打开,或者监视对象磁盘内是否发生其他异常。
可执行是内存不足或OS资源不足。请确认。
|
diskw |
错误 |
18 |
Write was failed. (err=%1) File=%2 |
向文件的写入失败。 |
请确认监视对象磁盘是否正确访问,监视对象磁盘的电源是否打开,或者监视对象磁盘内是否发生其他异常。
可执行是内存不足或OS资源不足。请确认。
|
diskw |
错误 |
41 |
SG_IO failed. (sg_io_hdr_t info:%1 SG_INFO_OK_MASK: %2) |
SG_IO失败。 |
请确认监视对象磁盘是否正确连接,监视对象磁盘的电源是否ON,或者监视对象磁盘中是否发生了其他异常。 |
diskw |
错误 |
49 |
Already bound for other. Rawdevice=%1 Device=%2 |
RAW设备已经被其他设备绑定。。 |
设置的RAW设备已经能够被其他设备绑定。请通过Cluster WebUI 更改RAW设备名称。 |
diskw |
错误 |
55 |
Bind was failed. Rawdevice=%1 Device=%2 |
绑定失败。 |
绑定失败。请通过Cluster WebUI确认RAW设备名称。 |
diskw |
错误 |
56 |
Lseek was failed by timeout. Device=%1 |
lseek失败。 |
可执行是系统高负荷,内存不足或OS资源不足。请确认。 |
diskw |
错误 |
57 |
Fdatasync was failed by timeout. Device=%1 |
fdatasync失败。 |
请确认监视对象磁盘是否正确连接,监视对象磁盘的电源是否打开,或者监视对象磁盘内是否发生其他异常。
可执行是系统高负荷,内存不足或OS资源不足。请确认。
|
diskw |
警告 |
101 |
Ioctl was failed by timeout. Device=%1 |
设备的控制失败。 |
请确认监视对象磁盘是否正确访问,监视对象磁盘的电源是否打开,或者监视对象磁盘内是否发生其他异常。
可执行是系统高负荷,内存不足或OS资源不足。请确认。
|
Diskw |
警告 |
101 |
Open was failed by timeout. File=%1 |
文件的打开由于超时而失败。 |
请确认监视对象磁盘是否正确访问,监视对象磁盘的电源是否打开,或者监视对象磁盘内是否发生其他异常。
可执行是系统高负荷,内存不足或OS资源不足。请确认。
|
Diskw |
警告 |
101 |
Open was failed by timeout. Device=%1 |
设备打开由于超时而失败。 |
请确认监视对象磁盘是否正确访问,监视对象磁盘的电源是否打开,或者监视对象磁盘内是否发生其他异常。
可执行是系统高负荷,内存不足或OS资源不足。请确认。
|
Diskw |
警告 |
101 |
Read was failed by timeout. Device=%1 |
从设备的读入由于超时失败。 |
请确认监视对象磁盘是否正确连接,监视对象磁盘的电源是否打开,或者监视对象磁盘内是否发生其他异常。 |
可执行是系统高负荷,内存不足或OS资源不足。请确认。 |
|||||
Diskw |
警告 |
101 |
Write was failed by timeout. File=%1 |
向文件的写入由于超时而失败。 |
请确认监视对象磁盘是否正确连接,监视对象磁盘的电源是否打开,或者监视对象磁盘内是否发生其他异常。
可执行是系统高负荷,内存不足或OS资源不足。请确认。
|
Diskw |
警告 |
101 |
Bind was failed. Rawdevice=%1 Device=%2 |
绑定失败。 |
绑定失败。请通过Cluster WebUI确认RAW设备名称。 |
Diskw |
警告 |
101 |
Stat was failed. (err=%1) Device=%2 |
stat失败。 |
stat失败。请通过Cluster WebUI确认设备名称。 |
Diskw |
警告 |
101 |
Popen was failed. (err=%1) |
popen失败。 |
popen失败。可执行是内存不足或OS资源不足。请确认。 |
Diskw |
警告 |
101 |
Option was invalid. |
参数不正确。 |
请确认集群配置信息是否正确。 |
Diskw |
警告 |
190 |
Option was invalid. |
参数不正确。 |
请确认集群配置信息是否正确。 |
Diskw |
警告 |
101 |
Internal error. (status=%1) |
发生内部错误。 |
可执行是内存不足或OS资源不足。请确认。 |
Diskw |
警告 |
190 |
Internal error. (status=%1) |
发生内部错误。 |
可执行是内存不足或OS资源不足。请确认。 |
Diskw |
警告 |
190 |
Parameter was invalid. File=%1 |
指定的文件名不正确。 |
请不要指定以/dev开头的设备文件。请指定一般的文件。 |
Diskw |
警告 |
190 |
Device was invalid. Device=%1 |
指定的设备不正确。 |
请通过Cluster WebUI确认磁盘监视资源的设备名称。 |
Diskw |
警告 |
191 |
Ignored disk full error. |
无视磁盘已满的错误。 |
请确认设备的使用状况。 |
4.4.4. PID监视资源
模块类型 |
分类 |
返值 |
消息 |
描述 |
处理方法 |
|---|---|---|---|---|---|
pidw |
错误 |
1 |
Process does not exist. (pid=%1) |
未找到资源。 |
监视对象进程由于某种原因消失。请确认。 |
pidw |
警告 |
100 |
Resource %1 was not found. |
未找到资源。 |
请在Cluster WebUI上确认配置信息。 |
pidw |
警告 |
100 |
Internal error. (status=%1) |
发生其他内部错误。 |
可执行是内存不足或OS资源不足。请确认。 |
4.4.5. 用户空间监视资源
模块类型 |
分类 |
返值 |
消息 |
描述 |
处理方法 |
|---|---|---|---|---|---|
userw |
错误 |
1 |
Initialize error. (%1) |
在进程的初始化时查出异常。 |
请确认softdog.o和/dev/watchdog是否存在。
请确认用户空间监视资源依存的驱动程序是否存在,或者是否安装了rpm。依存的驱动程序或rpm根据监视方法而不同。
|
_custom-monitor-resource:
4.4.6. 自定义监视资源
模块类型 |
分类 |
返值 |
消息 |
描述 |
处理方法 |
|---|---|---|---|---|---|
genw |
错误 |
1 |
Initialize error. (status=%d) |
初期化中查出异常。 |
可执行是内存不足或OS资源不足。请确认。 |
genw |
错误 |
2 |
Termination code %d was returned. |
返回预计之外的值。 |
请确认集群配置信息是否正确。 |
genw |
错误 |
3 |
User was not superuser. |
不是root用户。 |
请以root用户身份登录。 |
genw |
错误 |
4 |
Getting of config was failed. |
获取集群配置信息失败。 |
请确认是否存在集群配置信息。 |
genw |
错误 |
5 |
Parameter was invalid. |
参数不正确。 |
请确认集群配置信息是否正确。 |
genw |
错误 |
6 |
Option was invalid. |
参数不正确。 |
请确认集群配置信息是否正确。 |
genw |
错误 |
7 |
Monitor Resource %s was not found. |
没有找到资源。 |
请确认集群配置信息是否正确。 |
genw |
错误 |
8 |
Create process failed. |
进程生成失败。 |
可执行是内存不足或OS资源不足。请确认。 |
genw |
错误 |
9 |
Process does not exist. (pid=%d) |
进程不存在。 |
请确认是否存在进程。 |
genw |
错误 |
10 |
Process aborted. (pid=%d) |
进程不存在。 |
请确认是否存在进程。 |
genw |
错误 |
11 |
Asynchronous process does not exist. (pid=%d) |
进程不存在。 |
请确认是否存在进程。 |
genw |
错误 |
12 |
Asynchronous process aborted. (pid=%d) |
进程不存在。 |
请确认是否存在进程。 |
genw |
错误 |
13 |
Monitor path was invalid. |
路径不正确。 |
请确认集群配置信息是否正确。 |
genw |
错误 |
其他 |
Internal error. (status=%d) |
发生其他内部错误。 |
- |
4.4.7. 多目标监视资源
模块类型 |
分类 |
返值 |
消息 |
描述 |
处理方法 |
|---|---|---|---|---|---|
Mtw |
错误 |
1 |
Option was invalid. |
参数不正确。 |
请确认集群配置信息是否正确。 |
Mtw |
错误 |
2 |
User was not superuser. |
不是root用户。 |
请以root用户身份登录。 |
Mtw |
错误 |
3 |
Internal error. (status=%d) |
发生其他内部错误。 |
- |
4.4.8. JVM监视资源
模块类型 |
分类 |
返值 |
消息 |
描述 |
处理方法 |
|---|---|---|---|---|---|
Jraw |
错误 |
11 |
An error was detected in accessing the monitor target. |
无法连接监视对象Java VM。 |
请确认监视对象Java VM是否已启动。 |
Jraw |
错误 |
12 |
JVM status changed to abnormal. cause = %1. |
在Java VM的监视中查出异常。
%1:异常发生原因
GarbageCollection
JavaMemoryPool
Thread
WorkManagerQueue
WebOTXStall
|
请根据消息,确认在监视对象Java VM上操作的Java应用程序。 |
Jraw |
警告 |
189 |
Internal error occurred. |
发生内部错误。 |
请执行集群挂起和集群复原。 |
4.4.9. 系统监视资源
模块类型 |
分类 |
返值 |
消息 |
描述 |
处理方法 |
|---|---|---|---|---|---|
sraw |
错误 |
11 |
Detected an error in monitoring system. resource |
在系统资源的监视中查出异常。 |
资源出现某种异常。请确认。 |
4.4.10. 进程资源监视资源
模块类型 |
分类 |
返值 |
消息 |
描述 |
处理方法 |
|---|---|---|---|---|---|
psrw |
错误 |
11 |
Detected an error in monitoring process resource |
在进程资源的监视中查出异常。 |
资源出现某种异常。请确认。 |
4.4.11. NIC Link Up/Down监视资源
模块类型 |
分类 |
返值 |
消息 |
描述 |
处理方法 |
|---|---|---|---|---|---|
miiw |
错误 |
20 |
NIC %1 link was down. |
NIC的Link已经Down。 |
请确认LAN线缆是否被正确访问。 |
miiw |
警告 |
110 |
Get address information was failed. (err=%1) |
IPv4或者,IPv6地址Family的Socket地址的获取失败。 |
请确认内核的配置是否支持TCP/IP联网(IPv4或者,IPv6)。 |
miiw |
警告 |
111 |
Socket creation was failed. (err=%1) |
Socket的创建失败。 |
可执行是内存不足或OS资源不足。请确认。 |
miiw |
警告 |
112 |
ioctl was failed. (err=%1) Device=%2 Request=%3 |
向网络驱动程序的控制要求失败。 |
请确认网络驱动程序是否支持%3的控制要求。 |
miiw |
警告 |
113 |
MII was not supported or no such device. Device=%1 |
NIC不支持MII,或者监视对象不存在。 |
监视对象不存在时,请用ifconfig等确认网络界面名。 |
miiw |
警告 |
189 |
Internal error. (status=%d) |
发生其他内部错误。 |
- |
miiw |
警告 |
190 |
Option was invalid. |
Option不正确。 |
请在Cluster WebUI上确认集群配置信息。 |
miiw |
警告 |
190 |
Config was invalid. (err=%1) %2 |
配置信息不正确。 |
请在Cluster WebUI上确认配置信息。 |
4.4.12. 虚拟机监视资源
模块类型 |
分类 |
返值 |
消息 |
描述 |
处理方法 |
|---|---|---|---|---|---|
vmw |
错误 |
1 |
initialize error occured. |
初期化中查出异常。 |
可执行是因为内存不足或OS资源不足或虚拟环境的问题。请进行确认。 |
vmw |
错误 |
11 |
monitor success, virtual machine is not running. |
检测到虚拟机停止。 |
请确认虚拟机的状态。 |
vmw |
错误 |
12 |
failed to get virtual machine status. |
获取虚拟机状态失败。 |
请确认虚拟机是否存在。 |
vmw |
错误 |
13 |
timeout occured. |
监视超时。 |
OS负载可执行太高。请确认。 |
4.4.13. 卷管理监视资源
模块类型 |
分类 |
返值 |
消息 |
描述 |
处理方法 |
|---|---|---|---|---|---|
volmgrw |
错误 |
21 |
Command was failed. (cmd=%1, ret=%2) |
%1命令失败。命令返回值为%2 |
命令失败。请确认卷管理器的运行情况。 |
volmgrw |
错误 |
22 |
Internal error. (status=%1) |
发生了其他内部错误。 |
- |
volmgrw |
错误 |
23 |
Internal error. (status=%1) |
发生了其他内部错误。 |
- |
volmgrw |
警告 |
190 |
Option was invalid. |
选项不正确。 |
请通过Cluster WebUI确认集群配置信息。 |
volmgrw |
警告 |
191 |
%1 %2 is %3 ! |
卷管理器 (%1)的目标 (%2)的状态变为%3。 |
请确认卷管理器目标状态。 |
volmgrw |
警告 |
其他 |
Internal error. (status=%1) |
发生了其他内部错误。 |
- |
4.4.14. 进程名监视资源
模块类型 |
分类 |
返回值 |
消息 |
描述 |
处理方法 |
|---|---|---|---|---|---|
psw |
错误 |
11 |
Process[%1 (pid=%2)]
Down
|
查出了监视对象进程的消失。 |
请确认监视对象进程是否正常运行。 |
psw |
错误 |
12 |
The number of processes is less than the specified minimum process count. %1/%2 (%3) |
监视对象进程的启动进程数低于指定的下限值。 |
请确认监视对象进程是否正常运行。 |
psw |
警告 |
100 |
Monitoring timeout |
监视超时。 |
OS负载可执行很高。
请确认。
|
psw |
警告 |
101 |
Internal error |
发生了内部错误。 |
可执行是因为内存不足或OS资源不足。请进行确认。 |
psw |
警告 |
190 |
Internal error |
发生了内部错误。 |
可执行是因为内存不足或OS资源不足。请进行确认。 |
psw |
警告 |
190 |
Initialize error |
查出了初期化中发生的异常。 |
可执行是因为内存不足或OS资源不足。请进行确认。 |
4.4.15. 监视选项监视资源
监视选项监视资源使用共同的信息。模块类型根据每个监视选项监视资源而不同。
监视选项监视资源 |
模块类型 |
|---|---|
DB2监视资源 |
db2w |
FTP监视资源 |
ftpw |
HTTP监视资源 |
httpw |
IMAP4监视资源 |
imap4w |
MySQL监视资源 |
mysqlw |
NFS监视资源 |
nfsw |
ODBC监视资源 |
odbcw |
Oracle监视资源 |
oraclew |
POP3监视资源 |
pop3w |
PostgreSQL监视资源 |
psqlw |
Samba监视资源 |
sambaw |
SMTP监视资源 |
smtpw |
SQL Server监视资源 |
sqlserverw |
Sybase监视资源 |
sybasew |
Tuxedo监视资源 |
tuxw |
Weblogic监视资源 |
wlsw |
Websphere监视资源 |
wasw |
WebOTX监视资源 |
otxw |
模块类型 |
分类 |
返值 |
消息 |
描述 |
处理方法 |
|---|---|---|---|---|---|
(别表) |
错误 |
5 |
Failed to connect to %1 server. [ret=%2] |
连接监视对象失败。
%1中加入应用程序。
|
请确认监视对象的状态。 |
(别表) |
错误 |
7 |
Failed to execute SQL statement (%1). [ret=%2] |
SQL文(%1)执行失败。
在[%1]中,加入模块类型。
|
请在Cluster WebUI上确认配置信息。 |
(别表) |
错误 |
8 |
Failed to access with %1. |
和监视对象的数据访问失败。
在[%1]中,加入监视对象。
|
请确认监视对象的状态。 |
(别表) |
错误 |
9 |
Detected error in %1. |
监视对象异常。
在[%1]中,加入监视对象。
|
请确认监视对象的状态。 |
(别表) |
警告 |
104 |
Detected function exception. [%1, ret=%2] |
查出异常。
%1中加入监视对象。
|
请在Cluster WebUI上确认配置信息。
可执行是OS处于高负荷状态。请确认。
|
(别表) |
警告 |
106 |
Detected authority error. |
用户验证失败。 |
请确认用户名,密码,访问权限。 |
(别表) |
警告 |
111 |
Detected timeout error. |
和监视对象通信超时。 |
可执行是OS处于高负荷状态。请确认。 |
(别表) |
警告 |
112 |
Can not found install path. (install path=%1) |
找不到安装路径。
%1:安装路径。
|
请确认安装路径所在的位置。 |
(别表) |
警告 |
113 |
Can not found library. (libpath=%1, errno=%2) |
不能从指定的位置加载库。
%1中含有库路径。
|
请确认库所在的位置。 |
(别表) |
警告 |
171 |
Detected a monitor delay in monitoring %1. (timeout=%2*%3 actual-time=%4 delay warning rate=%5) |
%1的监视中检测到监视延迟。当前的超时值为%2(秒) x%3(每秒的tick count)。延迟检测时的实测值为%4(tick count),超出了延迟警告比率%5(%)。 |
请确认查出监视延迟的服务器负载情况并清除负载。
可执行查出监视超时时,需延长监视超时。
|
(别表) |
信息 |
181 |
The collecting of detailed information triggered by monitor resource %1 error has been started (timeout=%2). |
开始采集监视资源检测到$1监视异常时的详细信息。超时为%2秒。 |
- |
(别表) |
信息 |
182 |
The collection of detailed information triggered by monitor resource %1 error has been completed. |
完成采集监视资源检测到%1监视异常时的详细信息。 |
- |
(别表) |
警告 |
183 |
The collection of detailed information triggered by monitor resource %1 error has been failed (%2). |
监视资源检测到%1监视异常时的详细信息采集失败。(%2) |
- |
(别表) |
警告 |
189 |
Internal error. (status=%1) |
查出了内部错误。 |
- |
(别表) |
警告 |
190 |
Init error. [%1, ret=%2] |
初始化中检查出异常。
%1中加入
license,library, XML,share memory,log其中一个。
|
可执行是OS处于高负荷状态。请确认。 |
(别表) |
警告 |
190 |
Get config information error. [ret=%1] |
获取设置信息失败。 |
请在Cluster WebUI上确认集群配置信息。 |
(别表) |
警告 |
190 |
Invalid parameter. |
Config文件/Policy文件的设置信息不正确。
命令的参数不正确。
|
请在Cluster WebUI上确认集群配置信息。 |
(别表) |
警告 |
190 |
Init function error. [%1, ret=%2] |
初始化中检查出函数异常。
%1:执行函数名称
|
可执行是OS处于高负荷状态。请确认。 |
(别表) |
警告 |
190 |
User was not superuser. |
用户没有Root权限。 |
可执行是执行用户没有root权限,或内存不足或OS的资源不足。请确认。 |
(别表) |
警告 |
190 |
The license is not registered. |
License未注册。 |
请确认注册了正确的license。 |
(别表) |
警告 |
190 |
The registration license overlaps. |
注册的License重复了。 |
请确认注册了正确的license。 |
(别表) |
警告 |
190 |
The license is invalid. |
License不正确。 |
请确认注册了正确的license。 |
(别表) |
警告 |
190 |
The license of trial expired by %1. |
试用版的License已过期。
在%1中,加入使用期限。
|
- |
(别表) |
警告 |
190 |
The license of trial effective from %1. |
试用版的License还未到试用开始时间。
在%1中,加入使用期限。
|
- |
4.5. JVM监视资源输出日志消息
以下消息为JVM监视资源独有的日志文件——JVM操作日志,JVM LB联动日志的消息列表。
4.5.1. JVM操作日志
消息 |
发生原因 |
处理方法 |
|---|---|---|
Failed to write the %1$s.stat. |
JVM统计日志写入失败。
%1$s.stat:JVM统计日志文件名
|
请确认磁盘剩余空间是否足够。 |
%1$s: analyze finish[%4$s]. state = %2$s, cause = %3$s |
(监视对象Java VM状态异常时)监视对象Java VM的资源使用量超过阈值。
%1$s:监视对象Java VM名称
%2$s:监视对象Java VM状态
(1=正常,0=异常)
%3$s:发生异常时的错误部分
%4$s:测量线程名
|
请修改在监视对象Java VM上运行的Java应用程序。 |
thread stopped by UncaughtException. |
JVM监视资源的线程已停止。 |
请执行集群挂起/集群复原,重新启动JVM监视资源。 |
thread wait stopped by Exception. |
JVM监视资源的线程已停止。 |
请执行集群挂起/集群复原,重新启动JVM监视资源。 |
%1$s: monitor thread can't connect to JVM. |
无法连接监视对象Java VM。
%1$s:监视对象Java VM名称
|
请确认监视对象Java VM是否已启动。 |
%1$s: monitor thread can't get the JVM state. |
无法从监视对象Java VM获取资源使用量。
%1$s:监视对象Java VM名称
|
请确认监视对象Java VM是否已启动。 |
%1$s: JVM state is changed [abnormal -> normal]. |
监视对象Java VM状态由异常变为正常。
%1$s:监视对象Java VM名称
|
- |
%1$s: JVM state is changed [normal -> abnormal]. |
监视对象Java VM状态由正常变为异常。
%1$s:监视对象Java VM名称
|
请修改在监视对象Java VM上运行的Java应用程序。 |
%1$s: Failed to connect to JVM. |
无法连接监视对象Java VM。
%1$s:监视对象Java VM名称
|
请确认监视对象Java VM是否已启动。 |
Failed to write exit code. |
JVM监视资源无法写入记录退出代码的文件。 |
请确认磁盘剩余空间是否足够。 |
Failed to be started JVM Monitor. |
启动JVM监视资源失败。 |
请确认JVM操作日志,消除无法启动的原因后,执行集群挂起/集群复原,重新启动JVM监视资源。 |
JVM Monitor already started. |
JVM监视资源已启动。 |
请执行集群挂起/集群复原,重新启动JVM监视资源。 |
%1$s: GARBAGE_COLLECTOR
_MXBEAN_DOMAIN_TYPE is invalid.
|
从监视对象Java VM获取GC信息失败。
%1$s:监视对象Java VM名称
|
请确认监视对象Java VM的操作环境是否正确。 |
%1$s: GarbageCollectorMXBean is invalid. |
从监视对象Java VM获取GC信息失败。
%1$s:监视对象Java VM名称
|
请确认监视对象Java VM的操作环境是否正确。 |
%1$s: Failed to measure the GC stat. |
从监视对象Java VM获取GC信息失败。
%1$s:监视对象Java VM名称
|
请确认监视对象Java VM的操作环境是否正确。 |
%1$s: GC stat is invalid. last.getCount = %2$s, last.getTime = %3$s, now.getCount = %4$s, now.getTime = %5$s. |
从监视对象Java VM获取GC发生次数,测量执行时间失败。
%1$s:监视对象Java VM名称
%2$s:上次测量时的GC发生次数
%3$s:上次测量时的GC总执行时间
%4$s:此次测量时的GC发生次数
%5$s:此次测量时的GC总执行时间
|
请确认监视对象Java VM的操作环境是否正确。 |
%1$s: GC average time is too long. av = %6$s, last.getCount = %2$s, last.getTime = %3$s, now.getCount = %4$s, now.getTime = %5$s. |
监视对象Java VM中GC的平均执行时间超过阈值。
%1$s:监视对象Java VM名称
%2$s:上次测量时的GC发生次数
%3$s:上次测量时的GC总执行时间
%4$s:此次测量时的GC发生次数
%5$s:此次测量时的GC总执行时间
%6$s:上次测量到此次测量之间,GC的平均执行时间
|
请修改在监视对象Java VM上运行的Java应用程序。 |
%1$s: GC average time is too long compared with the last connection. av = %6$s, last.getCount = %2$s, last.getTime = %3$s, now.getCount = %4$s, now.getTime = %5$s. |
重新连接监视对象Java VM后,监视对象Java VM中,GC的平均执行时间超过阈值。
%1$s:监视对象Java VM名称
%2$s:上次测量时的GC发生次数
%3$s:上次测量时的GC总执行时间
%4$s:此次测量时的GC发生次数
%5$s:此次测量时的GC总执行时间
%6$s:上次测量到此次测量之间,GC的平均执行时间
|
请修改在监视对象Java VM上运行的Java应用程序。 |
%1$s: GC count is too frequently. count = %4$s last.getCount = %2$s, now.getCount = %3$s. |
监视对象Java VM中GC的发生次数超过阈值。
%1$s:监视对象Java VM名称
%2$s:上次测量时的GC发生次数
%3$s:此次测量时的GC发生次数
%4$s:上次测量到此次测量之间的GC发生次数
|
请修改在监视对象Java VM上运行的Java应用程序。 |
%1$s: GC count is too frequently compared with the last connection. count = %4$s last.getCount = %2$s, now.getCount = %3$s. |
重新连接监视对象Java VM后,监视对象Java VM中,GC的发生次数超过阈值。
%1$s:监视对象Java VM名称
%2$s:上次测量时的GC发生次数
%3$s:此次测量时的GC发生次数
%4$s:上次测量到此次测量之间的GC发生次数
|
请修改在监视对象Java VM上运行的Java应用程序。 |
%1$s: RuntimeMXBean is invalid. |
从监视对象Java VM获取信息失败。
%1$s:监视对象Java VM名称
|
请确认监视对象Java VM的操作环境是否正确。 |
%1$s: Failed to measure the runtime stat. |
从监视对象Java VM获取信息失败。
%1$s:监视对象Java VM名称
|
请确认监视对象Java VM的操作环境是否正确。
请确认监视对象Java VM中,处理负载是否过高。
|
%1$s: MEMORY_MXBEAN_NAME is invalid. %2$s, %3$s. |
从监视对象Java VM获取内存信息失败。
%1$s:监视对象Java VM名称
%2$s:内存池的名称
%3$s:内存的名称
|
请确认监视对象Java VM的操作环境是否正确。 |
%1$s: MemoryMXBean is invalid. |
从监视对象Java VM获取内存信息失败。
%1$s:监视对象Java VM名称
|
请确认监视对象Java VM的操作环境是否正确。 |
%1$s: Failed to measure the memory stat. |
从监视对象Java VM获取内存信息失败。
%1$s:监视对象Java VM名称
|
请确认监视对象Java VM的操作环境是否正确。
请确认监视对象Java VM中,处理负载是否过高。
|
%1$s: MemoryPool name is undefined. memory_name = %2$s. |
无法从监视对象Java VM获取内存信息。
%1$s:监视对象Java VM名称
%2$s:测量对象的Java内存池名称
|
请确认监视对象Java VM的操作环境是否正确。 |
%1$s: MemoryPool capacity is too little. memory_name = %2$s, used = %3$s, max = %4$s, ratio = %5$s%. |
监视对象Java VM的Java内存池剩余空间小于阈值。
%1$s:监视对象Java VM名称
%2$s:测量对象的Java内存池名称
%3$s:Java内存池的使用量
%4$s:Java内存池的最大使用量
%5$s:Java内存池的利用率
|
请修改在监视对象Java VM上运行的Java应用程序。 |
%1$s: THREAD_MXBEAN_NAME is invalid. |
从监视对象Java VM获取线程信息失败。
%1$s:监视对象Java VM名称
|
请确认监视对象Java VM的操作环境是否正确。 |
%1$s: ThreadMXBean is invalid. |
从监视对象Java VM获取线程信息失败。
%1$s:监视对象Java VM名称
|
请确认监视对象Java VM的操作环境是否正确。 |
%1$s: Failed to measure the thread stat. |
从监视对象Java VM获取线程信息失败。
%1$s:监视对象Java VM名称
|
请确认监视对象Java VM的操作环境是否正确。 |
%1$s: Detect Deadlock. threads = %2$s. |
监视对象Java VM的线程发生死锁。
%1$s:监视对象Java VM名称
%2$s:死锁的线程ID
|
请修改在监视对象Java VM上运行的Java应用程序。 |
%1$s: Thread count is too much(%2$s). |
监视对象Java VM中启动的线程数超过阈值。
%1$s:监视对象Java VM名称
%2$s:测量时的线程启动数
|
请修改在监视对象Java VM上运行的Java应用程序。 |
%1$s: ThreadInfo is null.Thread count = %2$s. |
从监视对象Java VM获取线程信息失败。
%1$s:监视对象Java VM名称
%2$s:测量时的线程启动数
|
请确认监视对象Java VM的版本的操作环境是否正确。 |
%1$s: Failed to disconnect. |
切断监视对象Java VM失败。
%1$s:监视对象Java VM名称
|
- |
%1$s: Failed to connect to WebLogicServer. |
连接监视对象WebLogic Server失败。
%1$s:监视对象Java VM名称
|
请修改在监视对象WebLogic Server上运行的Java应用程序。 |
%1$s: Failed to connect to Sun JVM. |
连接监视对象Java VM,WebOTX失败。
%1$s:监视对象Java VM名称
|
请修改在监视对象Java VM,WebOTX上运行的Java应用程序。 |
Failed to open the %1$s. |
输出JVM统计日志失败。
%1$s:HA/JVMSaverJVM 统计日志文件名称
|
请确认磁盘剩余空间是否足够,是否超出能打开文件的上限数。 |
%1$s: Can't find monitor file. |
无法监视。
%1$s:监视对象Java VM名称
|
- |
%1$s: Can't find monitor file, monitor stopped[thread:%2$s]. |
停止监视。
%1$s:监视对象Java VM名称
%2$s:测量线程的类型
|
- |
%1$s: Failed to create monitor status file. |
创建内部文件失败。
%1$s:监视对象Java VM名称
|
请确认是否超出磁盘剩余空间或卷的最大文件数。 |
%1$s: Failed to delete monitor status file. |
删除内部文件失败。
%1$s:监视对象Java VM名称
|
请确认硬盘是否有问题。 |
%1$s: com.bea:Type=ServerRuntime is invalid. |
从监视对象Java VM获取信息失败。
%1$s:监视对象Java VM名称
|
请确认监视对象Java VM的操作环境是否正确。 |
%1$s: WorkManagerRuntimeMBean or ThreadPoolRuntimeMBean is invalid. |
从监视对象WebLogic Server获取信息失败。
%1$s:监视对象Java VM名称
|
请确认监视对象WebLogic Server的操作环境是否正确。 |
%1$s: Failed to measure the WorkManager or ThreadPool stat. |
从监视对象WebLogic Server获取信息失败。
%1$s:监视对象Java VM名称
|
请确认监视对象WebLogic Server的操作环境是否正确。 |
%1$s: ThreadPool stat is invalid. last.pending = %2$s, now.pending = %3$s. |
测量监视对象WebLogic Server线程池的待机请求数失败。
%1$s:监视对象Java VM名称
%2$s:上次测量时的待机请求数
%3$s:此次测量时的待机请求数
|
请确认监视对象WebLogic Server版本的操作环境是否正确。 |
%1$s: WorkManager stat is invalid. last.pending = %2$s, now.pending = %3$s. |
测量监视对象WebLogic Server运行管理的待机请求数失败。
%1$s:监视对象Java VM名称
%2$s:上次测量时的待机请求数
%3$s:此次测量时的待机请求数
|
请确认监视对象WebLogic Server版本的操作环境是否正确。 |
%1$s: PendingRequest count is too much. count = %2$s. |
监视对象WebLogic Server线程池的待机请求数超过阈值。
%1$s:监视对象Java VM名称
%2$s:此次测量时的待机请求数
|
请修改在监视对象WebLogic Server上运行的Java应用程序。 |
%1$s: PendingRequest increment is too much. increment = %4$s%%, last.pending = %2$s, now.pending = %3$s. |
监视对象WebLogic Server线程池的待机请求数增量超过阈值。
%1$s:监视对象Java VM名称
%2$s:上次测量时的待机请求数
%3$s:此次测量时的待机请求数
%4$s:上次测量到此次测量之间,待机请求数的增量
|
请修改在监视对象WebLogic Server上运行的Java应用程序。 |
%1$s: PendingRequest increment is too much compared with the last connection. increment = %4$s, last.pending = %2$s, now.pending = %3$s. |
与监视对象WebLogic Server重新连接后,监视对象WebLogic Server线程池的待机请求数增量超过阈值。
%1$s:监视对象Java VM名称
%2$s:上次测量时的待机请求数
%3$s:此次测量时的待机请求数
%4$s:上次测量到此次测量之间,待机请求数的增量
|
请修改在监视对象WebLogic Server上运行的Java应用程序。 |
%1$s: Throughput count is too much. count = %2$s. |
监视对象WebLogic Server线程池在单位时间内执行的请求数超过阈值。
%1$s:监视对象Java VM名称
%2$s:此次测量时在单位时间内执行的请求数
|
请修改在监视对象WebLogic Server上运行的Java应用程序。 |
%1$s: Throughput increment is too much. increment = %4$s, last.throughput = %2$s, now.throughput = %3$s. |
监视对象WebLogic Server线程池在单位时间内执行的请求数增量超过阈值。
%1$s:监视对象Java VM名称
%2$s:上次测量时在单位时间内执行的请求数
%3$s:此次测量时在单位时间内执行的请求数
%4$s:上次测量到此次测量之间,单位时间内执行请求数的增量
|
请修改在监视对象WebLogic Server上运行的Java应用程序。 |
%1$s: Throughput increment is too much compared with the last connection. increment = %4$s, last.throughput = %2$s, now.throughput = %3$s. |
与监视对象WebLogic Server重新连接后,监视对象WebLogic Server线程池在单位时间内执行请求数的增量超过阈值。
%1$s:监视对象Java VM名称
%2$s:上次测量时在单位时间内执行的请求数
%3$s:此次测量时在单位时间内执行的请求数
%4$s:上次测量到此次测量之间,单位时间内执行请求数的增量
|
请修改在监视对象WebLogic Server上运行的Java应用程序。 |
%1$s: PendingRequest count is too much. appName = %2$s, name = %3$s, count = %4$s. |
监视对象WebLogic Server运行管理的待机请求数超过阈值。
%1$s:监视对象Java VM名称
%2$s:应用程序名
%3$s:运行管理名
%4$s:待机请求数
|
请修改在监视对象WebLogic Server上运行的Java应用程序。 |
%1$s: PendingRequest increment is too much. appName = %2$s, name = %3$s, increment = %6$s%%, last.pending = %4$s, now.pending = %5$s. |
监视对象WebLogic Server运行管理的待机请求增量超过阈值。
%1$s:监视对象Java VM名称
%2$s:应用程序名
%3$s:运行管理名
%4$s:上次测量时的待机请求数
%5$s:此次测量时的待机请求数
%6$s:上次测量到此次测量之间,待机请求数的增量
|
请修改在监视对象WebLogic Server上运行的Java应用程序。 |
%1$s: PendingRequest increment is too much compared with the last connection. AppName = %2$s, Name = %3$s, increment = %6$s, last.pending = %4$s, now.pending = %5$s. |
与监视对象WebLogic Server重新连接后,监视对象WebLogic Server运行管理的待机请求增量超过阈值。
%1$s:监视对象Java VM名称
%2$s:应用程序名
%3$s:运行管理名
%4$s:上次测量时的待机请求数
%5$s:此次测量时的待机请求数
%6$s:上次测量到此次测量之间,待机请求数的增量
|
请修改在监视对象WebLogic Server上运行的Java应用程序。 |
%1$s: Can't find WorkManager. appName = %2$s, name = %3$s. |
无法从WebLogic Server获取已设置的运行管理。
%1$s:监视对象Java VM名称
%2$s:应用程序名
%3$s:运行管理名
|
请修改[监视对象WebLogic的运行管理]的设置。 |
%1$s: analyze of average start[%2$s]. |
平均值分析已开始。
%1$s:监视对象Java VM名称
%2$s:线程名
|
- |
%1$s: analyze of average finish[%2$s].state = %3$s. |
平均值分析已结束。
%1$s:监视对象Java VM名称
%2$s:线程名
%3$s:监视对象的状态
|
- |
%1$s: Average of PendingRequest count is too much. count = %2$s. |
监视对象WebLogic Server线程池的待机请求数的平均值超过阈值。
%1$s:监视对象Java VM名称
%2$s:此次测量时的待机请求数
|
请修改在监视对象WebLogic Server上运行的Java应用程序。 |
%1$s: Average of Throughput count is too much. count = %2$s. |
监视对象WebLogic Server线程池在单位时间内执行的请求数平均值超过阈值。
%1$s:监视对象Java VM名称
%2$s:此次测量时在单位时间内执行的请求数
|
请修改在监视对象WebLogic Server上运行的Java应用程序。 |
%1$s: Average of PendingRequest count is too much. AppName = %2$s, Name = %3$s, count = %4$s. |
监视对象WebLogic Server运行管理的待机请求数平均值超过阈值。
%1$s:监视对象Java VM名称
%2$s:应用程序名
%3$s:运行管理名
%4$s:此次测量时的待机请求数
|
请修改在监视对象WebLogic Server上运行的Java应用程序。 |
Error: Failed to operate clpjra_bigip.[%1$s] |
%1$s:error code |
请重新设定内容。 |
action thread execution did not finish. action is alive = %1$s. |
[命令]超时。
%1$s:[命令]设定的执行文件名
|
请强制结束[命令]。
请修改[命令超时]。
请排除高负荷等超时原因。
|
%1$s: Failed to connect to Local JVM. cause = %2$s. |
与Jboss的连接失败。
%1$s:监视对象名
%2$s:失败的详细原因
详细原因为以下的某个。
・Failed to found tool.jar, please set jdk's path for the java path.
・Load tool.jar exception
・Get Local JVM url path exception
・Failed to get process name
・Failed to connect to JBoss JVM.
|
请修正[Java安装路径],[进程名]。
[Java安装路径]中请设定JDK,而不是JRE。
请确认JBoss是否启动。
|
4.5.2. JVM LB联动日志
消息 |
发生原因 |
处理方法 |
|---|---|---|
Failed to write the %1$s.stat. |
JVM统计日志写入失败。
%1$s.stat:JVM统计日志文件名
|
请确认磁盘剩余空间是否足够。 |
%1$s: analyze finish[%4$s]. state = %2$s, cause = %3$s |
(监视对象Java VM状态异常时)监视对象Java VM的资源使用量超过阈值。
%1$s:监视对象Java VM名称
%2$s:监视对象Java VM状态
(1=正常,0=异常)
%3$s:发生异常时的错误部分
%4$s:测量线程名
|
请修改在监视对象Java VM上运行的Java应用程序。 |
thread stopped by UncaughtException. |
JVM监视资源的线程已停止。 |
请执行集群挂起/集群复原,重新启动JVM监视资源。 |
thread wait stopped by Exception. |
JVM监视资源的线程已停止。 |
请执行集群挂起/集群复原,重新启动JVM监视资源。 |
%1$s: monitor thread can't connect to JVM. |
无法连接监视对象Java VM。
%1$s:监视对象Java VM名称
|
请确认监视对象Java VM是否已启动。 |
%1$s: monitor thread can't get the JVM state. |
无法从监视对象Java VM获取资源使用量。
%1$s:监视对象Java VM名称
|
请确认监视对象Java VM是否已启动。 |
%1$s: JVM state is changed [abnormal -> normal]. |
监视对象Java VM状态由异常变为正常。
%1$s:监视对象Java VM名称
|
- |
%1$s: JVM state is changed [normal -> abnormal]. |
监视对象Java VM状态由正常变为异常。
%1$s:监视对象Java VM名称
|
请修改在监视对象Java VM上运行的Java应用程序。 |
%1$s: Failed to connect to JVM. |
无法连接监视对象Java VM。
%1$s:监视对象Java VM名称
|
请确认监视对象Java VM是否已启动。 |
Failed to write exit code. |
JVM监视资源无法写入记录退出代码的文件。 |
请确认磁盘剩余空间是否足够。 |
Failed to be started JVM Monitor. |
启动JVM监视资源失败。 |
请确认JVM操作日志,消除无法启动的原因后,执行集群挂起/集群复原,重新启动JVM监视资源。 |
JVM Monitor already started. |
JVM监视资源已启动。 |
请执行集群挂起/集群复原,重新启动JVM监视资源。 |
%1$s: GARBAGE_COLLECTOR _MXBEAN_DOMAIN_TYPE is invalid. |
从监视对象Java VM获取GC信息失败。
%1$s:监视对象Java VM名称
|
请确认监视对象Java VM的操作环境是否正确。 |
%1$s: GarbageCollectorMXBean is invalid. |
从监视对象Java VM获取GC信息失败。
%1$s:监视对象Java VM名称
|
请确认监视对象Java VM的操作环境是否正确。 |
%1$s: Failed to measure the GC stat. |
从监视对象Java VM获取GC信息失败。
%1$s:监视对象Java VM名称
|
请确认监视对象Java VM的操作环境是否正确。 |
%1$s: GC stat is invalid. last.getCount = %2$s, last.getTime = %3$s, now.getCount = %4$s, now.getTime = %5$s. |
从监视对象Java VM获取GC发生次数,测量执行时间失败。
%1$s:监视对象Java VM名称
%2$s:上次测量时的GC发生次数
%3$s:上次测量时的GC总执行时间
%4$s:此次测量时的GC发生次数
%5$s:此次测量时的GC总执行时间
|
请确认监视对象Java VM的操作环境是否正确。 |
%1$s: GC average time is too long. av = %6$s, last.getCount = %2$s, last.getTime = %3$s, now.getCount = %4$s, now.getTime = %5$s. |
监视对象Java VM中GC的平均执行时间超过阈值。
%1$s:监视对象Java VM名称
%2$s:上次测量时的GC发生次数
%3$s:上次测量时的GC总执行时间
%4$s:此次测量时的GC发生次数
%5$s:此次测量时的GC总执行时间
%6$s:上次测量到此次测量之间,GC的平均执行时间
|
请修改在监视对象Java VM上运行的Java应用程序。 |
%1$s: GC average time is too long compared with the last connection. av = %6$s, last.getCount = %2$s, last.getTime = %3$s, now.getCount = %4$s, now.getTime = %5$s. |
重新连接监视对象Java VM后,监视对象Java VM中,GC的平均执行时间超过阈值。
%1$s:监视对象Java VM名称
%2$s:上次测量时的GC发生次数
%3$s:上次测量时的GC总执行时间
%4$s:此次测量时的GC发生次数
%5$s:此次测量时的GC总执行时间
%6$s:上次测量到此次测量之间,GC的平均执行时间
|
请修改在监视对象Java VM上运行的Java应用程序。 |
%1$s: GC count is too frequently. count = %4$s last.getCount = %2$s, now.getCount = %3$s. |
监视对象Java VM中GC的发生次数超过阈值。
%1$s:监视对象Java VM名称
%2$s:上次测量时的GC发生次数
%3$s:此次测量时的GC发生次数
%4$s:上次测量到此次测量之间的GC发生次数
|
请修改在监视对象Java VM上运行的Java应用程序。 |
%1$s: GC count is too frequently compared with the last connection. count = %4$s last.getCount = %2$s, now.getCount = %3$s. |
重新连接监视对象Java VM后,监视对象Java VM中,GC的发生次数超过阈值。
%1$s:监视对象Java VM名称
%2$s:上次测量时的GC发生次数
%3$s:此次测量时的GC发生次数
%4$s:上次测量到此次测量之间的GC发生次数
|
请修改在监视对象Java VM上运行的Java应用程序。 |
%1$s: RuntimeMXBean is invalid. |
从监视对象Java VM获取信息失败。
%1$s:监视对象Java VM名称
|
请确认监视对象Java VM的操作环境是否正确。 |
%1$s: Failed to measure the runtime stat. |
从监视对象Java VM获取信息失败。
%1$s:监视对象Java VM名称
|
请确认监视对象Java VM的操作环境是否正确。
请确认监视对象Java VM中,处理负载是否过高。
|
%1$s: MEMORY_MXBEAN_NAME is invalid. %2$s, %3$s. |
从监视对象Java VM获取内存信息失败。
%1$s:监视对象Java VM名称
%2$s:内存池的名称
%3$s:内存的名称
|
请确认监视对象Java VM的操作环境是否正确。 |
%1$s: MemoryMXBean is invalid. |
从监视对象Java VM获取内存信息失败。
%1$s:监视对象Java VM名称
|
请确认监视对象Java VM的操作环境是否正确。 |
%1$s: Failed to measure the memory stat. |
从监视对象Java VM获取内存信息失败。
%1$s:监视对象Java VM名称
|
请确认监视对象Java VM的操作环境是否正确。
请确认监视对象Java VM中,处理负载是否过高。
|
%1$s: MemoryPool name is undefined. memory_name = %2$s. |
无法从监视对象Java VM获取内存信息。
%1$s:监视对象Java VM名称
%2$s:测量对象的Java内存池名称
|
请确认监视对象Java VM的操作环境是否正确。 |
%1$s: MemoryPool capacity is too little. memory_name = %2$s, used = %3$s, max = %4$s, ratio = %5$s%. |
监视对象Java VM的Java内存池剩余空间小于阈值。
%1$s:监视对象Java VM名称
%2$s:测量对象的Java内存池名称
%3$s:Java内存池的使用量
%4$s:Java内存池的最大使用量
%5$s:Java内存池的利用率
|
请修改在监视对象Java VM上运行的Java应用程序。 |
%1$s: THREAD_MXBEAN_NAME is invalid. |
从监视对象Java VM获取线程信息失败。
%1$s:监视对象Java VM名称
|
请确认监视对象Java VM的操作环境是否正确。 |
%1$s: ThreadMXBean is invalid. |
从监视对象Java VM获取线程信息失败。
%1$s:监视对象Java VM名称
|
请确认监视对象Java VM的操作环境是否正确。 |
%1$s: Failed to measure the thread stat. |
从监视对象Java VM获取线程信息失败。
%1$s:监视对象Java VM名称
|
请确认监视对象Java VM的操作环境是否正确。 |
%1$s: Detect Deadlock. threads = %2$s. |
监视对象Java VM的线程发生死锁。
%1$s:监视对象Java VM名称
%2$s:死锁的线程ID
|
请修改在监视对象Java VM上运行的Java应用程序。 |
%1$s: Thread count is too much(%2$s). |
监视对象Java VM中启动的线程数超过阈值。
%1$s:监视对象Java VM名称
%2$s:测量时的线程启动数
|
请修改在监视对象Java VM上运行的Java应用程序。 |
%1$s: ThreadInfo is null.Thread count = %2$s. |
从监视对象Java VM获取线程信息失败。
%1$s:监视对象Java VM名称
%2$s:测量时的线程启动数
|
请确认监视对象Java VM的版本的操作环境是否正确。 |
%1$s: Failed to disconnect. |
切断监视对象Java VM失败。
%1$s:监视对象Java VM名称
|
- |
%1$s: Failed to connect to WebLogicServer. |
连接监视对象WebLogic Server失败。
%1$s:监视对象Java VM名称
|
请修改在监视对象WebLogic Server上运行的Java应用程序。 |
%1$s: Failed to connect to Sun JVM. |
连接监视对象Java VM,WebOTX失败。
%1$s:监视对象Java VM名称
|
请修改在监视对象Java VM,WebOTX上运行的Java应用程序。 |
Failed to open the %1$s. |
输出JVM统计日志失败。
%1$s:HA/JVMSaverJVM 统计日志文件名称
|
请确认磁盘剩余空间是否足够,是否超出能打开文件的上限数。 |
%1$s: Can't find monitor file. |
无法监视。
%1$s:监视对象Java VM名称
|
- |
%1$s: Can't find monitor file, monitor stopped[thread:%2$s]. |
停止监视。
%1$s:监视对象Java VM名称
%2$s:测量线程的类型
|
- |
%1$s: Failed to create monitor status file. |
创建内部文件失败。
%1$s:监视对象Java VM名称
|
请确认是否超出磁盘剩余空间或卷的最大文件数。 |
%1$s: Failed to delete monitor status file. |
删除内部文件失败。
%1$s:监视对象Java VM名称
|
请确认硬盘是否有问题。 |
%1$s: com.bea:Type=ServerRuntime is invalid. |
从监视对象Java VM获取信息失败。
%1$s:监视对象Java VM名称
|
请确认监视对象Java VM的操作环境是否正确。 |
%1$s: WorkManagerRuntimeMBean or ThreadPoolRuntimeMBean is invalid. |
从监视对象WebLogic Server获取信息失败。
%1$s:监视对象Java VM名称
|
请确认监视对象WebLogic Server的操作环境是否正确。 |
%1$s: Failed to measure the WorkManager or ThreadPool stat. |
从监视对象WebLogic Server获取信息失败。
%1$s:监视对象Java VM名称
|
请确认监视对象WebLogic Server的操作环境是否正确。 |
%1$s: ThreadPool stat is invalid. last.pending = %2$s, now.pending = %3$s. |
测量监视对象WebLogic Server线程池的待机请求数失败。
%1$s:监视对象Java VM名称
%2$s:上次测量时的待机请求数
%3$s:此次测量时的待机请求数
|
请确认监视对象WebLogic Server版本的操作环境是否正确。 |
%1$s: WorkManager stat is invalid. last.pending = %2$s, now.pending = %3$s. |
测量监视对象WebLogic Server运行管理的待机请求数失败。
%1$s:监视对象Java VM名称
%2$s:上次测量时的待机请求数
%3$s:此次测量时的待机请求数
|
请确认监视对象WebLogic Server版本的操作环境是否正确。 |
%1$s: PendingRequest count is too much. count = %2$s. |
监视对象WebLogic Server线程池的待机请求数超过阈值。
%1$s:监视对象Java VM名称
%2$s:此次测量时的待机请求数
|
请修改在监视对象WebLogic Server上运行的Java应用程序。 |
%1$s: PendingRequest increment is too much. increment = %4$s%%, last.pending = %2$s, now.pending = %3$s. |
监视对象WebLogic Server线程池的待机请求数增量超过阈值。
%1$s:监视对象Java VM名称
%2$s:上次测量时的待机请求数
%3$s:此次测量时的待机请求数
%4$s:上次测量到此次测量之间,待机请求数的增量
|
请修改在监视对象WebLogic Server上运行的Java应用程序。 |
%1$s: PendingRequest increment is too much compared with the last connection. increment = %4$s, last.pending = %2$s, now.pending = %3$s. |
与监视对象WebLogic Server重新连接后,监视对象WebLogic Server线程池的待机请求数增量超过阈值。
%1$s:监视对象Java VM名称
%2$s:上次测量时的待机请求数
%3$s:此次测量时的待机请求数
%4$s:上次测量到此次测量之间,待机请求数的增量
|
请修改在监视对象WebLogic Server上运行的Java应用程序。 |
%1$s: Throughput count is too much. count = %2$s. |
监视对象WebLogic Server线程池在单位时间内执行的请求数超过阈值。
%1$s:监视对象Java VM名称
%2$s:此次测量时在单位时间内执行的请求数
|
请修改在监视对象WebLogic Server上运行的Java应用程序。 |
%1$s: Throughput increment is too much. increment = %4$s, last.throughput = %2$s, now.throughput = %3$s. |
监视对象WebLogic Server线程池在单位时间内执行的请求数增量超过阈值。
%1$s:监视对象Java VM名称
%2$s:上次测量时在单位时间内执行的请求数
%3$s:此次测量时在单位时间内执行的请求数
%4$s:上次测量到此次测量之间,单位时间内执行请求数的增量
|
请修改在监视对象WebLogic Server上运行的Java应用程序。 |
%1$s: Throughput increment is too much compared with the last connection. increment = %4$s, last.throughput = %2$s, now.throughput = %3$s. |
与监视对象WebLogic Server重新连接后,监视对象WebLogic Server线程池在单位时间内执行请求数的增量超过阈值。
%1$s:监视对象Java VM名称
%2$s:上次测量时在单位时间内执行的请求数
%3$s:此次测量时在单位时间内执行的请求数
%4$s:上次测量到此次测量之间,单位时间内执行请求数的增量
|
请修改在监视对象WebLogic Server上运行的Java应用程序。 |
%1$s: PendingRequest count is too much. appName = %2$s, name = %3$s, count = %4$s. |
监视对象WebLogic Server运行管理的待机请求数超过阈值。
%1$s:监视对象Java VM名称
%2$s:应用程序名
%3$s:运行管理名
%4$s:待机请求数
|
请修改在监视对象WebLogic Server上运行的Java应用程序。 |
%1$s: PendingRequest increment is too much. appName = %2$s, name = %3$s, increment = %6$s%%, last.pending = %4$s, now.pending = %5$s. |
监视对象WebLogic Server运行管理的待机请求增量超过阈值。
%1$s:监视对象Java VM名称
%2$s:应用程序名
%3$s:运行管理名
%4$s:上次测量时的待机请求数
%5$s:此次测量时的待机请求数
%6$s:上次测量到此次测量之间,待机请求数的增量
|
请修改在监视对象WebLogic Server上运行的Java应用程序。 |
%1$s: PendingRequest increment is too much compared with the last connection. AppName = %2$s, Name = %3$s, increment = %6$s, last.pending = %4$s, now.pending = %5$s. |
与监视对象WebLogic Server重新连接后,监视对象WebLogic Server运行管理的待机请求增量超过阈值。
%1$s:监视对象Java VM名称
%2$s:应用程序名
%3$s:运行管理名
%4$s:上次测量时的待机请求数
%5$s:此次测量时的待机请求数
%6$s:上次测量到此次测量之间,待机请求数的增量
|
请修改在监视对象WebLogic Server上运行的Java应用程序。 |
%1$s: Can't find WorkManager. appName = %2$s, name = %3$s. |
无法从WebLogic Server获取已设置的运行管理。
%1$s:监视对象Java VM名称
%2$s:应用程序名
%3$s:运行管理名
|
请修改[监视对象WebLogic的运行管理]的设置。 |
%1$s: analyze of average start[%2$s]. |
平均值分析已开始。
%1$s:监视对象Java VM名称
%2$s:线程名
|
- |
%1$s: analyze of average finish[%2$s].state = %3$s. |
平均值分析已结束。
%1$s:监视对象Java VM名称
%2$s:线程名
%3$s:监视对象的状态
|
- |
%1$s: Average of PendingRequest count is too much. count = %2$s. |
监视对象WebLogic Server线程池的待机请求数的平均值超过阈值。
%1$s:监视对象Java VM名称
%2$s:此次测量时的待机请求数
|
请修改在监视对象WebLogic Server上运行的Java应用程序。 |
%1$s: Average of Throughput count is too much. count = %2$s. |
监视对象WebLogic Server线程池在单位时间内执行的请求数平均值超过阈值。
%1$s:监视对象Java VM名称
%2$s:此次测量时在单位时间内执行的请求数
|
请修改在监视对象WebLogic Server上运行的Java应用程序。 |
%1$s: Average of PendingRequest count is too much. AppName = %2$s, Name = %3$s, count = %4$s. |
监视对象WebLogic Server运行管理的待机请求数平均值超过阈值。
%1$s:监视对象Java VM名称
%2$s:应用程序名
%3$s:运行管理名
%4$s:此次测量时的待机请求数
|
请修改在监视对象WebLogic Server上运行的Java应用程序。 |
Error: Failed to operate clpjra_bigip.[%1$s] |
%1$s:error code |
请重新设定内容。 |
action thread execution did not finish. action is alive = %1$s. |
[命令]超时。
%1$s:[命令]设定的执行文件名
|
请强制结束[命令]。
请修改[命令超时]。
请排除高负荷等超时原因。
|
%1$s: Failed to connect to Local JVM. cause = %2$s. |
与Jboss的连接失败。
%1$s:监视对象名
%2$s:失败的详细原因
详细原因为以下的某个。
・Failed to found tool.jar, please set jdk's path for the java path.
・Load tool.jar exception
・Get Local JVM url path exception
・Failed to get process name
・Failed to connect to JBoss JVM.
|
请修正[Java安装路径],[进程名]。
[Java安装路径]中请设定JDK,而不是JRE。
请确认JBoss是否启动。
|