1. Preface
1.1. Who Should Use This Guide
The EXPRESSCLUSTER X SingleServerSafe Legacy Feature Guide describes EXPRESSCLUSTER X SingleServerSafe 4.0 WebManager and Builder.
1.2. How This Guide Is Organized
2. Functions of the WebManager: Provides information on function of the EXPRESSCLUSTER WebManager.
3. Function of the Builder: Provides information on function of the EXPRESSCLUSTER Builder.
1.3. Terms Used in This Guide
EXPRESSCLUSTER X SingleServerSafe, which is described in this guide, uses windows and commands common to those of the clustering software EXPRESSCLUSTER X to ensure high compatibility with EXPRESSCLUSTER X in terms of operation and other aspects. Therefore, cluster-related terms are used in parts of the guide.
The terms used in this guide are defined below.
- Cluster, cluster system
A single server system using EXPRESSCLUSTER X SingleServerSafe
- Cluster shutdown, reboot
Shutdown or reboot of a system using EXPRESSCLUSTER X SingleServerSafe
- Cluster resource
A resource used in EXPRESSCLUSTER X SingleServerSafe
- Cluster object
A resource object used in EXPRESSCLUSTER X SingleServerSafe
- Failover group
A group of group resources (such as applications and services) used in EXPRESSCLUSTER X SingleServerSafe
1.4. EXPRESSCLUSTER X SingleServerSafe Documentation Set
The EXPRESSCLUSTER X SingleServerSafe manuals consist of the four guides below. The title and purpose of each guide is described below:
EXPRESSCLUSTER X SingleServerSafe Installation Guide
This guide is intended for system engineers who intend to introduce a system using EXPRESSCLUSTER X SingleServerSafe and describes how to install EXPRESSCLUSTER X SingleServerSafe.
EXPRESSCLUSTER X SingleServerSafe Configuration Guide
This guide is intended for system engineers who intend to introduce a system using EXPRESSCLUSTER X SingleServerSafe and system administrators who will operate and maintain the introduced system. It describes how to set up EXPRESSCLUSTER X SingleServerSafe.
EXPRESSCLUSTER X SingleServerSafe Operation Guide
This guide is intended for system administrators who will operate and maintain an introduced system that uses EXPRESSCLUSTER X SingleServerSafe. It describes how to operate EXPRESSCLUSTER X SingleServerSafe.
EXPRESSCLUSTER X SingleServerSafe Legacy Feature Guide
This guide is intended for system engineers who want to introduce systems using EXPRESSCLUSTER X SingleServerSafe and describes EXPRESSCLUSTER X SingleServerSafe 4.0 WebManager and Builder.
1.5. Conventions
In this guide, Note, Important, See also are used as follows:
Note
Used when the information given is important, but not related to the data loss and damage to the system and machine.
Important
Used when the information given is necessary to avoid the data loss and damage to the system and machine.
See also
Used to describe the location of the information given at the reference destination.
The following conventions are used in this guide.
Convention |
Usage |
Example |
|---|---|---|
Bold |
Indicates graphical objects, such as fields, list boxes, menu selections, buttons, labels, icons, etc. |
In User Name, type your name.
On the File menu, click Open Database.
|
Angled bracket within the command line |
Indicates that the value specified inside of the angled bracket can be omitted. |
|
Monospace (courier) |
Indicates path names, commands, system output (message, prompt, etc), directory, file names, functions and parameters. |
|
Monospace bold (courier) |
Indicates the value that a user actually enters from a command line. |
Enter the following:
clpcl -s -a
|
Monospace italic
(courier)
|
Indicates that users should replace italicized part with values that they are actually working with. |
|
1.6. Contacting NEC
For the latest product information, visit our website below:
2. Functions of the WebManager
This chapter describes the functions of the WebManager.
EXPRESSCLUSTER X SingleServerSafe uses windows common to those of the clustering software EXPRESSCLUSTER X to ensure high compatibility with EXPRESSCLUSTER X in terms of operation and other aspects.
This chapter covers:
2.3. Checking the status of each object in the tree view of WebManager
2.8. Setting limitations on the connection and operation of the WebManager
2.1. Starting the WebManager
Some of the windows and terms used to describe the WebManager in this chapter are the same as those for EXPRESSCLUSTER X WebManager. Therefore, cluster-related terms are used in parts of the chapter.
Read the guide, assuming that EXPRESSCLUSTER X SingleServerSafe is in a one-node cluster.
Note
You cannot configure or display functions that have been added to or changed in versions later than EXPRESSCLUSTER X 4.0.
See also
For the system requirements of the WebManager, see the corresponding web page.
2.1.1. What is the WebManager?
The WebManager is a function for setting up EXPRESSCLUSTER, monitoring its status, starting and stopping servers and groups, and collecting operation logs through a Web browser. The overview of the WebManager is shown in the following figures.
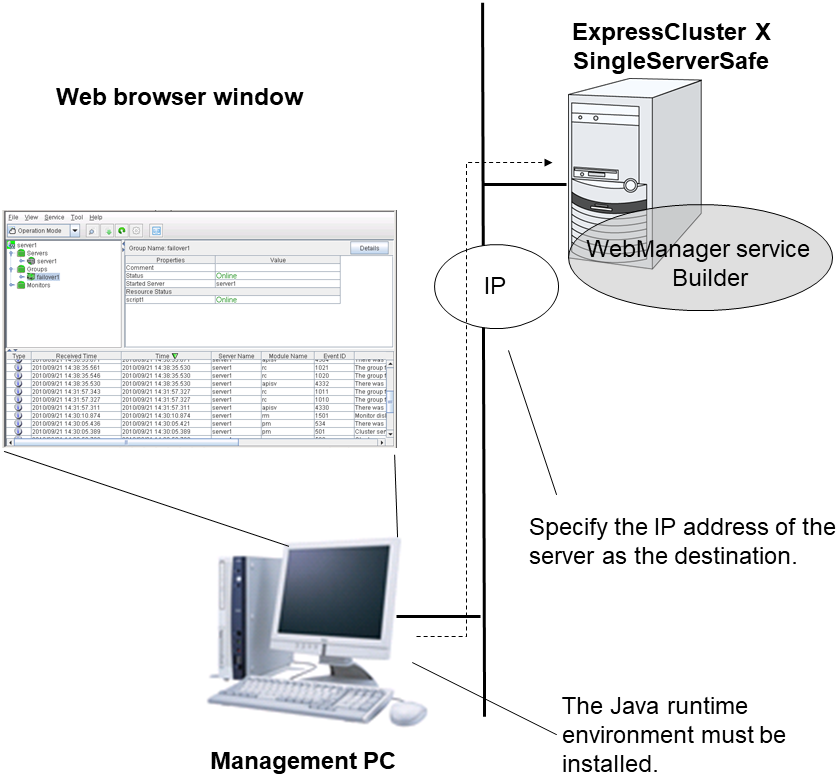
The WebManager service on the EXPRESSCLUSTER X SingleServerSafe Server is set up to start up when the operating system starts up.
2.1.2. Setting up JAVA runtime environment to a management PC
2.1.3. Starting the WebManager
The procedure for starting the WebManager is described below.
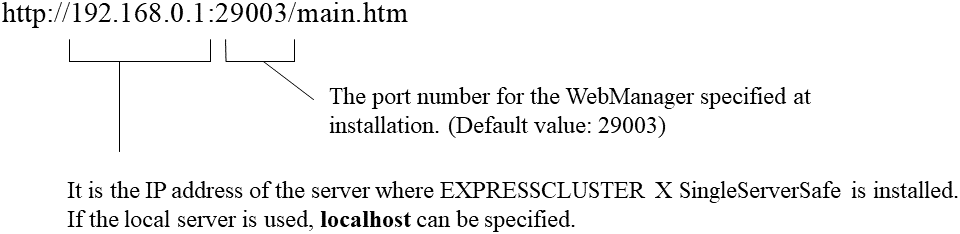
Start your Web browser.
Enter the IP address and port number of the server where EXPRESSCLUSTER X SingleServerSafe is installed in the browser address bar.
Note
In Java Runtime Enviroment Version 9.0 or later, WebManager can be launched by using Java Web Start. When starting the Java WebManager, change "main.htm" of the URL above to "main.jnlp" and then enter the modified URL in the Address bar.
Example: http://10.0.0.1:29003/main.jnlp
- The WebManager starts.
See also
The Cluster WebManager supports encrypted communication (by using HTTPS). For details of encrypted communication, see "3.2.6. WebManager tab" in "3.2. Cluster properties" in 3. Function of the Builder" in this guide. Enter the following to perform encrypted communication.
https://192.168.0.1:29003/main.htm
2.2. Window of the WebManager
This chapter provides information about the WebManager window.
Note
For the language used on the WebManager screen, see "3.2.1. Info tab" in "3.2. Cluster properties" in "3. Function of the Builder" in this guide.
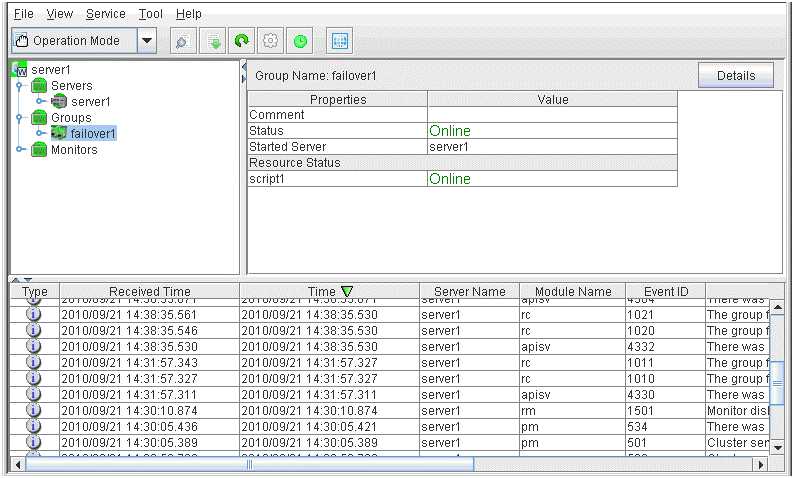
2.2.1. Main window of the WebManager window
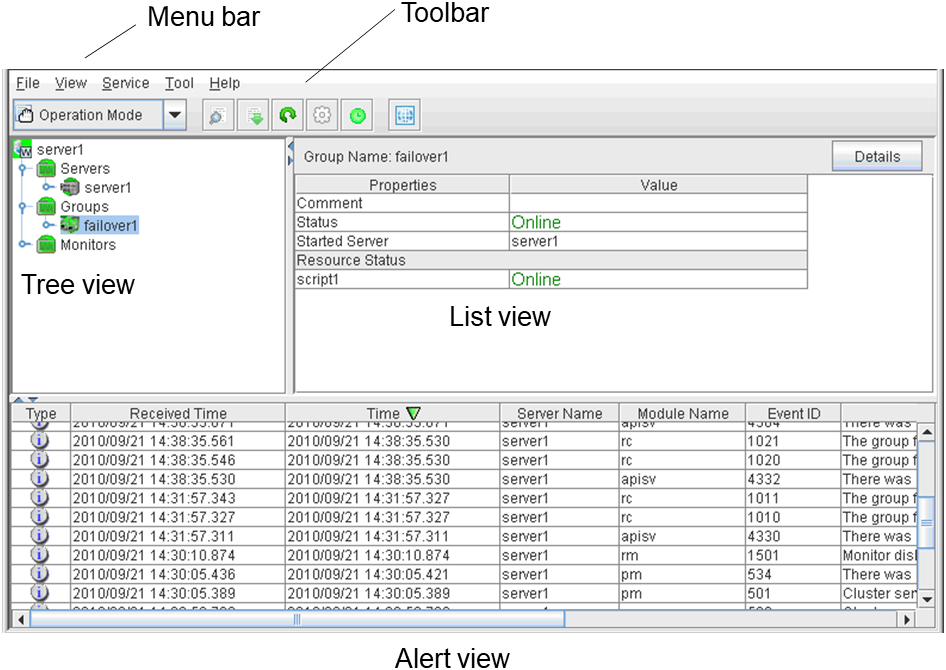
Menu bar
The menu bar has the five menus described below. The contents of these menus differ depending on the config mode and operation/reference mode. The menu items displayed in the operation/reference mode are described later in this chapter.
File menu
View menu
Service menu
Tool menu
Help menu
Toolbar
If you click one of the six icons on the toolbar, you can perform the same operation as when selecting the corresponding item on the menu bar.
Icon/menu
Function
Refer to
Changes the WebManager to the operation mode. This is the same as clicking View on the menu bar and then selecting Operation Mode.
Changes the WebManager to the config mode (online version of the Builder). This is the same as clicking View on the menu bar and then selecting Config Mode.
Changes the WebManager to the reference mode. This is the same as clicking View on the menu bar and then selecting Reference Mode.
Changes the WebManager to the verification mode. This is the same as clicking View on the menu bar and then selecting Verification mode.
Searches for an alert. This is the same as clicking Tool on the menu bar and then selecting Filter Alerts.
Collects logs. This is the same as clicking Tool on the menu bar and then selecting Collecting Cluster Logs.
Performs reloading. This is the same as clicking Tool on the menu bar and then selecting Reload.
Displays options. This is the same as clicking Tool on the menu bar and then selecting Option.
Displays Integrated WebManager. This is the same as clicking Tool on the menu bar and then selecting Integrated WebManager.


Tree view
The statuses of servers and group resources can be confirmed. For further information, see "2.3. Checking the status of each object in the tree view of WebManager".
List view
The upper part of the view provides information on the server or other resource selected in the tree view. The lower part lists the start/stop statuses and comments of each server, group resource, and monitor resource. If you click the Details button located on the upper right of the view, further information will be displayed in a dialog box. For further information, see " 2.4. Checking the status by the WebManager list view ".
Alert view
The operation status of EXPRESSCLUSTER X SingleServerSafe is indicated by a message. For further information, see "2.5. Checking alerts using the WebManager".
2.2.2. Changing the WebManager operation mode
The WebManager has the following four operation modes.
- Operation modeThis mode allows the user to see the status of and operate the server.Select Operate Mode on the View menu or click the operation mode icon [
 ] on the toolbar to switch to the operation mode. However, if you used the reference mode password for login when starting the WebManager or connected to the WebManager from a client that is not allowed to perform operations, it is not possible to switch to the operation mode.
 - Reference ModeThis mode allows the user to see the cluster status, but not to operate the server.Select Reference Mode on the View menu or click the operation mode icon [
 ] on the toolbar to switch to the reference mode.
 - Config ModeThis mode allows the user to set up the server and change the settings. The WebManager in the config mode is called Builder (online version). For details about operations in the config mode, see the "3. Function of the Builder" in this Guide.Select Config Mode on the View menu or click the operation mode icon [
 ] on the toolbar to switch to the config mode. However, if you connected to the WebManager from a client that is not allowed to perform operations, it is not possible switch to the config mode.
 - Verification ModeThis mode allows the user to generate a simulated fault in specified monitor resources.Select Verification mode [
 ] on the View menu or the toolbar to switch to the Verification mode. However, if you connected to the WebManager from a client that is not allowed to perform operations, it is not possible to switch to verification mode.If you switch from the verification mode to another mode, a dialog box asks if you want to cancel the simulated fault status of all the monitor resources. Select Yes to place all the monitor resources in the simulated fault status back in the normal monitored status. Select No to switch to another mode while keeping the monitor resources in the simulated fault status.
Note
2.2.3. Searching for an alert by using the WebManager
You can search for an alert by using the WebManager. Searching in this method is useful to view only a specific type alert.
Note
For information about alert logs, see "2.5. Checking alerts using the WebManager ".
To search for an alert, click Filter Alerts on the Tool menu or click the alert search icon [ ] on the toolbar. The window for specifying alert log search conditions is displayed.
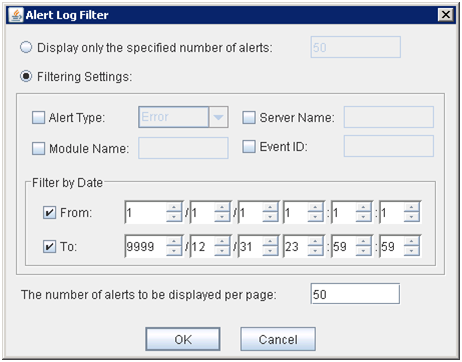
To search only the specified number of past alert logs:
Select Display only the specified number of alerts.
Enter the number of past alert logs to search, and then click OK. Past alert logs are displayed as many as you have specified.
Note
The maximum value to enter is the number specified for Max Number to Save Alert Records. To configure Max Number to Save Alert Records, right-click the cluster icon in the Builder, and then click Properties on the shortcut menu. In the properties dialog box, click the Alert Log tab.
To search by specifying search conditions:
Click Filtering Settings.
Enter the search conditions in each field and start searching.
Alert Type: Select the type of alerts.
From, To: Select this to search by the time of the event occurrence. Enter the values in From and To field.
Enter the number of alerts to display on one page in The number of alerts to be displayed per page, and then click OK. Research results are displayed based on the time an alert occurred.
If the results of research are displayed on more than one page, move the page by clicking Back, Next, and Jump buttons.
2.2.4. Collecting logs by using the WebManager
 ] on the toolbar opens the log collection dialog box.
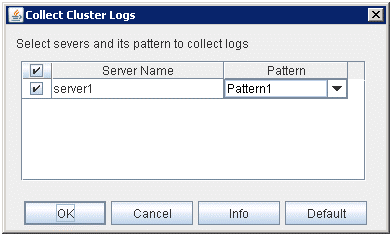
Check box
Select the check boxes of the servers that have the logs you want to collect.
Pattern
Select the information to be collected. Specify one of Type 1 to Type 4 as the log collection pattern.
Type 1
Type 2
Type 3
Type 4
Default collection information
✓
✓
✓
--
Event log
✓
✓
✓
✓
Windows Error Report
✓
✓
✓
✓
User dump
✓
✓
--
--
Diagnosis program report
✓
✓
--
--
Registry
✓
✓
✓
--
Script
✓
✓
✓
--
Logs of ESMPRO/AC and ESMPRO/UPSC
✓
✓
✓
--
Logs of HA
--
✓
--
--
For detailed information of (1) to (9), see "Collecting logs (clplogcc command)" in "EXPRESSCLUSTER X SingleServerSafe command reference" in the "Operation Guide".
OK
Start log collection and displays the dialog box of log collection progress.
Cancel
Close this dialog box.
Info
Display the information for each pattern.
Default
Reset the selections of servers and collect patterns to default values.When log collection starts, following dialog box appears.
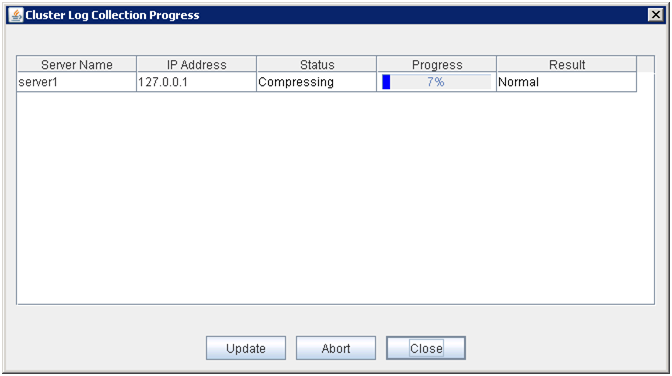
Update
Update the dialog box of the log collection progress.
Abort
Abort the log collection.
Close
Close the dialog box. But, log collection still continues.At this time, the display of Collect Logs in title view has changed to Progress.To display the log collection dialog box again, click Progress in Tool menu.
Collect Logs Results
Result
Explanation
Normal
Log collection succeeded.
Abort
Log collection was cancelled by user.
Invalid parameter
Internal error may have occurred.
Communication Error
Connecting error occurred.
Timeout:
Timeout occurred.
Busy
The server is busy.
Compression Error
Error occurred when compressing a file.
File I/O Error
File I/O failed.
Not Enough Free Space
No free space on the disk.
Unknown Error
Failure caused by other errors
When the log collection completes, the browser displays following dialog box that asks where you want to save the logs. Save the logs to any location.(*: This image shows the case when using Internet Explorer 8.0.)
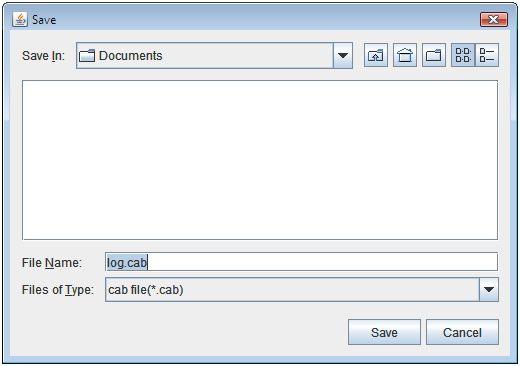
Note
Please save logs in 10 minutes after above dialog box appeared. Or, you may not save logs correctly.
Note
If other modal dialog box is displayed while collecting logs, the file saving dialog box for the log collection will not be displayed. To display the file saving dialog box, close the modal dialog box.
Note
If the log file size exceeds 2GB, log collection may fail depending on the compression format. Adjust the log to be collected or change the log collection pattern.
2.2.5. Updating the WebManager information
Click Reload on the Tool menu or click the reload icon [ ] on the toolbar to update the information displayed in the WebManager.
Note
 ] or Reload in the Tool menu after performing an operation.
2.2.6. Changing the screen layout on the WebManager

On the bar, click  to maximize the view. Click
  to minimize it.
 ] on the tool bar.
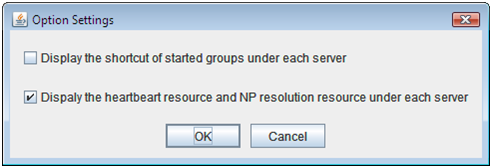
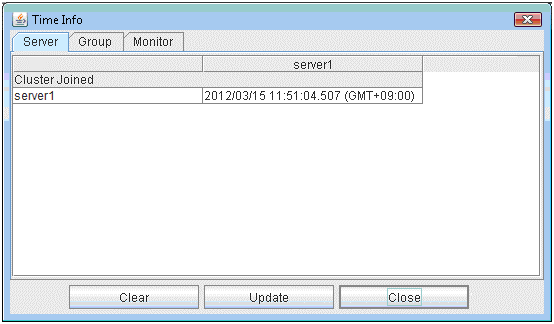
2.2.7. Checking the time information from the WebManager
Check the time information from the WebManager by clicking Time info on the Tool menu or by clicking the time information icon [ ] on the toolbar.
Time information displayed on the Server tab
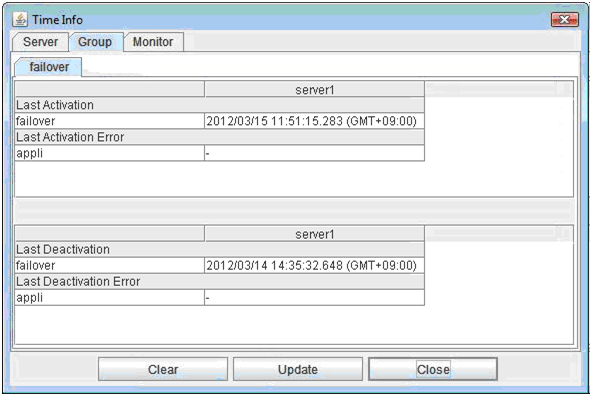
Time information displayed on the Group tab
Time information displayed on the Monitor tab
Note
Message receive monitor resources isn't dealing.
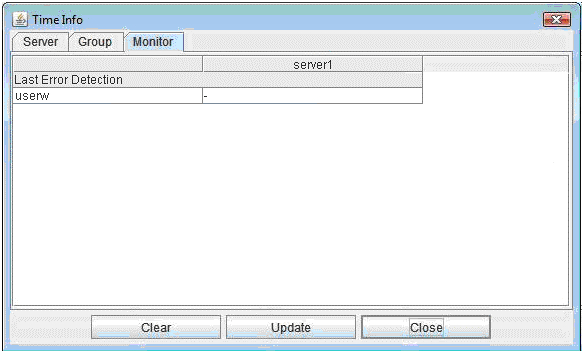
Clear
Deletes the time information displayed on the current tab.
Update
Acquires the time information for all the tabs.
Close
Closes the time information dialog box.
Note
If the Client Data Update Method of the WebManager is set to Polling, when clear button was pushed , Lighting up Time info on the Tool menu. But it's no problem as cluster..
2.2.8. Executing Integrated WebManager from the WebManager
To execute Integrated WebManager from the WebManager, click Integrated WebManager on the Tool menu or Integrated WebManager icon [ ] on the tool bar.
2.2.9. Operating services on the WebManager
To operate services on the WebManager, select the relevant items shown below from the service menu.
- Suspend ClusterSuspend EXPRESSCLUSTER Server service. This menu can be selected only when EXPRESSCLUSTER Server service is running.
- Resume ClusterResume EXPRESSCLUSTER Server service. This menu can be selected only when EXPRESSCLUSTER Server service is suspended.
- Start ClusterStart EXPRESSCLUSTER Server service. This menu can be selected only when EXPRESSCLUSTER Server service is stopped.
- Stop ClusterStop EXPRESSCLUSTER Server service. This menu can be selected only when EXPRESSCLUSTER Server service is running.
- Restart ManagerRestart WebManager.
2.2.10. Confirming the license from the WebManager
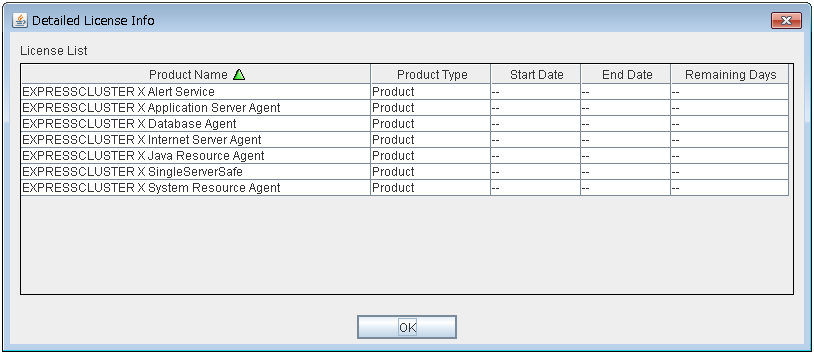
License List
Displays the licenses registered on the connection destination server.You can change the display order by selecting a specific field name on the title bar of the list.By default, the licenses are sorted in ascending order of Product Name.Note
In case of license which includes multiple licenses, all included licenses information are displayed.
OK button
Closes the Detailed License Info dialog box.
2.3. Checking the status of each object in the tree view of WebManager
You can visually check the status of each object in the WebManager window.
On the left pane of the window, a tree is displayed. Check the status by looking at each icon and object color. For meaning of each icon and object color, see "Functions of the WebManager" in "Legacy Feature Guide" for EXPRESSCLUSTER X.
Note
The tree configuration depends on the version of and optional products used with EXPRESSCLUSTER X SingleServerSafe.
2.3.1. Operations that can be executed from the WebManager
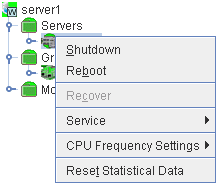
You can operate a cluster by right-clicking Cluster, Individual server, Individual group, or Individual resource.
Cluster object
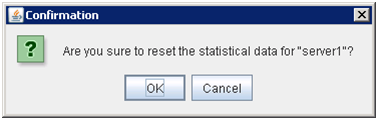
When you right-click a monitor resource object, the following shortcut menu is displayed.
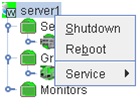
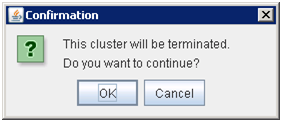
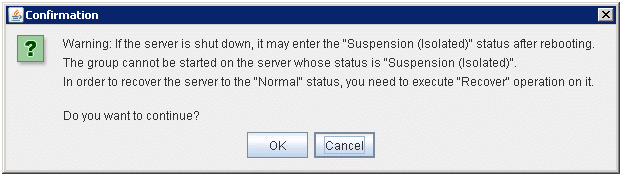
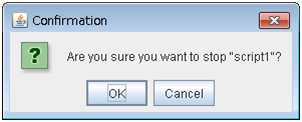
- Shut downShut down the server. When you select this operation, the following dialog box is displayed for confirmation.
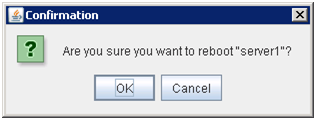
- RebootReboot the server. When you select this operation, the following dialog box is displayed for confirmation.
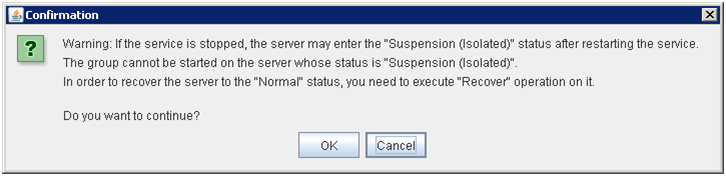
- ServiceIf you select Service, the items Suspend Cluster, Resume Cluster, Start Cluster, Stop Cluster and Restart Manager are displayed on the shortcut menu.
Server object
When you right-click a monitor resource object, the following shortcut menu is displayed.


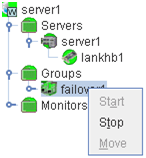
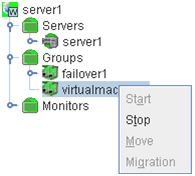
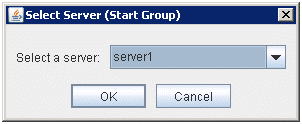
Group object
When you right-click a group object, the following shortcut menu is displayed.
Group type is failover.
Group type is virtualmachine.

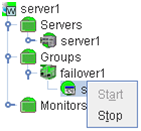
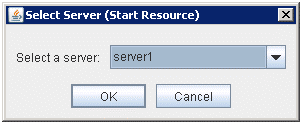
Group resource object
When you right-click a monitor resource object, the following shortcut menu is displayed.
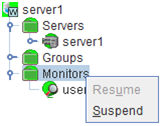
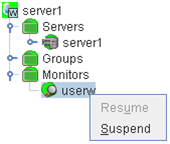
Monitor resource object
When you right-click a monitor resource object, the following shortcut menu is displayed.
When operation mode is selectedWhen verification mode is selected
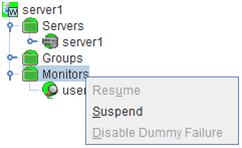


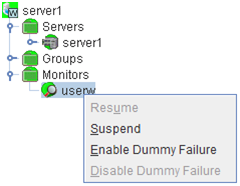
Individual monitor resource objects
When you right-click an individual monitor resource object, the following shortcut menu is displayed.
When operation mode is selectedWhen verification mode is selected
Message receive monitor resource
VM monitor resource
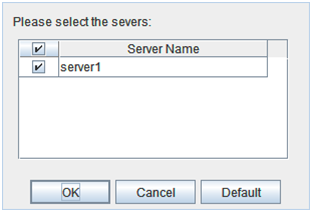
The following dialog box for selecting the server on which a dummy failure is generated for a selected monitor resource is displayed.


2.4. Checking the status by the WebManager list view
Details about the object selected in the WebManager tree view can be displayed in the list view.
2.4.1. To display information on the whole cluster
Start the WebManager.
In this tree view, click the object icon [
 ] for the cluster. In the list view in the right pane of the window, the Group Status and Monitor Status are displayed.
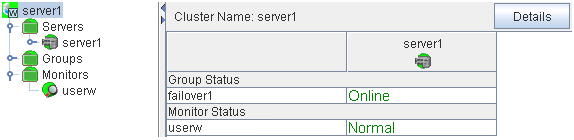
In the following dialog box, click the Details button to display the following information. A dialog box is displayed with the content shown below.
Info
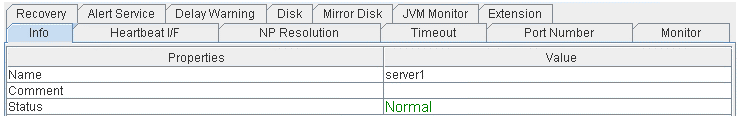
- Name:
Cluster name
- Comment:
Comment for the cluster
- Status:
Status of the cluster
Heartbeat I/F
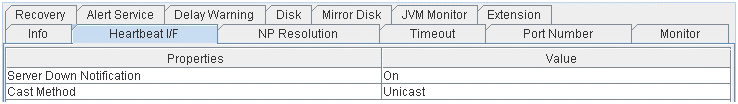
- Server Down Notification:
Not in use
- Cast Method:
This is the setting for the method to send a heartbeat (unicast/broadcast). When the IP address of the heartbeat I/F is IPv6, the broadcast cannot be used.
NP Resolution
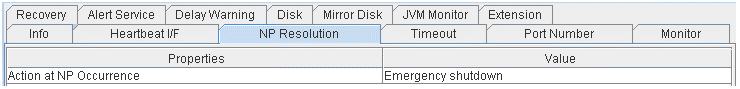
- Action at NP Occurrence:
Action to be taken when a network partition occurs
Timeout
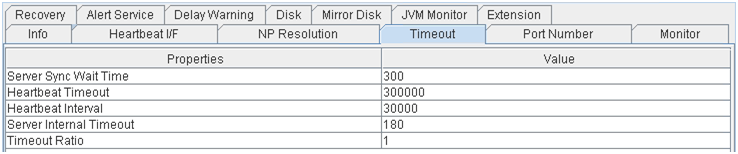
- Server Sync Wait Time:
Not in use
- Heartbeat Timeout:
Heartbeat timeout (in milliseconds)
- Heartbeat Interval:
The interval for sending heartbeats (milliseconds)
- Server Internal Timeout:
Internal communication timeout (in seconds)
- Timeout Ratio:
Current timeout ratio
Port Number
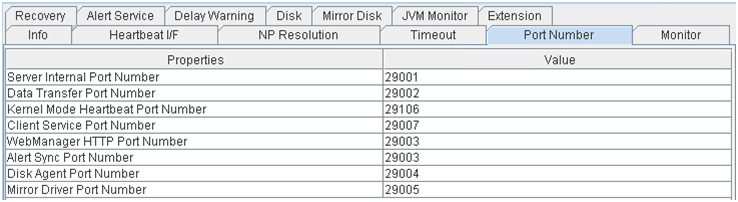
- Server Internal Port Number:
Port number for internal communication
- Data Transfer Port Number:
Port number for data transfer
- Kernel Mode Heartbeat Port Number:
Port number for kernel mode heartbeat
- Client Service Port Number:
Port number for client service
- WebManager HTTP Port Number:
Port number for WebManager
- Alert Sync Port Number:
Port number for alert synchronization
- Disk Agent Port Number:
Not in use
- Mirror Driver Port Number:
Not in use
Monitor
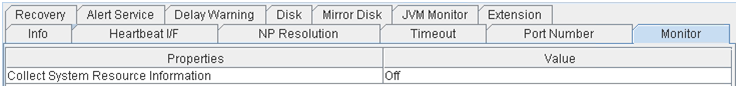
- Collect System Resource Information:
Whether or not to collect System Resource Information
Recovery
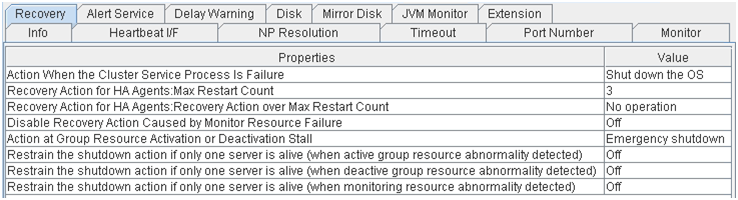
- Action When the Cluster Service Process Is Failure: Action When the Cluster Service Process Is Failure
Action to be taken when a cluster service process fails
- Recovery Action for HA Agents: Max Restart Count:
Maximum count to restart an HA process if the process fails
- Recovery Action for HA Agents: Recovery Action over Max Restart Count:
Action to be taken when the HA process fails and the process cannot be restarted even after retrying restart of the process for the maximum number of retries
- Disable Recovery Action Caused by Monitor Resource Failure:
Whether or not to disable the recovery action when the monitor resource fails
- Action at Group Resource Activation or Deactivation Stall:
Action to be taken when group resource activation/ deactivation is stalled
- Restrain the shutdown action if only one server is alive (when active group resource abnormality detected):
Whether to disable shutdown at activation failure in the case of the last one server
- Restrain the shutdown action if only one server is alive (when deactive group resource abnormality detected):
Whether to disable shutdown at deactivation failure in the case of the last one server
- Restrain the shutdown action if only one server is alive (when monitoring resource abnormality detected):
Whether to disable shutdown at monitoring failure in the case of the last one server
Alert Service
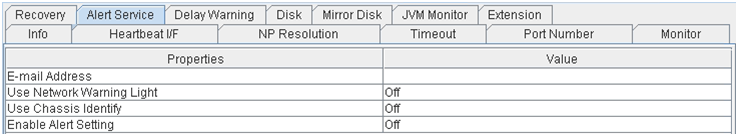
- E-mail Address:
Alert mail address
- Use Network Warning Light:
Not in use
- Use Chassis Identify:
Not in use
- Enable Alert Setting:
Whether or not to enable setting
Delay Warning
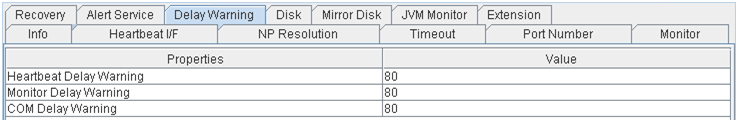
- Heartbeat Delay Warning:
Heartbeat delay warning (%)
- Monitor Delay Warning:
Monitor delay warning (%)
- COM Delay Warning:
Not in use
Disk
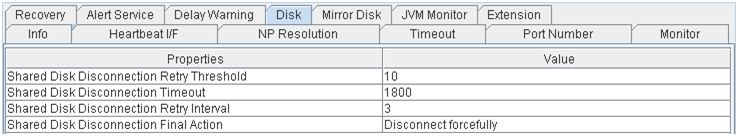
- Shared Disk Disconnection Retry Threshold:
Not in use
- Shared Disk Disconnection Timeout:
Not in use
- Shared Disk Disconnection Retry Interval:
Not in use
- Shared Disk Disconnection Final Action:
Not in use
Mirror Disk
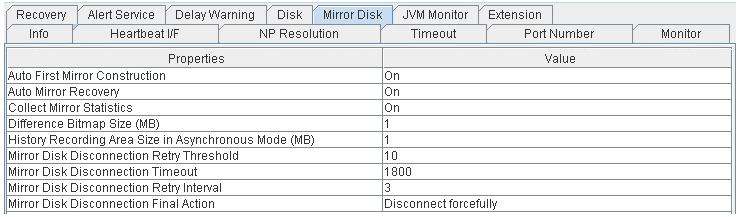
- Auto First Mirror Construction:
Not in use
- Auto Mirror Recovery:
Not in use
- Collect Mirror Statistics:
Not in use
- Mirror Disk Disconnection Retry Threshold:
Not in use
- Mirror Disk Disconnection Timeout:
Not in use
- Mirror Disk Disconnection Retry Interval:
Not in use
- Mirror Disk Disconnection Final Action:
Not in use
JVM Monitor
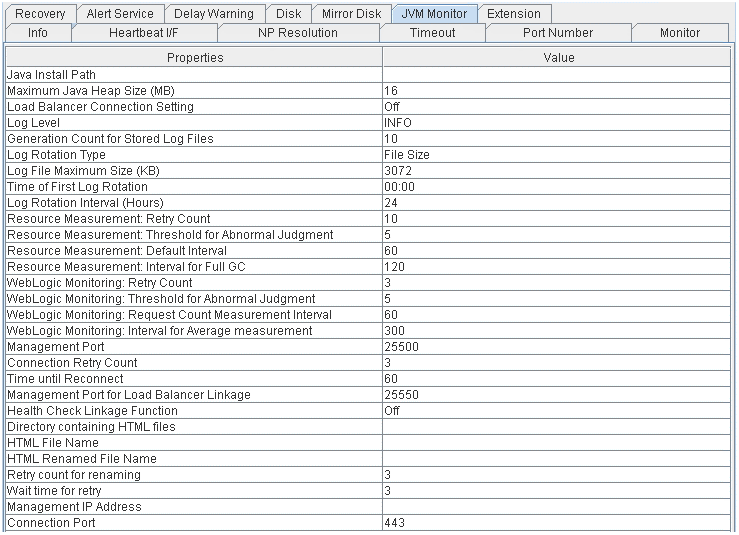
- Java Installation Path:
Java installation path
- Maximum Java Heap Size (MB):
Maximum Java heap size (MB)
- Load Balancer Connection Setting:
Load balancer linkage settings
- Log Level:
Log level
- Generation Count for Stored Log Files:
Number of generations of log files to be stored
- Log Rotation Type:
Log rotation type
- Log File Maximum Size (KB):
Maximum log file size (KB)
- Time of First Log Rotation:
Time of the first log rotation
- Log Rotation Interval (Hours):
Log rotation interval (hours)
- Resource Measurement:
Retry Count: Measurement retry count
- Resource Measurement:
Threshold for Abnormal Judgment: Threshold for abnormal judgment
- Resource Measurement:
Default Interval: Interval for memory and thread measurement (sec)
- Resource Measurement:
Interval for Full GC: Interval for Full GC measurement (sec)
- WebLogic Monitoring:
Retry Count: Measurement retry count
- WebLogic Monitoring:
Threshold for Abnormal Judgment: Threshold for abnormal judgment
- WebLogic Monitoring:
Request Count Measurement Interval: Interval for measuring the number of requests (sec)
- WebLogic Monitoring:
Interval for Average measurement: Interval for measuring the average (sec)
- Management Port:
Management port number
- Connection Retry Count:
Connection retry count
- Time until Reconnect:
Time to wait for reconnection (sec)
- Management Port for Load Balancer Linkage:
Management port number for load balancer linkage
- Health Check Linkage Function:
Whether or not to use the health check linkage function
- Directory containing HTML files:
HTML storage directory
- HTML File Name:
HTML file name
- HTML Renamed File Name:
Renamed HTML file name
- Retry Count for renaming:
Retry count if renaming fails
- Wait time for retry:
Time to wait for a renaming retry (sec)
- Management IP Address:
BIG-IP LTM management IP address
- Connection Port:
Communication port number for BIG-IP LTM
Extension
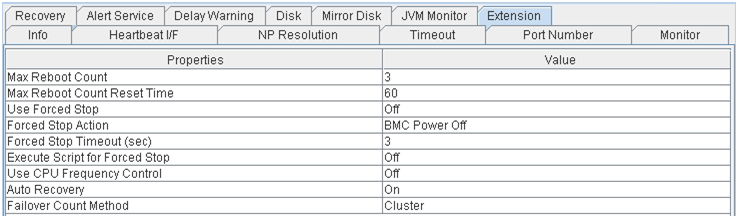
- Max Reboot Count:
Maximum number of reboot
- Max Reboot Count Reset Time:
Time to reset current number of reboot (in seconds)
- Use Forced Stop:
Not in use
- Forced Stop Action:
Not in use
- Forced Stop Timeout (sec):
Not in use
- Execute Script for Forced Stop:
Not in use
- Use CPU Frequency Control:
Whether or not to use CPU frequency control function
- Auto Recovery:
The setting whether a cluster server is automatically returned to the cluster after the server is rebooted as "Suspension (Isolated)" state.
- Failover Count Method:
Not in use
2.4.2. Checking the whole status of the server in the WebManager list view
Start the WebManager.
In the tree view, select Servers object icon [
 ]. In the upper part of the list view in the right pane of the window, Server Name, Type (master or not), and Status are displayed. In the lower part, Server Group Name and Server Name are displayed.
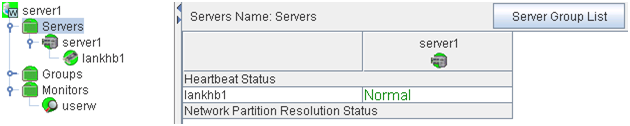
2.4.3. Checking the status of individual server in the WebManager list view
Start the WebManager.
If the object [
 ] of a server is selected in the tree view, Comment, Version, Product, Internal Version, Install Path and Status of the server are displayed.
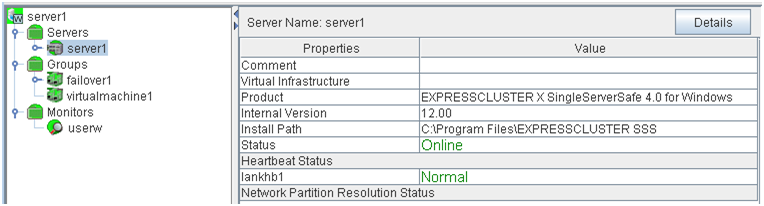
- Comment:
Comment for the server
- Virtual Infrastructure:
Virtual infrastructure name
- Product:
Product name
- Internal Version:
Internal version of EXPRESSCLUSTER X SingleServerSafe
- Install Path:
Install path of EXPRESSCLUSTER X SingleServerSafe
- Status:
Status of the server
Click Details to display the following in the dialog box.
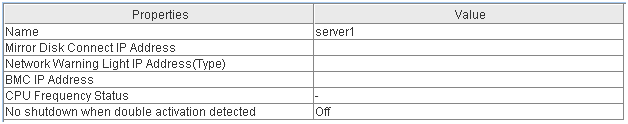
- Name:
Computer name
- Mirror Disk Connect IP Address:
Not in use
- Network Warning Light IP Address(Type):
Not in use
- BMC IP Address:
Not in use
- CPU Frequency Status:
Current status of CPU frequency
- No shutdown when double activation detected:
Not in use
2.4.4. Checking the status of the whole monitor in the WebManager list view
Start the WebManager.
- If you select the object icon [
 ] for the cluster in the tree view, Monitor Name and the server status list are displayed in the list view.
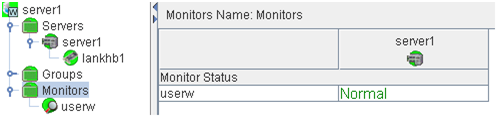
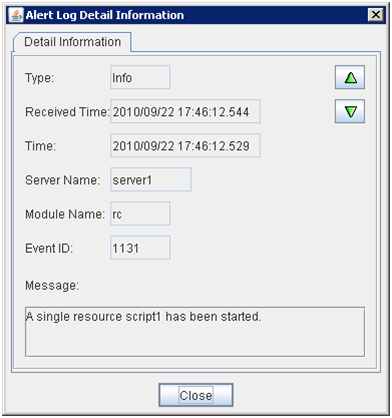
2.5. Checking alerts using the WebManager
You can view alerts in the bottom part of the WebManager.
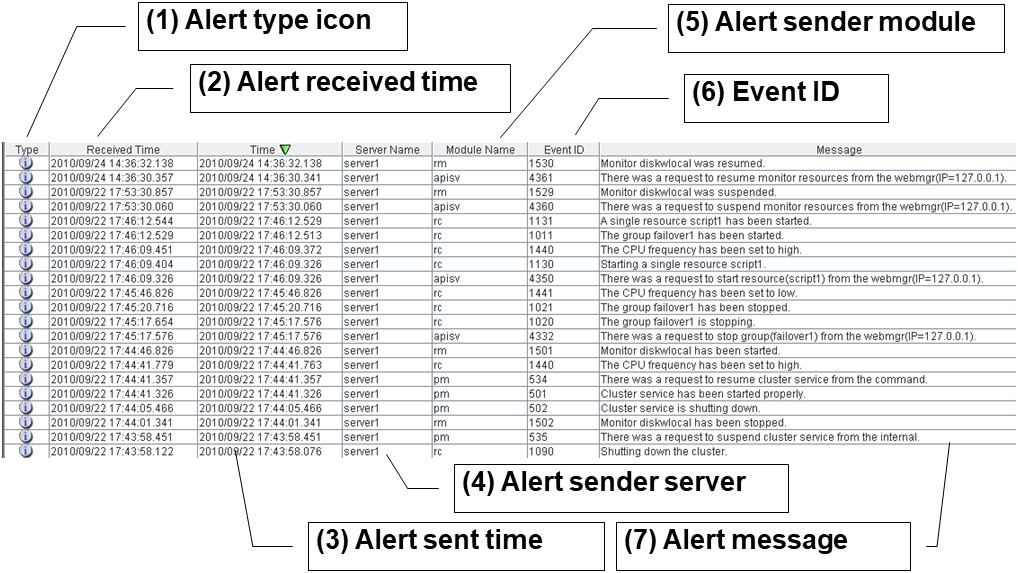
Each field of the alert view is configured as follows.
For the meanings of the individual alert messages, see in the "Operation Guide". For details about searching alert messages, see "2.2.3. Searching for an alert by using the WebManager" in this chapter.
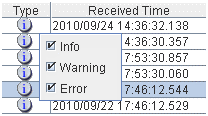
2.5.1. Alert view fields
The meanings of each of the fields in the alert view of the WebManager are as follows.
Alert type icon
Alert type
Meaning

Informational message

Warning message

Error message
- Alert received timeThe time the alert was received. The time on the server to which the WebManager connects is applied.
- Alert sent timeThe time the alert was sent from a server. The time in the alert sender server is used.
- Alert sender serverThe name of a server that sent the alert.
- Alert sender moduleThe name of a module that sent the alert.
- Event IDThe event ID number set to each alert.
- Alert messageThe alert messages.
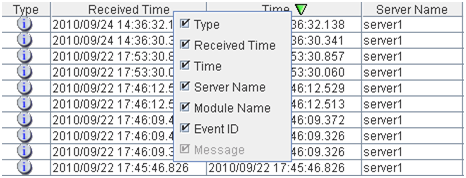
2.5.2. Alert view operations

 or
or  mark is displayed in the selected field.
Mark |
Meaning |
|---|---|
|
Sorts alerts in the ascending order of the selected field. |
|
Sorts alerts in the descending order of the selected field. |


2.6. Manually stopping and starting the WebManager
2.7. When you do not want to use the WebManager
If you do not want to use the WebManager for some security reasons, change the settings of Services of Administrative Tools of your OS or that of the Builder not to start the WebManager.
When setting in Services of Administrative Tools, change the Startup Type of the EXPRESSCLUSTER Manager service to Manual.
In Cluster Properties, you can specify the settings for using the WebManager. For details about these settings, see "3.2.6. WebManager tab" in "3.2. Cluster properties" in "3. Function of the Builder" in this guide.
2.8. Setting limitations on the connection and operation of the WebManager
The limitation in connection and operation of the WebManager can be configured in Cluster Properties in the Builder. For details about these settings, see "3.2.6. WebManager tab" in "3.2. Cluster properties" in "3. Function of the Builder" in this guide.
2.8.1. Types of usage limitations
There are two ways to set usage limitations:
Limiting the access by using client IP addresses
Limiting the operation by using a password
Limsiting the access by using client IP addresses
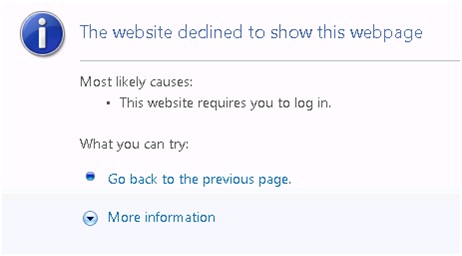
This function limits clients who can access the WebManager and operations on the WebManager by using client IP addresses.Add IP addresses to IP Addresses of the Accessible Clients on the WebManager tab in the Cluster Properties of the Builder.When setting the limitation of the connection of the WebManager, if you attempt to access to the WebManager from the IP address that is not added to IP Addresses of the Accessible Clients, the following error messages are displayed.Example: when using the Internet ExplorerWhen connecting to the WebManager from the client that is restricted operations for cluster, you can select only Reference Mode.The following operations are disabled from the WebManager when operations are limited.
Shutting down or shutting down and then rebooting servers
Starting or stopping groups
Switching to Operation Mode
Switching to Config Mode
Switching to Verification Mode
The limitation by using a password
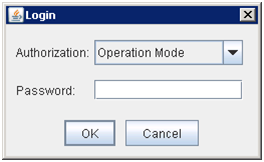
This function limits viewing and operations on the WebManager by using a password.To configure this limitation: in Cluster Properties of the Builder, click the WebManager tab, and then Control connection by using password.Once password limitation of the WebManager is specified, the following authorization dialog box is displayed when trying to access the WebManager by setting a password.You can log on to the WebManager by selecting Operate Mode or Reference Only in Authorization and entering a correct password.
The authorization dialog box is not displayed when the password limitation is not configured (you can log on to the WebManager without authorization).
You cannot log on to the WebManager if you enter a wrong password three consecutive times.
When you login with Reference Only selected for Permission, the WebManager is placed in reference mode. When you attempt to switch to operation mode, config mode, or verification mode in this status, the above authorization dialog is displayed, and you are requested to enter a password for Operation Mode.
Combination of the IP address and password
The operational limitations when using both IP addresses and passwords are the following:
Operable mode
Reference only
Unavailable
Reference only 1
Reference only
Unavailable
Cannot access
Cannot access
Cannot access
- 1
Authorization cannot be selected.
2.9. Limitations of the WebManager
Information displayed by the WebManager does not always reflect the latest status. To acquire the latest information, click the Reload icon on the toolbar or Reload in the Tool menu.
- If a server fails while the WebManager is acquiring information, the information acquisition fails, which may result in the failure to show some objects.Wait for the next automatic update, or click the Reload icon on the toolbar or Reload in the Tool menu to reacquire the latest information.
The EXPRESSCLUSTER logs cannot be collected from two or more WebManager instances simultaneously.
If you work on the WebManager when no connectivity is established, it may take a while to regain control.
While the mouse pointer is the hourglass which indicates that the OS is processing something, moving the cursor outside the browser may return to the arrow icon even if the process is still underway.
If a proxy server is used, configure the proxy server so that the port number of the WebManager can be relayed.
When a reverse proxy server is used, the WebManager does not run normally.
When updating EXPRESSCLUSTER X SingleServerSafe , close all running browsers. Clear the Java cache (not browser cache) and open browsers.
When updating Java, close all running browsers. Clear the Java cache (not browser cache) and open browsers
If the client PC to connect to WebManager uses Java(TM) Runtime Environment Version 8.0 Update 162 or later, and cannot be connected to the Internet, it may take time to start WebManager. This can be avoided by setting Execute Certificate Revocation Check to Not Check on Detailed Settings on the Java Control Panel. For details of how to set it, check the Java website.
Do not set the "Reload Interval" on the WebManager tab or less than 30 seconds. If you set it for less than 30 seconds, it may affect the performance of EXPRESSCLUSTER X SingleServerSafe.
3. Function of the Builder
This chapter provides information on functions of the EXPRESSCLUSTER X Builder.
This chapter covers:
3.1. Overview of the Builder
The Builder is a tool for creating and changing the cluster configuration data (config and scripts).
Note
You cannot configure or display functions that have been added to or changed in versions later than EXPRESSCLUSTER X SingleServerSafe 4.0.
There are two versions of the Builder; online version and offline version.
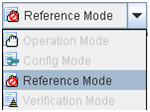
- Online versionClick Config Mode on the View menu or select the config mode icon [
 ] from the dropdown menu on the toolbar.With the online version Builder, you can connect to the server directly to create a cluster, change its configuration and distribute the cluster configuration data.
 - Offline versionWith the offline version Builder, you can create or change the cluster configuration data on the machine which cannot connect to a server.To distribute the cluster configuration data, you need to use the clpcfctrl command.
See also
For the system requirements of the Builder, see the corresponding web page.
Note
3.2. Cluster properties
In the Cluster Properties window, you can view and change the detailed data of EXPRESSCLUSTER X SingleServerSafe.
3.2.1. Info tab
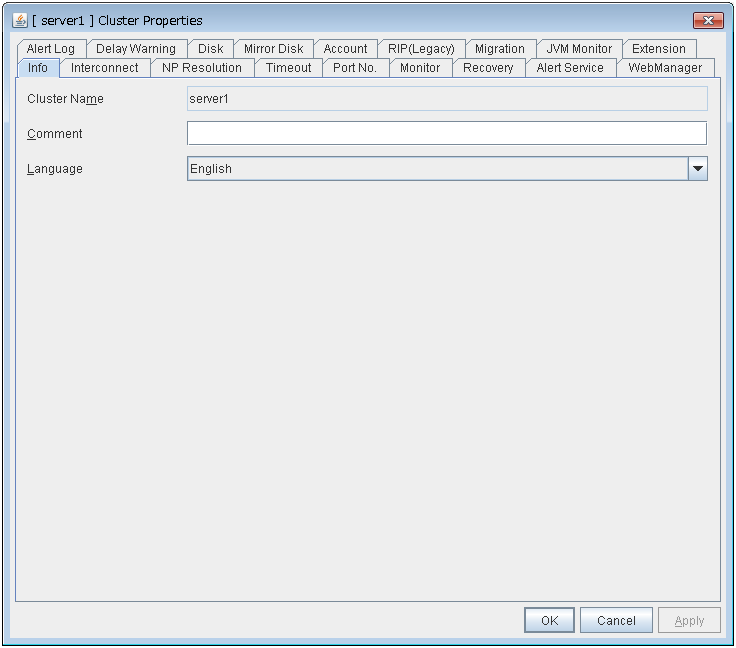
Cluster Name
Displays the server name. You cannot change the name here.
Comment (within 127 bytes)
Enter a new comment. You can only enter one byte English characters.
Language
Choose one of the display languages below. Specify the language (locale) of OS on which the WebManager runs.
English
Japanese
Chinese
3.2.2. Port No. tab
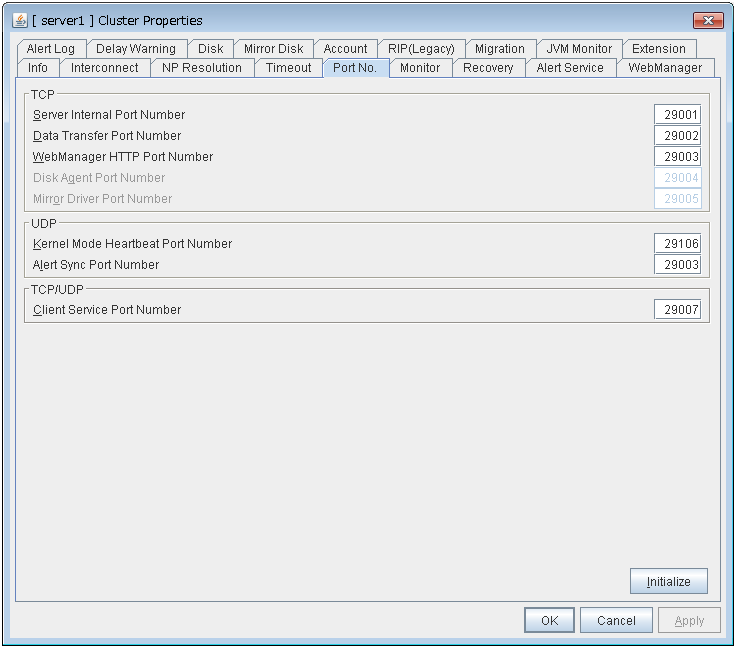
TCP
No TCP port numbers can be overlapped.
UDP
TCP/UDP
Initialize
This operation is used to return the value to the default value. By selecting Initialize, initial values are configured for all items.
3.2.3. Monitor tab
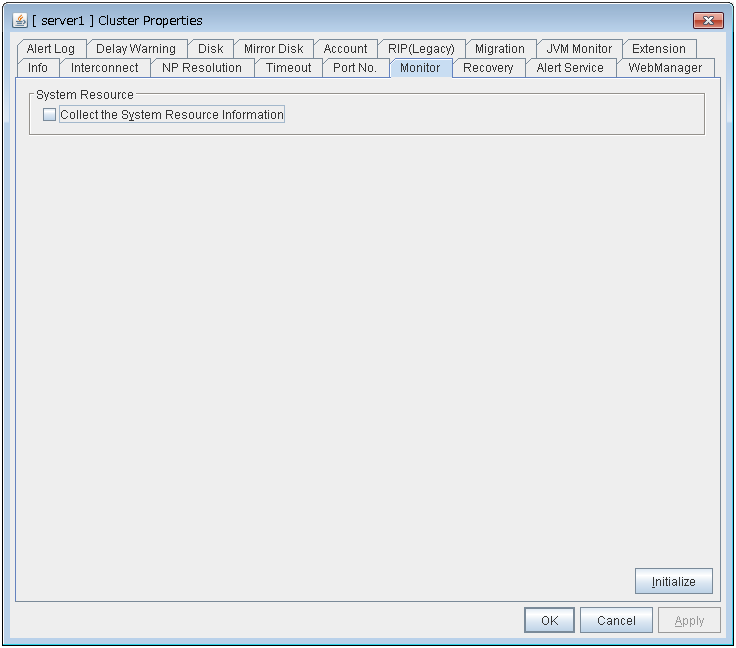
System Resource
Select whether to collect system resource information.System resource information is collected regularly so as to improve system operability. System resource information is useful for investigating the operation status of EXPRESSCLUSTER, and makes it easy to determine the cause of a failure attributable to a shortage of system resources.
3.2.4. Recovery tab
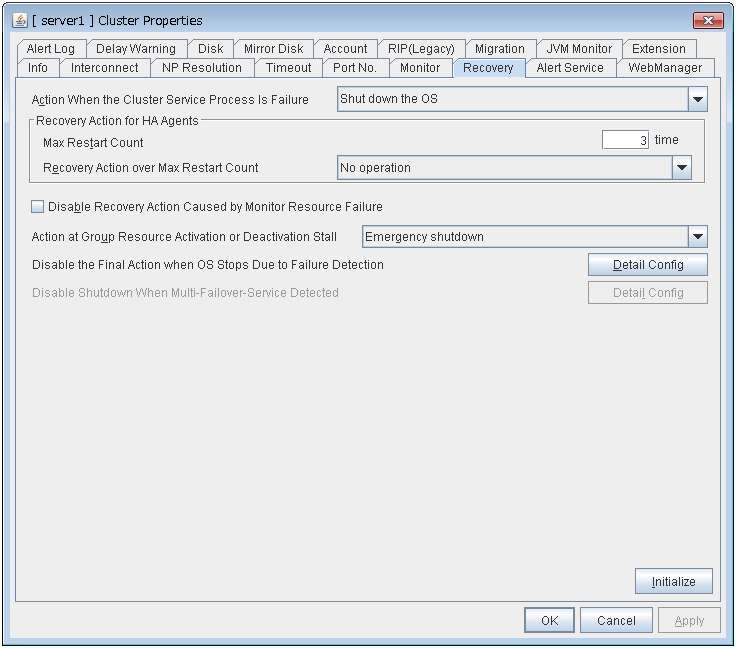
Action When the Cluster Service Process Is Failure
Specify an action at process abnormity of the cluster service.
Recovery Action for HA Agents
No operation
Note
The HA process is used with the system monitor resource, JVM monitor resource, and system resource information collection function.
Disable Recovery Action Caused by Monitor Resource Failure
- When the checkbox is selectedThe recovery action is disabled when the monitor resource is error.
- When the checkbox is clearedThe recovery action is enabled when the monitor resource is error.
Note
Action at Group Resource Activation or Deactivation Stall
Specify the action to apply in the event of an activation/deactivation stall of a group resource.
Note
If a stall occurs with "Nothing (handle a stall as an activation/deactivation failure)" specified, the effect on the group resources is undefined, so we do not recommend changing the setting to "Nothing (handle a stall as an activation/deactivation If you do specify "Nothing (handle a stall as an activation/deactivation failure)", set the recovery operation upon the detection of an activation/deactivation failure of a group resource as described below.
Activation/deactivation retry threshold: 0 (times)
Failover threshold: 0 (times)
Final action: Intentionally causing a stop error
If Stop the cluster service and shut down OS or Stop the cluster service and reboot OS is specified as the final action, it takes a considerable amount of time for the cluster service to stop.
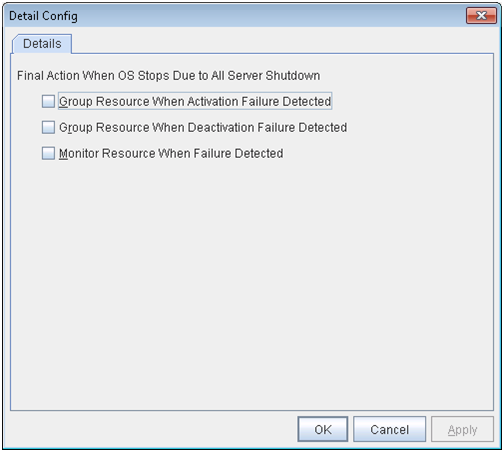
Disable the Final Action when OS Stops Due to Failure Detection
Click Detail Config to set suppression of the final action which accompanies the OS stop caused by error detection.
Note
The message receive monitor resource does not become the target for which the final action caused by error detection is suppressed.
The following situations lead to an OS stop during the final action when an activation/deactivation error is detected in a group resource and during the final action when a monitor resource error is detected.
Cluster service stop and OS shutdown
Cluster service stop and OS restart
Generation of an intentional stop error
3.2.5. Alert Service tab
Specify the alert service, chassis identify, and network warning light.
Note
To use the mail alert function, obtain EXPRESSCLUSTER X Alert Service 4.0 for Windows, and register the license.
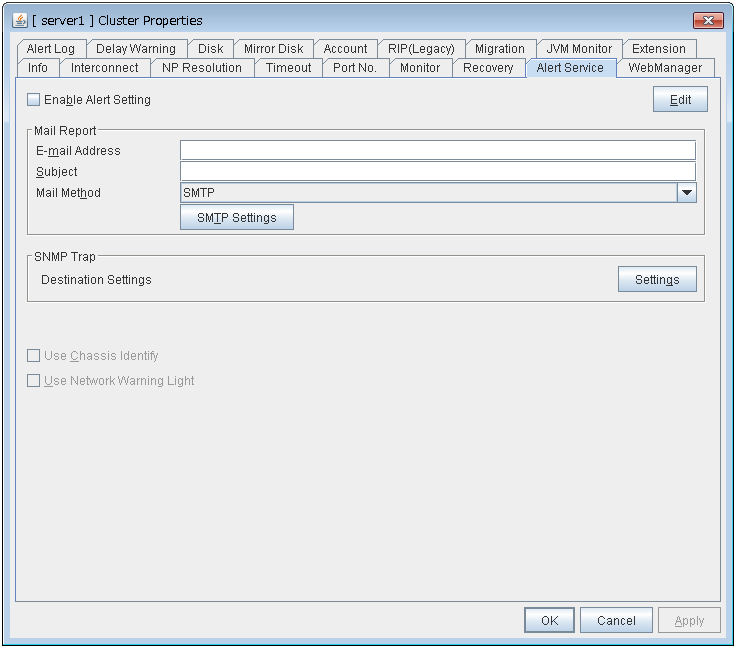
Enable Alert Setting
Configures whether or not to modify the default value of the alert settings. To modify the settings, click Edit to configure the destination address.If you clear the checkbox, the destination address you have modified returns to the default settings temporarily.For the default settings of the destination address, see "Messages reported by event log and alert" in "Error messages" in the "Operation Guide".
E-mail Address (within 255 bytes)
Enter the mail address of alert destination. To specify multiple mail addresses, separate each of them by semi-colon ";".
Subject (within 127 bytes)
Enter the mail subject.
Mail Method
Configure the mail method. In this version, SMTP is the only option in this.
Destination Settings
Configure the SNMP trap transmission function. Click Setting to configure the SNMP trap transmission destination.
Use Chassis Identify
Not used.
Use Network Warning Light
Not used.
Change Alert Destination
Select Edit to display the dialog box where you can change alert destination.
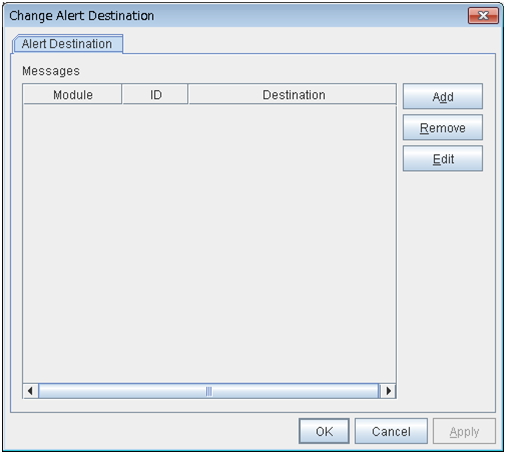
Add
Add the alert ID of the destination which you want to customize. Click Add to open the dialog box for entering the message.
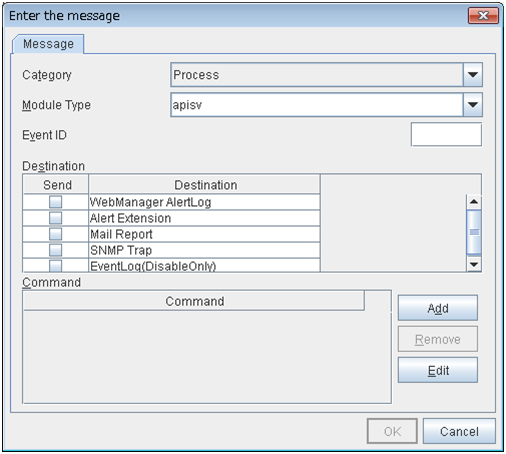
Category
Select a main category of module types.
Module Type (within 31 bytes)
Select the name of the module type for which you want to change the destination address.
Event ID
Enter the message ID of the module type for which you want to change the destination. For the message ID, see "Messages reported by event log and alert" in "Error messages" in the "Operation Guide".
Destination
Select a message destination from the following options.
Add
Add a command of the alert extension function. Click Add button to display the dialog box for entering a command.
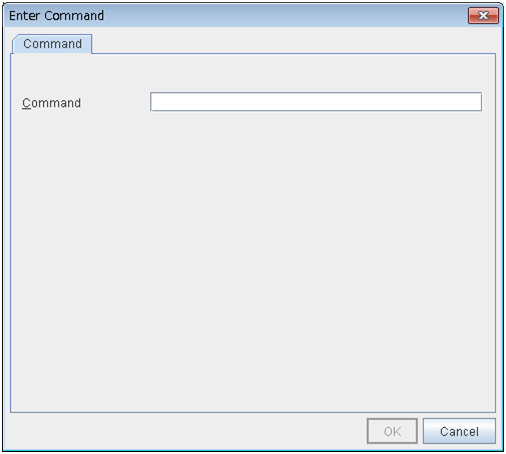
Command (within 511 bytes)
Enter any command you want to use.
Remove
Click this to remove a command of the alert extension function. Select the command, and then, click Remove.
Edit
Click this to modify a command of the alert extension function. Select the command, and then, click Edit.
SMTP Settings
Click this to display the SMTP Settings dialog box which is used for the mail alert.
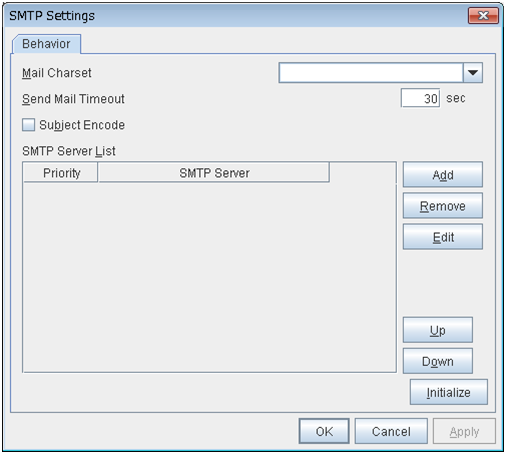
Mail Charset (within 127 bytes)
Configure the character set of the e-mails sent for mail report.
Send Mail Timeout (1 to 999)
Configure the timeout value for the communication with SMTP server.
Subject Encode
Configure whether or not to encode the subject of e-mails.
SMTP Server List
Use this button to display a SMTP server that has been configured. Only one SMTP server can be configured in this version.
Add
Use this button to add a SMTP server. Click Add to open the Enter the SMTP Server dialog box.
Remove
Select this to remove the SMTP server.
Edit
Use this button to modify the settings of SMTP server.
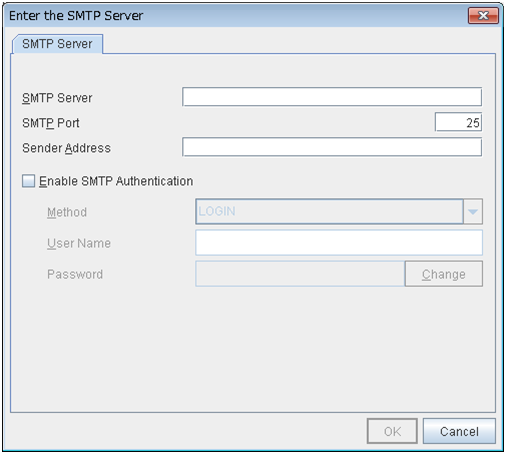
SMTP Server (within 255 bytes)
Configure the IP address or host name of the SMTP server.
SMTP Port (1 to 65,535)
Configure the port number of the SMTP server.
Sender Address (within 255 bytes)
Configure the address from which mail report is sent.
Enable SMTP Authentication
Configure whether or not to enable SMTP authentication.
Method
Select a method of SMTP authentication.
User Name (within 255 bytes)
Configure the user name used for SMTP authentication.
Password (within 255 bytes)
Configure the password used for SMTP authentication.
SNMP Settings
Click this to display the Destination Settings dialog box which is used for the SNMP trap.
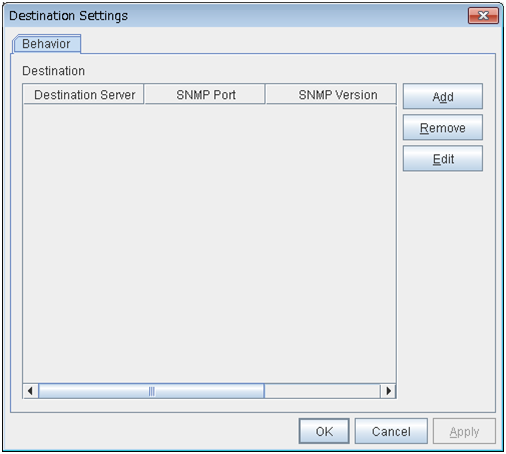
Destination
Displays the set SNMP trap transmission destinations. With this version, up to 32 SNMP trap transmission destinations can be set.
Add
Adds an SNMP trap transmission destination. Click Add to display the Change SNMP Destination dialog box.
Remove
Use Remove to remove the SNMP trap transmission destination settings.
Edit
Use Edit to modify the SNMP trap transmission destination settings.
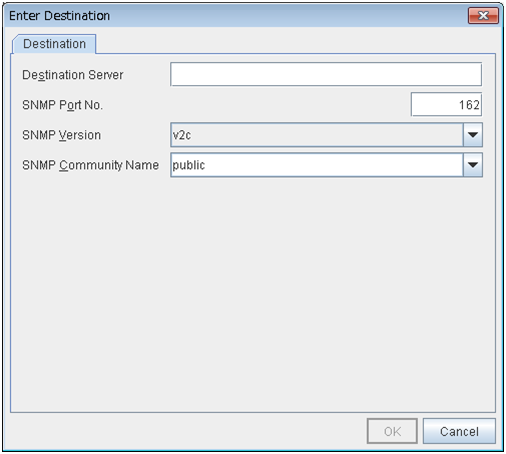
Destination Server (up to 255 bytes)
Configure the name of the SNMP trap transmission destination server.
SNMP Port No. (1-65535)
Configure the port number of the SNMP trap transmission destination.
SNMP Version
Configure the SNMP version of the SNMP trap transmission destination.
SNMP Community Name (up to 255 bytes)
Configure the SNMP community name of the SNMP trap transmission destination.
3.2.6. WebManager tab
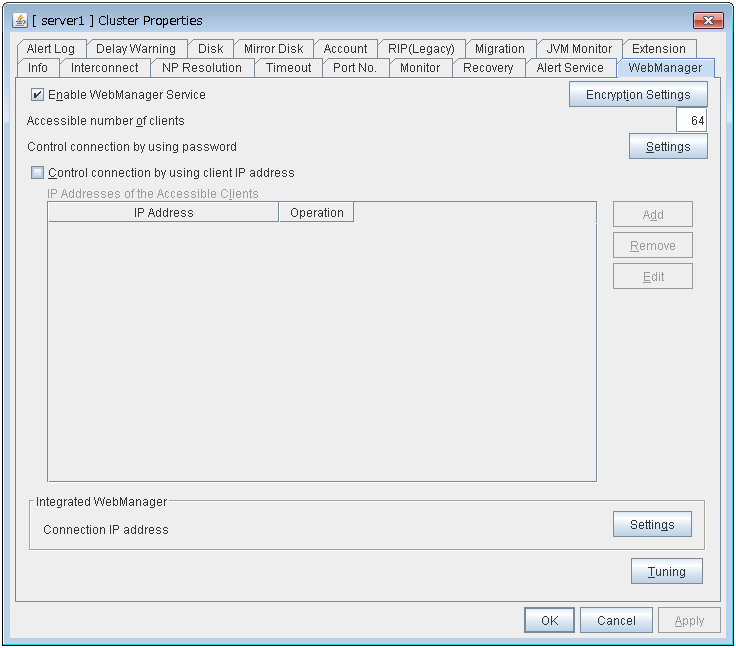
Enable WebManager Service
The WebManager service is enabled.
Encryption Settings
Make settings to encrypt the WebManager service.Click [Encryption Setting] to display the [Encryption Setting] dialog box.
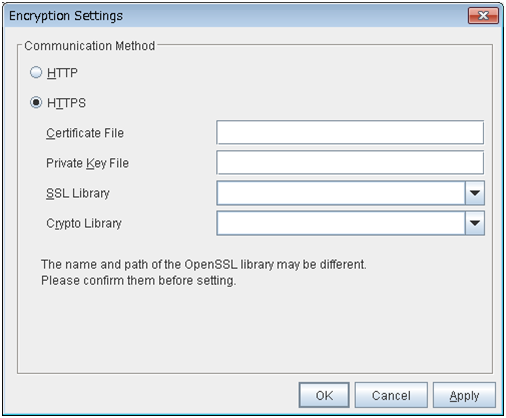
Communication Method
Certificate File
Sets the server credential file used for connecting to a client. Users need to prepare the server credential file.
Private Key File
Sets the private key file used for connecting to a client. Users need to prepare the private key file.
SSL Library
Sets the SSL library file used for encryption and selects the SSL library file included in OpenSSL. Users need to change it based on the environment, such as an installation folder.
Crypto Library
Sets the Crypto library file used for encryption and selects the Crypto library file included in OpenSSL. Users need to change it based on the environment, such as an installation folder.
Note
OpenSSL library is necessary to use HTTPS.
Accessible number of clients (1 to 999)
Specify the number of client machines that can be connected.
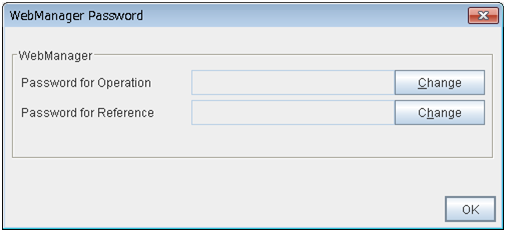
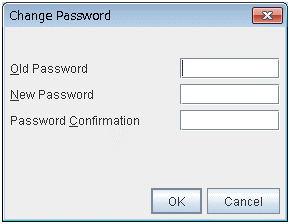
Control connection by using password
Click the Settings button to open the WebManager Password dialog box.WebManager
Control connection by using client IP address
If selected, accesses are controlled by client IP addresses.
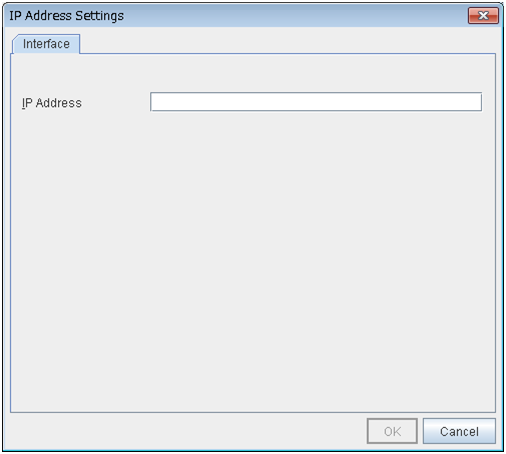
Add
Use Add to add an IP address in IP Addresses of the Accessible Clients. By clicking Add, the IP Address Settings dialog box is displayed to enter an IP address. Newly added IP addresses have the rights for the operation.
IP address: 10.0.0.21
Network address: 10.0.1.0/24
Remove
Use Remove to remove an IP address from IP Addresses of the Accessible Clients. Select an IP address you want to remove in IP Addresses of the Accessible Clients and click Remove.
Edit
Use Edit to change an IP address. Select an IP address you want to edit in IP Addresses of the Accessible Clients and click Edit. A dialog box where the specified IP address is preset is displayed. The rights for operating the edited IP addresses remain the same.
Operation
Specify the operation rights for IP addresses that are registered in IP Addresses of the Accessible Clients.
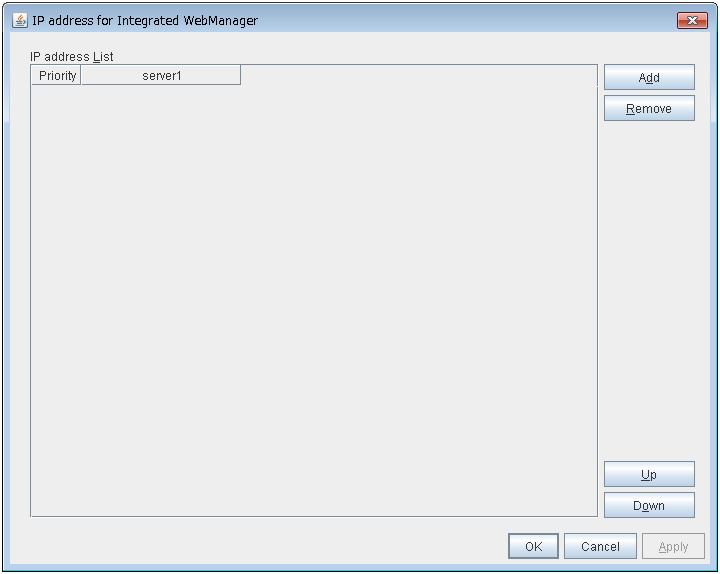
IP address for Integrated WebManager
Click the Settings button to open the IP address dialog box for the Integrated WebManager.
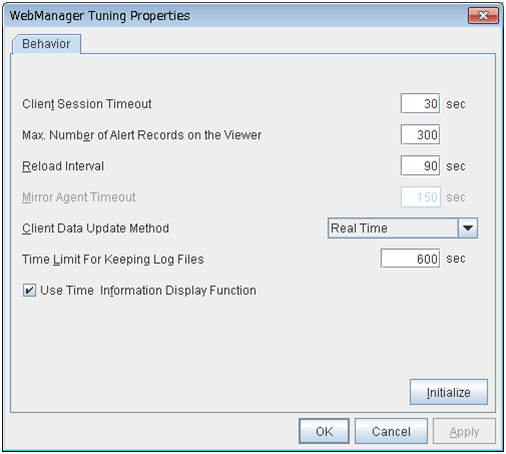
Tuning
Use Tuning to tune the WebManager. Click Tuning to open the WebManager Tuning Properties dialog box.
3.2.7. Alert Log tab
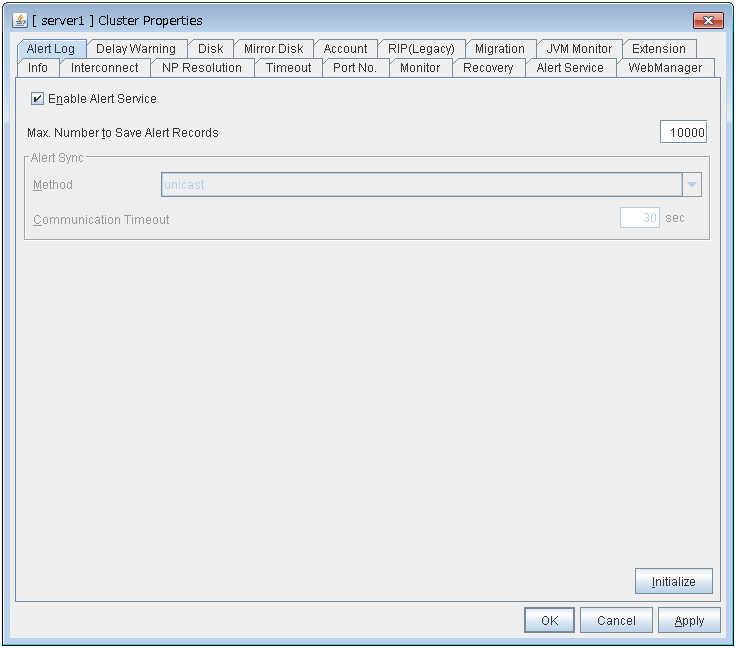
Enable Alert Service
Select this to start EXPRESSCLUSTER Web Alert service for the server.
Max. Number to Save Alert Records (1 to 99,999)
Specify the maximum number of alert records that can be retained. EXPRESSCLUSTER Web Alert service for server can retain alert messages up to this number.
Alert Sync: Method
Not used.
Alert Sync: Communication Timeout (1 to 300)
Not used.
Initialize
This operation is used to return the value to the default value. By selecting Initialize, initial values are configured for all items.
3.2.8. Delay Warning tab
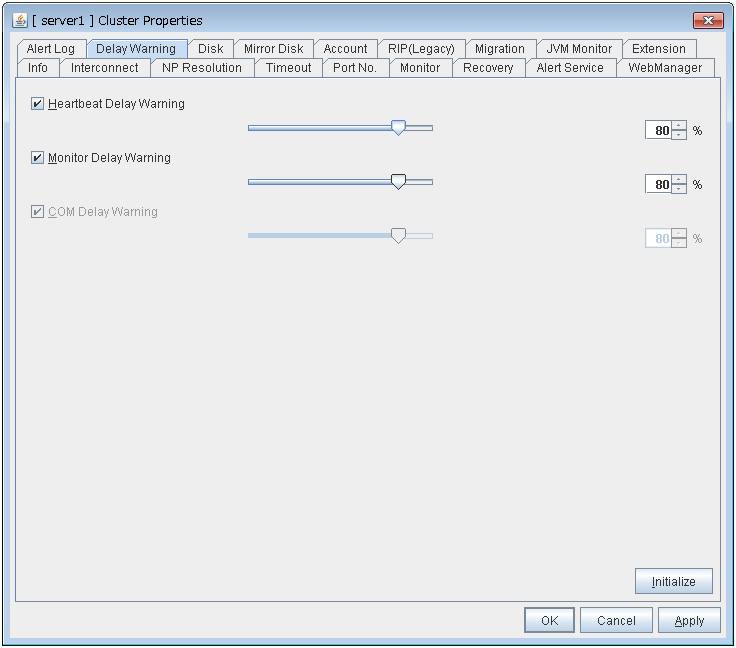
Heartbeat Delay Warning (1 to 99)
Set a percentage of heartbeat timeout at which the heartbeat delay warning is issued. If the time for the percentage passes without any heartbeat response, the warning will be produced in an alert log.
Monitor Delay Warning (1 to 99)
Set a percentage of monitor timeout at which the monitor delay warning is issued. If the time for the percentage passes without any monitor response, the warning will be produced in an alert log.
COM Delay Warning (1 to 99)
Not used.
Initialize
Click Initialize to reset all settings on this tab to default. Click Initialize to set all items to their default values.
3.2.9. JVM monitor tab
Configure detailed parameters for the JVM monitor.
Note
To display the JVM monitor tab on the online version Builder, you need to execute Update Server Info from the File menu after the license for Java Resource Agent is registered.
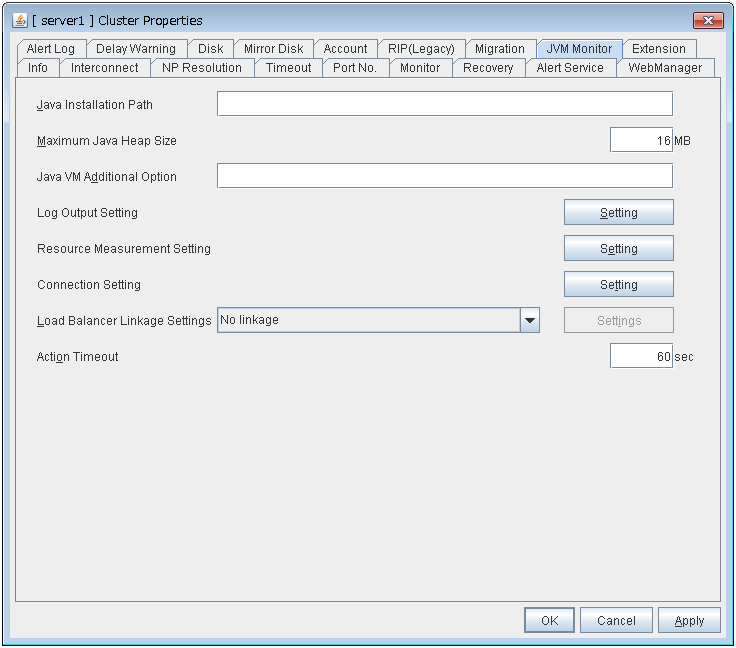
Java Installation Path(up to 255 bytes)
the Java VM install path used by the JVM monitor. Specify an absolute path using ASCII characters. Do not add "\" to the end of the path. This setting becomes common for all servers in the cluster. Specification example:
C:\Program Files\Java\jdk1.8.0_102
Maximum Java Heap Size(7 to 4096)
Set, in megabytes, the maximum Java VM heap size used by the JVM monitor (equivalent to -Xmx of the Java VM startup option). This setting becomes common for all servers in the cluster.
Java VM Additional Option (up to 1024 bytes)
Set the Java VM startup option used by the JVM monitor. However, specify -Xmx for Maximum Java Heap Size. This setting becomes common for all the servers in the cluster. Specification example: -XX:+UseSerialGC
Log Output Setting
Click the Setting button to open the Log Output Setting dialog box.
Resource measurement Setting
Click the Setting button to open the Resource Measurement Setting dialog box.
Connection Setting
Click the Setting button to open the Connection Setting dialog box.
Load Balancer Linkage Settings
Click the Setting button to open the Load Balancer Linkage Settings dialog box.
Action Timeout (30 to 300)
Set a timeout value for the [Command] that has been specified on each window of the JVM monitor. This setting becomes common for all of the [Commands].
Log Output Setting
Clicking Setting displays the Log Output Setting dialog box.
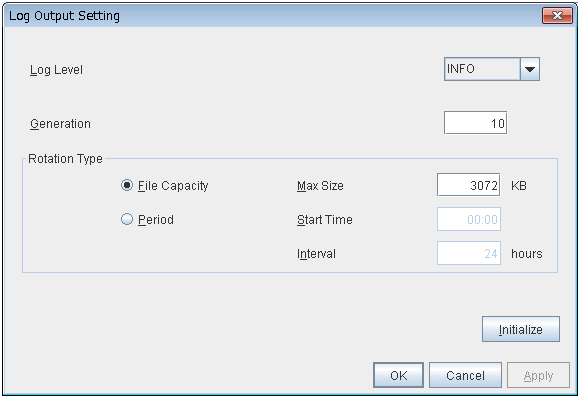
Log Level
Select the log level of the log output by the JVM monitor.
Generation (2 to 100)
Set the number of generations to be retained for the log output by the JVM monitor. When Period is selected for Rotation Type, the rotation count is reset when cluster is suspended. Therefore, note that log files under the
<EXPRESSCLUSTER_install_path>log\ha\jraincrease per cluster suspend.
Rotation Type
Select a rotation type for the log output by the JVM monitor. If you select File Capacity as the rotation type, set the maximum size (200 to 2097151), in kilobytes, for each log file such as the JVM operation log. If you select Period as the rotation type, set the log rotation start time in "hh:mm" format (hh: 0 to 23, mm: 0 to 59) and the rotation interval (1 to 8784) in hours.
Initialize
Clicking Initialize returns the log level, generation, and rotation type items to their default values.
Resource Measurement Setting [Common]
Clicking Setting displays the Resource Measurement Setting dialog box. For details on the scheme for error judgment by the JVM monitor, see , "Monitor resource details" in the "Configuration Guide".
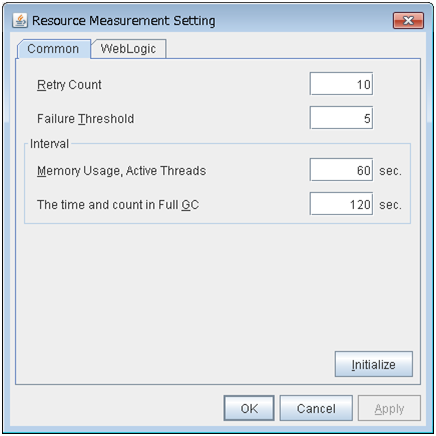
Retry Count (1 to 1440)
Set the resource measurement retry count to be applied if the JVM monitor fails in resource measurement.
Error Threshold (1 to 10)
Set the number of times abnormal judgment is performed when the usage of the Java VM or the application server resources collected by the JVM monitor via resource measurement continuously exceed the customer-defined threshold.
Memory Usage, Active Threads (15 to 600)
Set the interval at which the JVM monitor measures the memory usage and active thread count.
The time and count in Full GC (15 to 600)
Set the interval at which the JVM monitor measures the time and count in Full GC execution.
Initialize
Clicking Initialize returns the retry count, error threshold, and interval items to their default values.
Resource Measurement Setting [WebLogic]
Clicking Setting displays the Resource Measurement Setting dialog box. For details on the scheme for error judgment by the JVM monitor, see ,"Monitor resource details" in the "Configuration Guide".
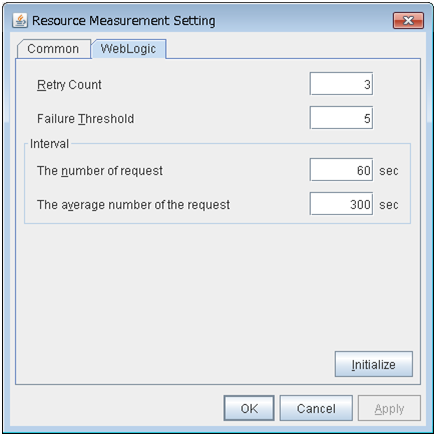
Retry Count (1 to 5)
Set the resource measurement retry count to be applied if the JVM monitor fails in resource measurement.
Error Threshold (1 to 10)
Set the number of times abnormal judgment is performed when the usage of the Java VM or the application server resources collected by the JVM monitor via resource measurement continuously exceed the customer-defined threshold.
The number of request (15 to 600)
Set the interval at which the JVM monitor measures the number of work manager or thread pool requests during WebLogic monitor.
The average number of the request (15 to 600)
Set the interval at which the JVM monitor measures the average number of work manager or thread pool requests during WebLogic monitor. Set a value that is an integer multiple of the value set in Interval: The number of request.
Initialize
Clicking Initialize returns the retry count, error threshold, and interval items to their default values.
Connection Setting
Clicking Setting displays the Connection Settings dialog box.
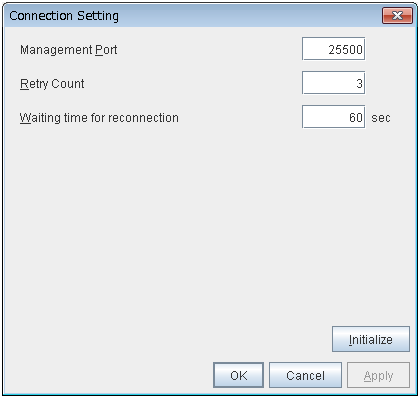
Management Port (10000 to 65535)
Sets the port number internally used by the JVM monitor resource. Make sure not to set the port number that has been used by other functions or programs.Set the number of the port connected to the monitor target Java VM. This setting becomes common for all the servers in the cluster. Do not set 42424 to 61000.
Retry Count for (1 to 5)
Set the retry count to be applied if connection to the monitor target Java VM fails.
Waiting time for reconnection (15 to 60)
Set the interval at which the JVM monitor retries connection if it fails in Java VM connection.
Initialize
Clicking Initialize sets the management port, retry count, and waiting time for reconnection items to their default values.
Load Balancer Linkage Settings
Clicking Setting displays the Load Balancer Linkage Settings dialog box.
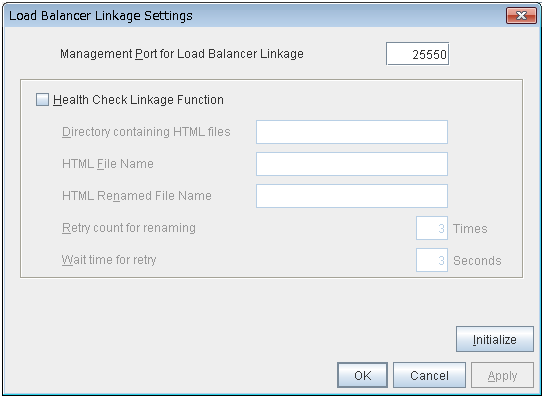
Management Port for Load Balancer Linkage (10000 to 65535)
Set the port number used by the load balancer linkage function. This setting becomes common to all the servers in the cluster. Do not set 42424 to 61000.
Health Check Linkage Function
Set whether to use the load balancer health check function if the monitor target Java VM detects a failure.
Directory containing HTML files(up to 255 bytes)
Set the directory in which the HTML file used by the load balancer health check function is stored.
HTML File Name(up to 255 bytes)
Set the HTML file name used by the load balancer health check function.
HTML Renamed File Name(up to 255 bytes)
Set the HTML renamed file name used by the load balancer health check function.
Retry count for renaming (0 to 5)
Set the number of times HTML file renaming is retried if it fails.
Wait time for retry (1 to 60)
Set the interval at which HTML file renaming is retried if it fails.
Initialize
Clicking Initialize returns the management port for load balancer linkage, health check linkage function, directory containing HTML files, HTML file name, HTML renamed file name, retry count for renaming, and wait time for retry retry interval items to their default values.
Load Balancer Linkage Settings
Select BIG-IP LTM as the load balancer type and then click the Settings button. The Load Balancer Linkage Settings dialog box appears.
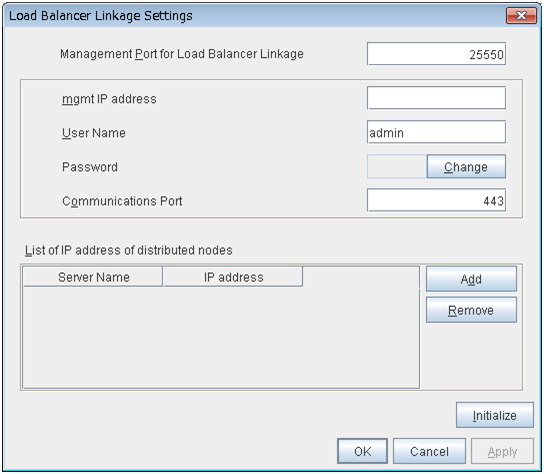
Management Port for Load Balancer Linkage (10000 to 65535)
Set the port number used by the load balancer linkage function. This setting becomes common to all the servers in the cluster. Do not set 42424 to 61000.
mgmt IP address
Set the BIG-IP LTM IP address.
User Name (up to 255 bytes)
Set the BIG-IP LTM management user name.
Password (up to 255 bytes)
Set the BIG-IP LTM management user password.
Communications Port(10000 to 65535)
Set the communication port number for BIG-IP LTM.
Add
Add the server name and IP address for the distributed node. For the server name, specify the computer name. For the IP address, specify the value set to Members in LocalTrafic - Pools:PoolList - Relevant pool - Members of BIG-IP Configuration Utility.To change the value, select the line and directly edit the description.
Remove
Remove the server name and IP address for the distributed node. Select the line to be removed and then click Remove. The selected server is removed.
Initialize
Clicking Initialize returns the management port for load balancer linkage, management user name, and communication port number to the default settings.
3.2.10. Extension tab
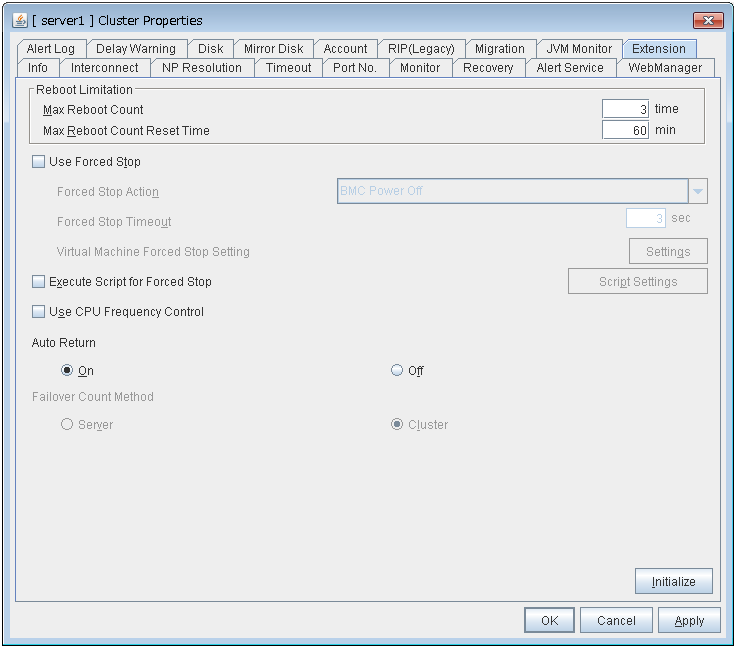
Reboot Limitation
You can specify the Reboot OS or Shut down OS as the final action at abnormality detection for group resources and monitor resources. If either of them is selected, reboot may be repeated infinitely. By setting the reboot limit, you can prevent repeated reboots.
Note
If Max Reboot Count is set to 1 or greater, set Max Reboot Count Reset Time also to 1 or greater. If the time to reset the maximum reboot count is set to zero (0), the number of reboot will be unavailable, thus, shutdown/reboot are executed every time at failure detection regardless of the maximum reboot count.
Use Forced Stop
Not used.
Forced Stop Action
Not used.
Forced Stop Timeout (0 to 99)
Not used.
Virtual Machine Forced Stop Setting
Not used.
Execute Script for Forced Stop
Not used.
Script Settings
Not used.
Use CPU Frequency Control
Select the checkbox when you use CPU frequency control. If you uncheck the checkbox, CPU frequency control is disabled.
See also
Note
For using CPU frequency control, it is required that the frequency is changeable in BIOS settings and the CPU supports the frequency control by Windows OS power management function.
Note
If you disable CPU frequency control function with CPU frequency changed, the CPU frequency does not return to the state before changing. In this case, return the CPU frequency to the defined value by the following way.
Auto Return
Failover Count Method
Not used.
Initialize
This operation is used to return the value to the default value.
3.3. Server properties
IP address: 10.1.1.10, Subnet mask: 255.255.0.0
IP address: 10.1.2.10, Subnet mask: 255.255.255.0
3.3.1. Info tab
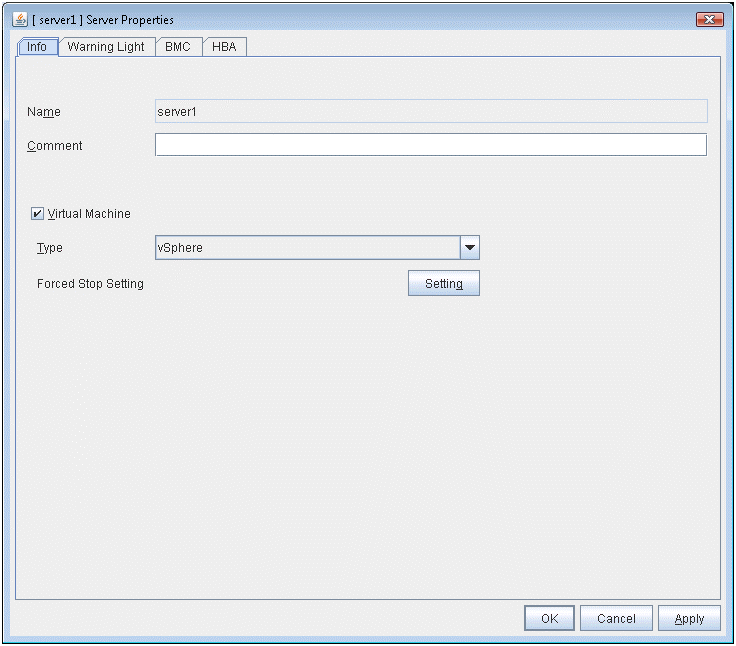
Name:
The selected server name is displayed. You cannot change the name here.
Comment (within 127 bytes)
You can specify a comment for the server. You can only enter one byte English characters.
Virtual Machine
Specify whether this server is a virtual machine (guest OS).
Type
Specify the type of virtual infrastructure.
Forced Stop Setting
Not used.
3.3.2. Warning Light tab
Not used.
3.3.3. BMC tab
Not used.
3.3.4. HBA tab
Not used.
3.4. Installing the offline version of the Builder
It is not necessary to install the offline version of the Builder on the server on which EXPRESSCLUSTER X SingleServerSafe is installed. If you will create or modify the configuration data of EXPRESSCLUSTER X SingleServerSafe by using a machine that cannot access EXPRESSCLUSTER X SingleServerSafe through a Web browser, you need to install the offline version of the EXPRESSCLUSTER Builder on that machine.
Follow the procedures below to install the offline version of the Builder.
Note
Install the Builder with the administrator privilege.
Insert the Installation CD-ROM to the CD-ROM drive.
Select NEC EXPRESSCLUSTER® SingleServerSafe for Windows.
Note
If the menu screen does not open automatically, double-click menu.exe in the root folder of the CD-ROM.
Select NEC EXPRESSCLUSTER® SingleServerSafe Accessories.
Select NEC EXPRESSCLUSTER® SingleServerSafe Builder.
Select where to install in the Cluster Builder self-extracting dialog and click Decompress.
Click OK in the ZIP Self Decompression dialog box. Installation is completed.
Load the following file with a Web browser to start up the offline version of the Builder:
<installation path>/clptrek.htm
3.5. Uninstalling the offline version of the Builder
To uninstall the Builder, follow the procedures below:
Exit from all Web browsers (confirm that the JavaVM icon is no longer in the task tray).
Delete the Builder installation folder from Windows Explorer.
3.6. Limitations of the Builder
The configuration data of the following products is not compatible.
A Builder other than that for EXPRESSCLUSTER X SingleServerSafe 4.0 for Windows
The Builder of EXPRESSCLUSTER for Linux
The Builder of EXPRESSCLUSTER for Windows Value Edition
Cluster configuration data created using a later version of this product cannot be used with this product.
- Cluster configuration data of EXPRESSCLUSTER X SingleServerSafe 1.0/2.0/2.1/3.0/3.1/3.2/3.3/4.0 for Windows can be used with this product.You can use such data by clicking Import from the File menu in the Builder.
- Closing the Web browser (by clicking Exit from the menu), the dialog box to confirm to save is displayed.
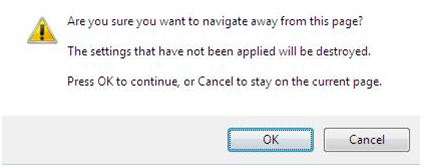 When you continue to edit, click the Cancel button.
Note
This dialog box is not displayed if JavaScript is disabled.
- Reloading the Web browser (by selecting Refresh from the menu or tool bar) , the dialog box to confirm to save is displayed.
 When you continue to edit, click the Cancel button.
Note
This dialog box is not displayed if JavaScript is disabled.
If you change the screen resolution while the Builder is running, the Java VM stack trace (example: NullPointerException) may be logged on the Java console. The Builder can keep running.
If you press Esc while a pull-down menu of your browser is displayed, the Java VM stack trace (example: NullPointerException) may be logged on the Java console. The Builder can keep running.
In some cases, you cannot use the keyboard because the keyboard focus of the Builder becomes disabled (the focus changes to the Web browser). Click the Builder window and get the focus back to the Builder.
When you are using the multi-display function, do not run the Builder on the secondary display. Otherwise, it may not work properly. For example, the screen is not displayed. Use the Builder on the primary display.
If you specify a number smaller than the current one for Max. Number to Save Alert Records on the Alert Log tab (see "3.2.7. Alert Log tab"), all alert logs are deleted. Take into account the available disk space, and specify the number before you start the operation.
In the environment where Internet Explorer is used, disable Protected Mode on the security setting of Internet Explorer.
The JIS 2004-unique characters are not supported. Thus, you cannot enter or view the characters added by JIS 2004.
When going through the reverse proxy server, the Builder will not operate properly.
When you use the Offline Builder and the EXPRESSCLUSTER, a combination of their versions should be the one shown below. The Builder may not operate properly if they are used in a different combination.
Offline Builder version
EXPRESSCLUSTER internal version
4.0.0-1
1212.01