4. Monitor resource details
This chapter provides detailed information on monitor resources. Monitor resource is a unit to perform monitoring.
This chapter covers:
4.11. Understanding registry synchronization monitor resources
4.49. Understanding Google Cloud Virtual IP monitor resources
4.50. Understanding Google Cloud load balance monitor resources
4.52. Understanding Oracle Cloud Virtual IP monitor resources
4.53. Understanding Oracle Cloud load balance monitor resources
4.1. Monitor resources
A monitor resource refers to a resource that monitors a specified target to be monitored. When detecting an error in a target to be monitored, a monitor resource restarts a group resource and/or executes failover.
Currently supported monitor resource are as follows:
Monitor resource name |
Abbreviation |
Functional overview |
|---|---|---|
Application monitor resources |
appliw |
Refer to "Understanding application monitor resources". |
Disk RW monitor resources |
diskw |
Refer to "Understanding disk RW monitor resources". |
Floating IP monitor resources |
fipw |
Refer to "Understanding floating IP monitor resources". |
IP monitor resources |
ipw |
Refer to "Understanding IP monitor resources". |
Mirror disk monitor resources |
mdw |
Refer to "Understanding mirror disk monitor resources". |
NIC Link Up/Down monitor resources |
miiw |
Refer to "Understanding NIC link up/down monitor resources". |
Multi target monitor resources |
mtw |
Refer to "Understanding multi target monitor resources". |
Registry synchronization monitor resources |
regsyncw |
Refer to "Understanding registry synchronization monitor resources". |
Disk TUR monitor resources |
sdw |
Refer to "Understanding disk TUR monitor resources". |
Service monitor resources |
servicew |
Refer to "Understanding service monitor resources". |
Virtual computer name monitor resources |
vcomw |
Refer to "Understanding virtual computer name monitor resources". |
Dynamic DNS monitor resources |
ddnsw |
Refer to "Understanding dynamic DNS monitor resources". |
Virtual IP monitor resources |
vipw |
Refer to "Understanding virtual IP monitor resources". |
CIFS monitor resources |
cifsw |
Refer to "Understanding CIFS monitor resources". |
Hybrid disk monitor resources |
hdw |
Refer to "Understanding hybrid disk monitor resources". |
Hybrid disk TUR monitor resources |
hdtw |
Refer to "Understanding hybrid disk TUR monitor resources". |
Custom monitor resources |
genw |
Refer to "Understanding custom monitor resources ". |
Message receive monitor resources |
mrw |
Refer to "Understanding message receive monitor resources". |
Process name monitor resources |
psw |
Refer to "Understanding process name monitor resources". |
DB2 monitor resources |
db2w |
Refer to "Understanding DB2 monitor resources". |
FTP monitor resources |
ftpw |
Refer to "Understanding FTP monitor resources ". |
HTTP monitor resources |
httpw |
Refer to "Understanding HTTP monitor resources". |
IMAP4 monitor resources |
imap4w |
Refer to "Understanding IMAP4 monitor resources". |
ODBC monitor resources |
odbcw |
Refer to "Understanding ODBC monitor resources". |
Oracle monitor resources |
oraclew |
Refer to "Understanding Oracle monitor resources". |
POP3 monitor resources |
pop3w |
Refer to "Understanding POP3 monitor resources". |
PostgreSQL monitor resources |
psqlw |
Refer to "Understanding PostgreSQL monitor resources". |
SMTP monitor resources |
smtpw |
Refer to "Understanding SMTP monitor resources". |
SQL Server monitor resources |
sqlserverw |
Refer to "Understanding SQL Server monitor resources". |
Tuxedo monitor resources |
tuxw |
Refer to "Understanding Tuxedo monitor resources". |
WebSphere monitor resources |
wasw |
Refer to "Understanding WebSphere monitor resources". |
WebLogic monitor resources |
wlsw |
Refer to "Understanding WebLogic monitor resources". |
WebOTX monitor resources |
otxw |
Refer to "Understanding WebOTX monitor resources". |
JVM monitor resources |
jraw |
Refer to "Understanding JVM monitor resources". |
Process resource monitor resources |
psrw |
Refer to "Understanding process resource monitor resources". |
System monitor resources |
sraw |
Refer to "Understanding system monitor resources". |
User mode monitor resources |
userw |
Refer to "Understanding user mode monitor resources". |
AWS elastic ip monitor resources |
awseipw |
Refer to "Understanding AWS elastic ip monitor resources". |
AWS virtual ip monitor resources |
awsvipw |
Refer to "Understanding AWS virtual ip monitor resources". |
AWS secondary ip monitor resources |
awssipw |
Refer to "Understanding AWS secondary ip monitor resources". |
AWS AZ monitor resources |
awsazw |
Refer to "Understanding AWS AZ monitor resources". |
AWS DNS monitor resources |
awsdnsw |
Refer to "Understanding AWS DNS monitor resources". |
Azure probe port monitor resources |
azureppw |
Refer to "Understanding Azure probe port monitor resources". |
Azure load balance monitor resources |
azurelbw |
Refer to "Understanding Azure load balance monitor resources". |
Azure DNS monitor resources |
azurednsw |
Refer to "Understanding Azure DNS monitor resources". |
Google Cloud Virtual IP monitor resources |
gcvipw |
Refer to "Understanding Google Cloud Virtual IP monitor resources". |
Google Cloud load balance monitor resources |
gclbw |
Refer to "Understanding Google Cloud load balance monitor resources". |
Google Cloud DNS monitor resources |
gcdnsw |
Refer to "Understanding Google Cloud DNS monitor resources". |
Oracle Cloud Virtual IP monitor resources |
ocvipw |
Refer to "Understanding Oracle Cloud Virtual IP monitor resources". |
Oracle Cloud load balance monitor resources |
oclbw |
Refer to "Understanding Oracle Cloud load balance monitor resources". |
4.1.1. Monitor timing of monitor resources
Depending on the monitor resource, the configurable monitoring timing varies.
- Always:Monitoring is performed by the monitor resource all the time.
- Active:Monitoring is performed by the monitor resource while a specified group resource is active. The monitor resource does not monitor while the group resource is not activated.
Cluster startup
Group activation
Group deactivation
Cluster stop
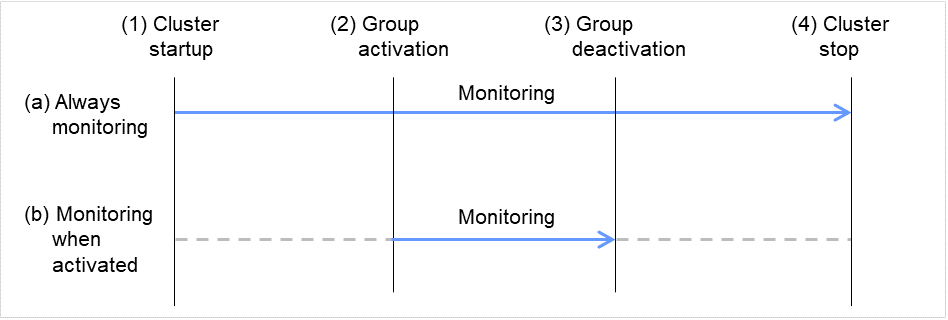
Fig. 4.1 Two types of monitoring by monitor resources: Always and Active
The default settings are as follows.
Always monitor (From the cluster startup to the cluster stop)
IP monitor resources
Mirror disk monitor resources
Hybrid disk monitor resources
Hybrid disk TUR monitor resources
NIC Link Up/Down monitor resources
Disk TUR monitor resources
Custom monitor resources
Message receive monitor resources
Process name monitor resources
System monitor resources
Process resource monitor resources
User mode monitor resources
AWS AZ monitor resources
Azure load balance monitor resources
Google Cloud load balance monitor resources
Oracle Cloud load balance monitor resources
Monitor while a group is activated (from activation to deactivation of the group)
Application monitor resources
Disk RW monitor resources
Floating IP monitor resources
Multi target monitor resources
Registry synchronization monitor resources
Service monitor resources
Virtual computer name monitor resources
Dynamic DNS monitor resources
Virtual IP monitor resources
CIFS monitor resources
DB2 monitor resources
FTP monitor resources
HTTP monitor resources
IMAP4 monitor resources
ODBC monitor resources
Oracle monitor resources
POP3 monitor resources
PostgreSQL monitor resources
SMTP monitor resources
SQL Server monitor resources
Tuxedo monitor resources
WebSphere monitor resources
WebLogic monitor resources
WebOTX monitor resources
JVM monitor resources
AWS elastic ip monitor resources
AWS virtual ip monitor resources
AWS secondary ip monitor resources
AWS DNS monitor resources
Azure probe port monitor resources
Azure DNS monitor resources
Google Cloud Virtual IP monitor resources
Google Cloud DNS monitor resources
Oracle Cloud Virtual IP monitor resources
Monitor resource |
Monitor timing |
Target resource |
|---|---|---|
Application monitor resources |
When activated (Fixed) |
appli |
Disk RW monitor resources |
Always or when activated |
All resources |
Floating IP monitor resources |
When activated (Fixed) |
fip |
IP monitor resources |
Always or when activated |
All resources |
Mirror disk monitor resources |
Always (Fixed) |
- |
NIC link up/down monitor resources |
Always or when activated |
All resources |
Multi target monitor resources |
Always or when activated |
All resources |
Registry synchronization monitor resources |
When activated (Fixed) |
regsync |
Disk TUR monitor resources |
Always or when activated |
sd |
Service monitor resources |
Always or when activated |
All resources |
Virtual computer name monitor resources |
When activated (Fixed) |
vcom |
Dynamic DNS monitor resources |
When activated (Fixed) |
ddns |
Virtual IP monitor resources |
When activated (Fixed) |
vip |
CIFS monitor resources |
When activated (Fixed) |
cifs |
Hybrid disk monitor resources |
Always (Fixed) |
- |
Hybrid disk TUR monitor resources |
Always or when activated |
Hd |
Custom monitor resources |
Always or when activated |
All resources |
Message receive monitor resources |
Always (Fixed) |
- |
Process name monitor resources |
Always or when activated |
All resources |
DB2 monitor resources |
When activated (Fixed) |
All resources |
FTP monitor resources |
When activated (Fixed) |
All resources |
HTTP monitor resources |
When activated (Fixed) |
All resources |
IMAP4 monitor resources |
When activated (Fixed) |
All resources |
ODBC monitor resources |
When activated (Fixed) |
All resources |
Oracle monitor resources |
When activated (Fixed) |
All resources |
POP3 monitor resources |
When activated (Fixed) |
All resources |
PostgreSQL monitor resources |
When activated (Fixed) |
All resources |
SMTP monitor resources |
When activated (Fixed) |
All resources |
SQL Server monitor resources |
When activated (Fixed) |
All resources |
Tuxedo monitor resources |
When activated (Fixed) |
All resources |
WebSphere monitor resources |
When activated (Fixed) |
All resources |
WebLogic monitor resources |
When activated (Fixed) |
All resources |
WebOTX monitor resources |
When activated (Fixed) |
All resources |
JVM monitor resources |
Always or when activated |
All resources |
System monitor resources |
Always (Fixed) |
All resources |
Process resource monitor resources |
Always (Fixed) |
All resources |
User mode monitor resources |
Always (Fixed) |
- |
AWS elastic ip monitor resources |
When activated (Fixed) |
awseip |
AWS virtual ip monitor resources |
When activated (Fixed) |
awsvip |
AWS secondary ip monitor resources |
When activated (Fixed) |
awssip |
AWS AZ monitor resources |
Always (Fixed) |
- |
AWS DNS monitor resources |
When activated (Fixed) |
awsdns |
Azure probe port monitor resources |
When activated (Fixed) |
azurepp |
Azure load balance monitor resources |
Always (Fixed) |
azurepp |
Azure DNS monitor resources |
When activated (Fixed) |
azuredns |
Google Cloud Virtual IP monitor resources |
When activated (Fixed) |
gcvip |
Google Cloud load balance monitor resources |
Always (Fixed) |
gcvip |
Oracle Cloud Virtual IP monitor resources |
When activated (Fixed) |
ocvip |
Oracle Cloud load balance monitor resources |
Always (Fixed) |
ocvip |
4.1.2. Enabling and disabling Dummy failure of monitor resources
- Operation on Cluster WebUI (verification mode)On the Cluster WebUI (Verification mode), shortcut menus of the monitor resources which cannot control monitoring are disabled.
- Operation by using the clpmonctrl commandThe clpmonctrl command can control the server where this command is run or the monitor resources of the specified server. When the clpmonctrl command is executed on monitor resource which cannot be controlled, dummy failure is not enabled even though the command succeeds.
Dummy failure of a monitor resource is disabled if the following operations are performed.
- Dummy failure was disabled on Cluster WebUI (verification mode)
- "Yes" was selected from the dialog displayed when the Cluster WebUI mode changes from verification mode to a different mode.
- -n was specified to enable dummy failure by using the clpmonctrl command
- Stop the cluster
- Suspend the cluster
4.1.3. Monitoring interval for monitor resources
All monitor resources monitor their targets at every monitoring interval.
The following describes the timeline of how a monitor resource monitors its target and finds an error with the monitoring interval settings:
When no error is detected
The following figure illustrates monitoring started/resumed after the cluster is started. When the main monitoring process receives the monitoring result, the monitoring is repeatedly started at the monitor intervals.
Examples of behavior when the following values are set:
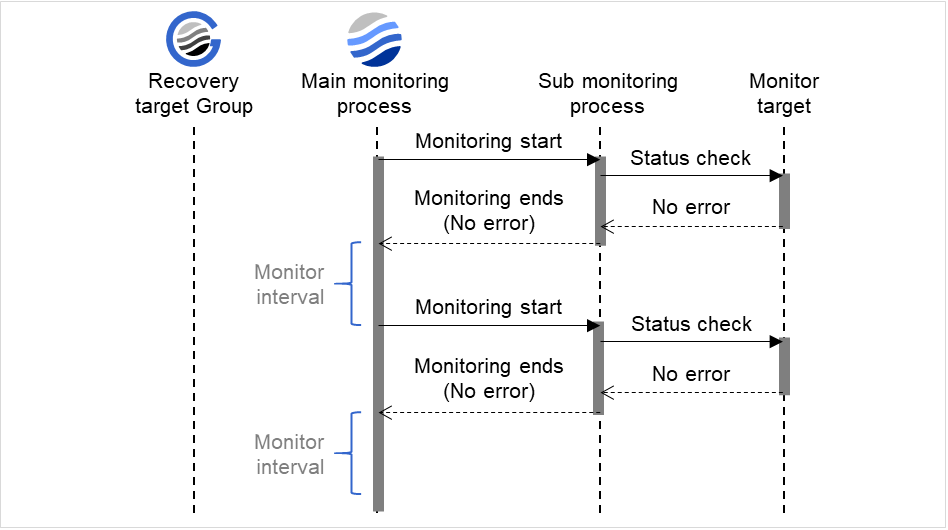
Fig. 4.2 Monitor interval (when no error is detected)
When an error is detected (without monitor retry setting)
The following figure illustrates an error occurring in the monitor target, and the operation after the error is detected. When the main monitoring process receives the monitoring result (error), a failover of the group to be recovered is performed.
When an error occurs, it is detected at the next monitoring and the recovery operation for the recovery target starts.
Examples of behavior when the following values are set:
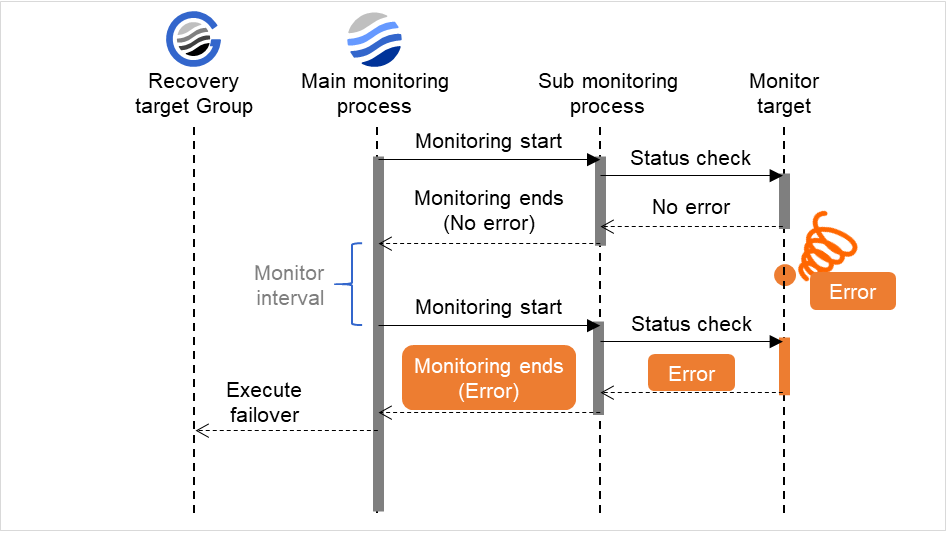
Fig. 4.3 Monitor interval (when an error is detected without monitor retry setting)
When an error is detected (with monitor retry settings)
The following figure illustrates an error occurring in the monitor target, and the operation after the error is detected. When the main monitoring process receives the monitoring result (error), the monitoring continues by its specified count of retries. If the monitoring target is still not recovered, a failover of the group to be recovered is performed.
When an error occurs, it is detected at the next monitoring. If recovery cannot be achieved within the monitor retries, the failover is started for the recovery target.
Examples of behavior when the following values are set:
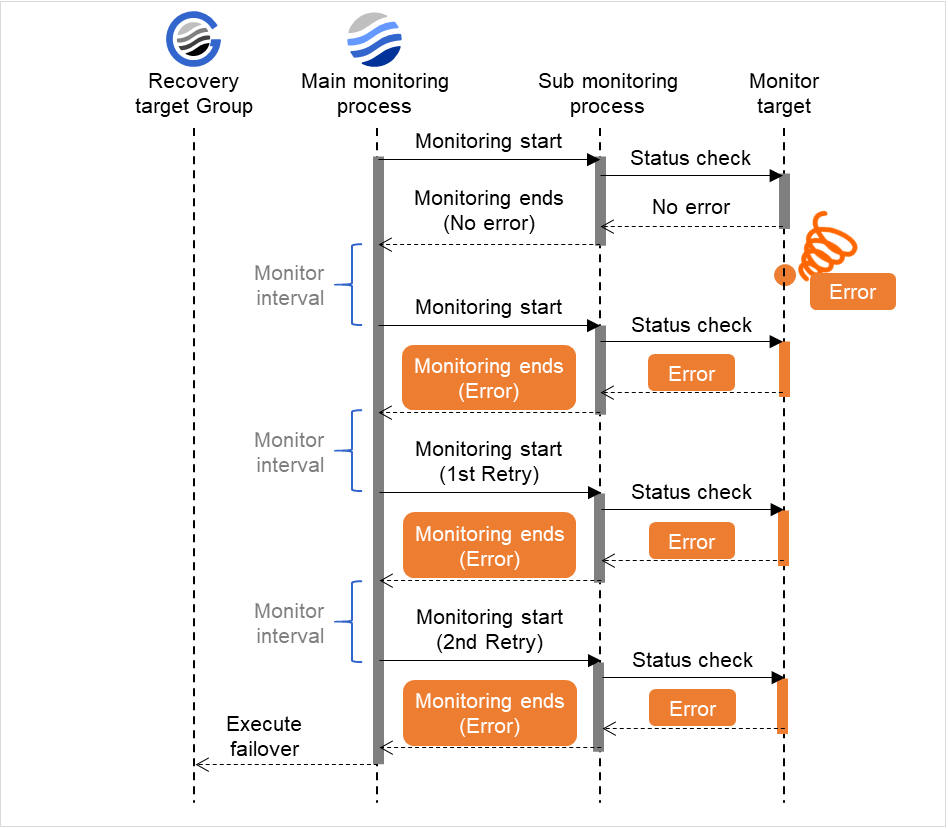
Fig. 4.4 Monitor interval (when an error is detected with monitor retry setting)
When an error is detected (without monitor retry settings)
The following figure illustrates operation in response to a monitoring process unfinished within a specified time. The main monitoring process starts the monitoring. Then, if the monitoring result cannot be obtained within a specified monitoring timeout time, a failover of the group to be recovered is performed.
Immediately after an occurrence of a monitoring timeout, the failover for the recovery target starts.
Examples of behavior when the following values are set.
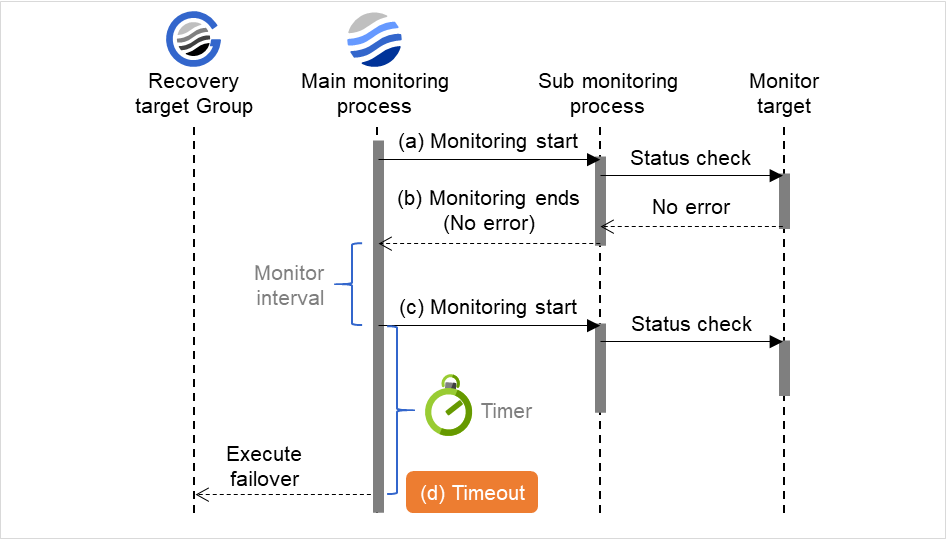
Fig. 4.5 Monitor interval (when a monitoring timeout is detected without monitor retry setting)
When a monitoring timeout is detected (with monitor retry setting)
The following figure illustrates operation in response to a monitoring process unfinished within a specified time. The main monitoring process starts the monitoring. Then, if the monitoring result cannot be obtained within a specified monitoring timeout time, the monitoring continues by its specified count of retries. If the monitoring result still cannot be obtained, a failover of the group to be recovered is performed.
When a monitoring timeout occurs, monitor retry is performed and failover is started for the recovery target.
Examples of behavior when the following values are set:
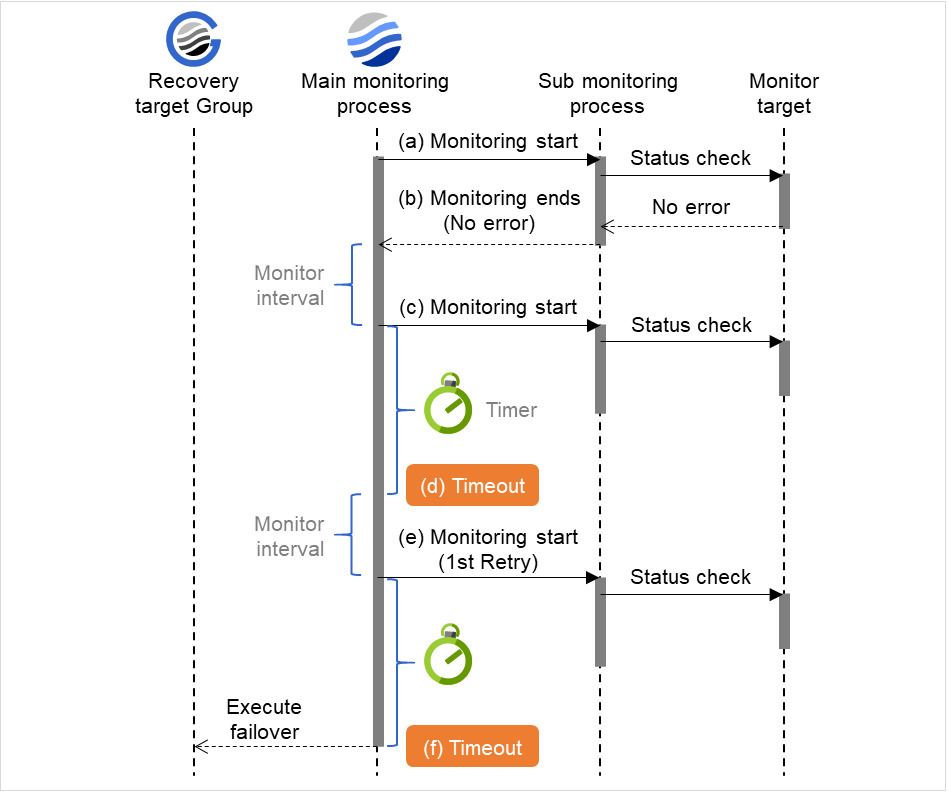
Fig. 4.6 Monitor interval (when a monitoring timeout is detected with monitor retry setting)
4.1.4. Behavior when an error is detected by a monitor resource
When an error is detected, the following recovery actions are taken against the recovery target in sequence:
Execution of the recovery script: this takes place when an error is detected in a monitor target.
Reactivation of the recovery target: this takes place if the recovery script is executed up to the recovery script execution count. When the execution of a pre-reactivation script is specified, reactivation starts after that script has been executed.
Failover: this takes place when reactivation fails for the number of times set in the reactivation threshold. When the execution of a pre-failover script is specified, failover starts after that script has been executed.
Final action: this takes place when the error is detected even after the failover is executed for the number of times set in the failover threshold (When the recovery target is the group resource or the failover group, the number of failover times is shared in the cluster. When the recovery target is All Groups, the number of failover times is counted by each server.). When the execution of a pre-final action script is specified, the final action starts after that script has been executed.
No recovery action is taken if the status of the recovery target is:
Recovery target |
Status |
Reactivation 1 |
Failover 2 |
Final action 3 |
|---|---|---|---|---|
Group resource/
Failover group
|
Already stopped |
No |
No |
No |
Being activated/stopped |
No |
No |
No |
|
Already activated |
Yes |
Yes |
Yes |
|
Error |
Yes |
Yes |
Yes |
|
Local Server |
- |
- |
- |
Yes |
Yes: Recovery action is taken No: Recovery action is not taken
- 1
Effective only when the value for the reactivation threshold is set to 1 (one) or greater.
- 2
Effective only when the value for the failover threshold is set to 1 (one) or greater.
- 3
Effective only when an option other than No Operation is selected.
Note
Do not operate the following by running commands or using the Cluster WebUI when a group resource (e.g. disk resource, application resource) is set as a recovery target in the settings of error detection for the monitor resource, and recovery is in progress (reactivation -> failover -> final action) after detection of an error:
Stop/suspend the cluster
Start/stop/move a group
If you perform the above-mentioned operations while recovery caused by detection of an error by a monitor resource is in progress, other group resources of the group with an error may not stop.However, you can perform them when the final action is completed.When Server is selected for Failover Count MethodWhen the status of the monitor resource recovers (becomes normal) from error, the reactivation count, failover count, and if the final action is executed are reset.When Cluster is selected for Failover Count MethodWhen the status of the monitor resource recovers (becomes normal) from error, the reactivation count, failover count, and if the final action is executed are reset. Note that when group resource or failover group is specified as recovery target, these counters are reset only when the status of all the monitor resources in which the same recovery targets are specified are normal.An unsuccessful recovery action is also counted into reactivation count or failover count.
The following is an example of the progress when only one server detects an error while the gateway is specified as an IP address of the IP monitor resource:
Examples of behavior when the following values are set:
The following figure shows an example of monitoring by the IP monitor resource on two servers. To check for the aliveness, IP monitor resource 1 accesses the gateway's IP address at the intervals.

Fig. 4.7 Flow of error detection by the IP monitor resource: when only one server detects an error (1)
Server 1IP monitor resource 1Server 2IP monitor resource 1Recovery Script Execution Count
0
0
Reactivation Count
0
0
Failover Count
0
0
IP monitor resource 1 detects an error (such as a LAN cable disconnection and an NIC malfunction).

Fig. 4.8 Flow of error detection by the IP monitor resource: when only one server detects an error (2)
IP monitor resource 1 retries the monitoring up to three times.
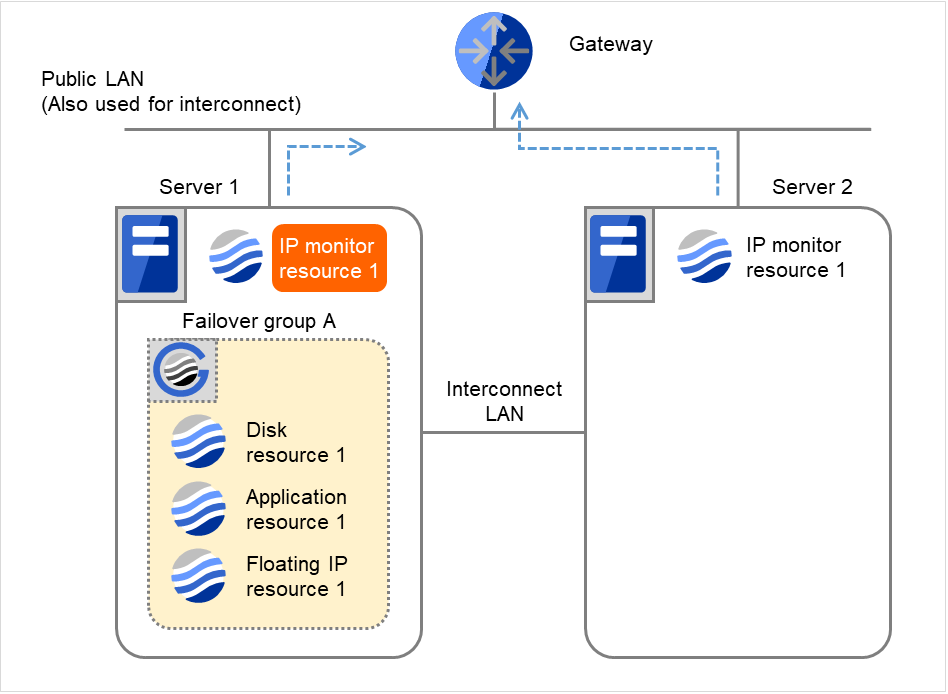
Fig. 4.9 Flow of error detection by the IP monitor resource: when only one server detects an error (3)
- If the specified monitor retry count is exceeded, the recovery script starts to be executed on Server 1.Recovery Script Execution Count means how many times the recovery script is executed on each server.This is the first execution of the recovery script on Server 1.The recovery is not made on Server 2, because the status of Failover group A is Already stopped.
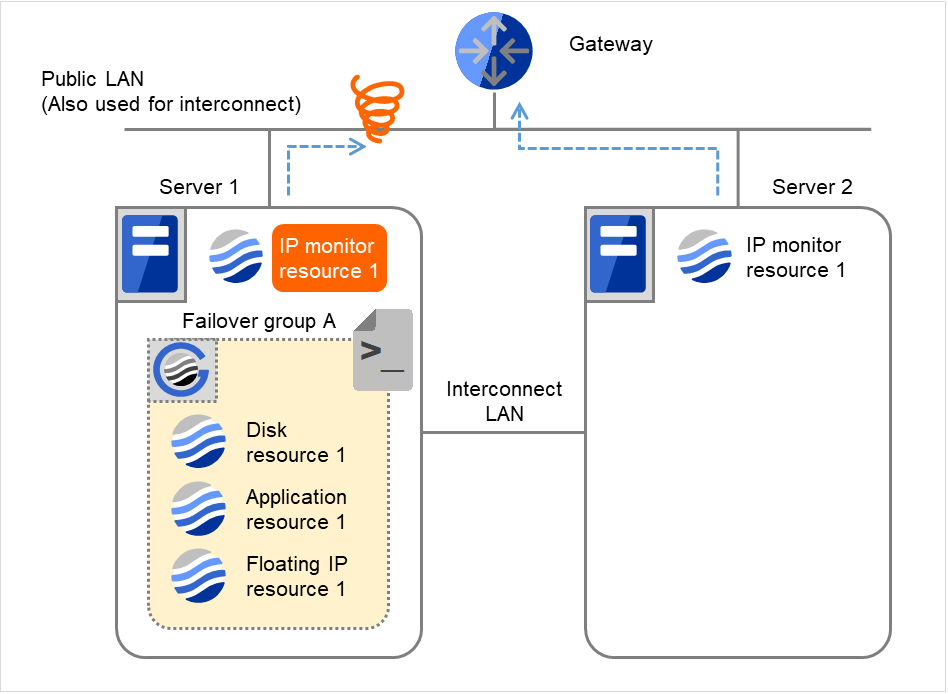
Fig. 4.10 Flow of error detection by the IP monitor resource: when only one server detects an error (4)
Server 1IP monitor resource 1Server 2IP monitor resource 1Recovery Script Execution Count
3
0
Reactivation Count
0
0
Failover Count
0
0
- On Server 1, if the specified Recovery Script Execution Count is exceeded, Failover group A starts to be reactivated.Reactivation Count represents how many times the reactivation is done on each server.This is the first reactivation on Server 1.
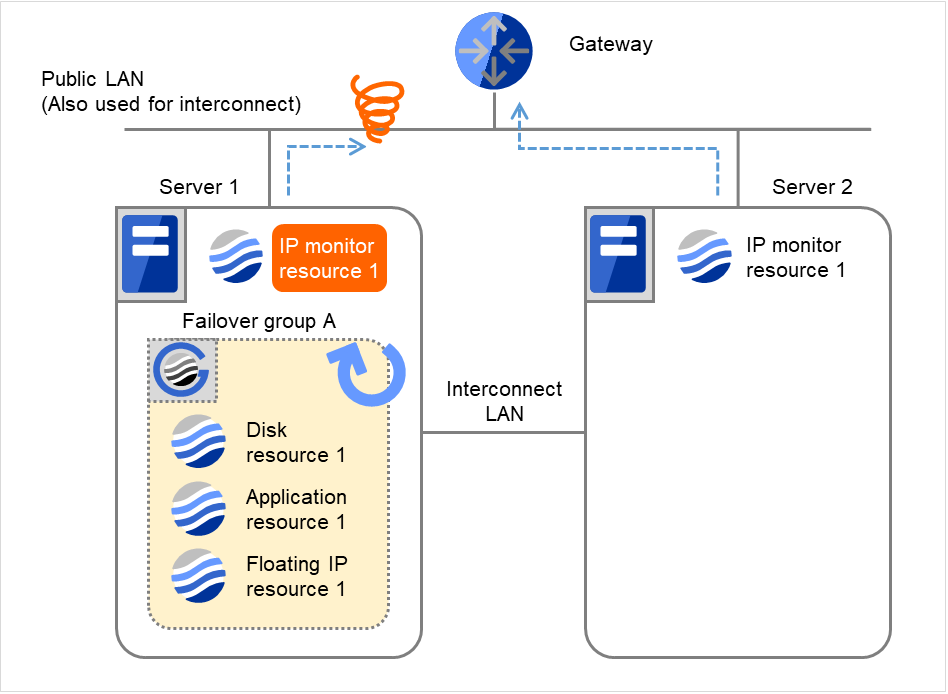
Fig. 4.11 Flow of error detection by the IP monitor resource: when only one server detects an error (5)
Server 1IP monitor resource 1Server 2IP monitor resource 1Recovery Script Execution Count
3
0
Reactivation Count
3
0
Failover Count
0
0
- On Server 1, if the specified threshold of reactivation is exceeded, Failover group A starts to be failed over.Failover Threshold represents how many times the failover is performed on each server.This is the first failover on Server 1.
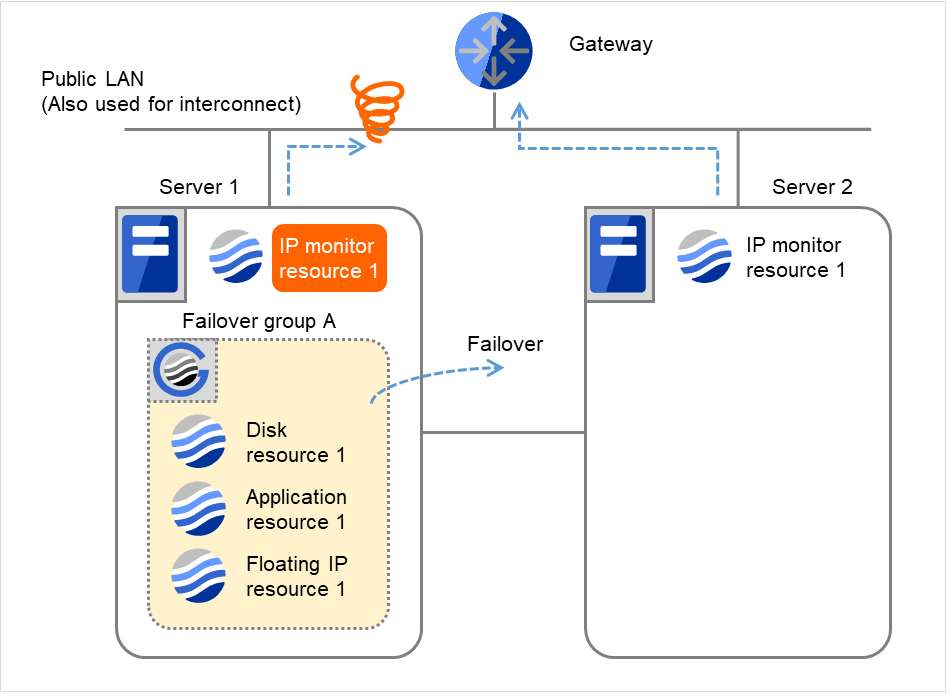
Fig. 4.12 Flow of error detection by the IP monitor resource: when only one server detects an error (6)
- Failover group A is failed over from Server 1 to Server 2.On Server 2, the failover of Failover group A is completed.
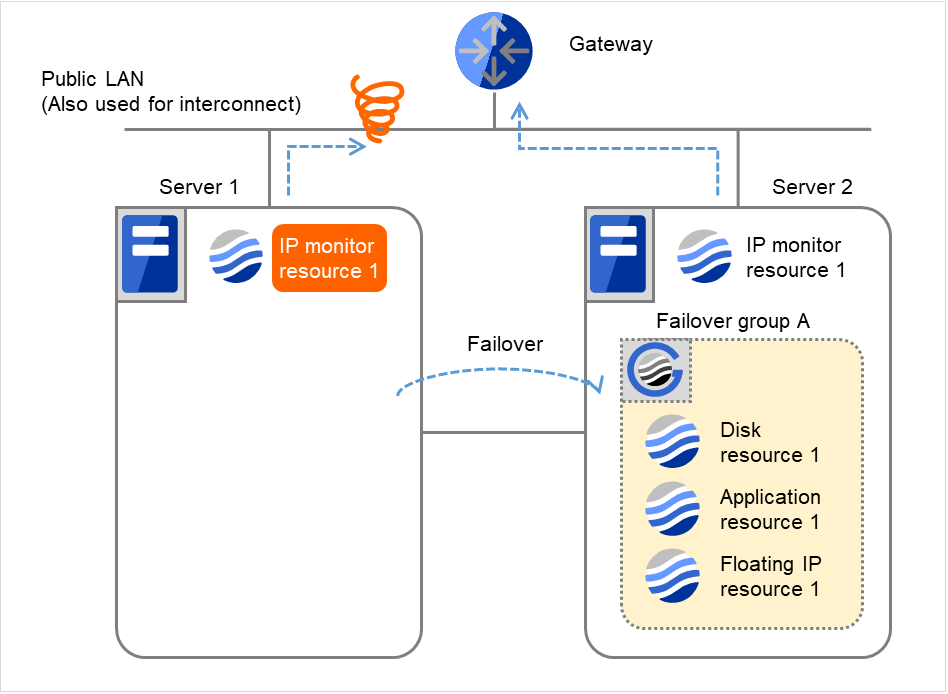
Fig. 4.13 Flow of error detection by the IP monitor resource: when only one server detects an error (7)
Server 1IP monitor resource 1Server 2IP monitor resource 1Recovery Script Execution Count
3
0
Reactivation Count
3
0
Failover Count
1
1
In server2, the operation can continue by failover of the Failover Group A because the IP monitor resource 1 is running properly.
The following is an example of the process when both servers detect an error while the gateway is specified as IP address of the IP monitor resource.
Examples of behavior when the following values are set.
- The following figure shows an example of monitoring by the IP monitor resource on two servers.To check for the aliveness, IP monitor resource 1 accesses the gateway's IP address at the intervals.

Fig. 4.14 Flow of error detection by the IP monitor resource: when both servers detect an error (1)
Server 1IP monitor resource 1Server 2IP monitor resource 1Recovery Script Execution Count
0
0
Reactivation Count
0
0
Failover Count
0
0
IP monitor resource 1 detects an error (such as a LAN cable disconnection and an NIC malfunction) on Servers 1 and 2.

Fig. 4.15 Flow of error detection by the IP monitor resource: when both servers detect an error (2)
IP monitor resource 1 retries the monitoring up to three times.

Fig. 4.16 Flow of error detection by the IP monitor resource: when both servers detect an error (3)
- If the specified monitor retry count is exceeded, the recovery script starts to be executed on Server 1.Recovery Script Execution Count means how many times the recovery script is executed on each server.This is the first execution of the recovery script on Server 1.The recovery is not made on Server 2, because the status of Failover group A is Already stopped.

Fig. 4.17 Flow of error detection by the IP monitor resource: when both servers detect an error (4)
Server 1IP monitor resource 1Server 2IP monitor resource 1Recovery Script Execution Count
3
0
Reactivation Count
0
0
Failover Count
0
0
- On Server 1, if the specified Recovery Script Execution Count is exceeded, Failover group A starts to be reactivated.Reactivation Count represents how many times the reactivation is done on each server.This is the first reactivation on Server 1.The recovery is not made on Server 2, because the status of Failover group A is Already stopped.
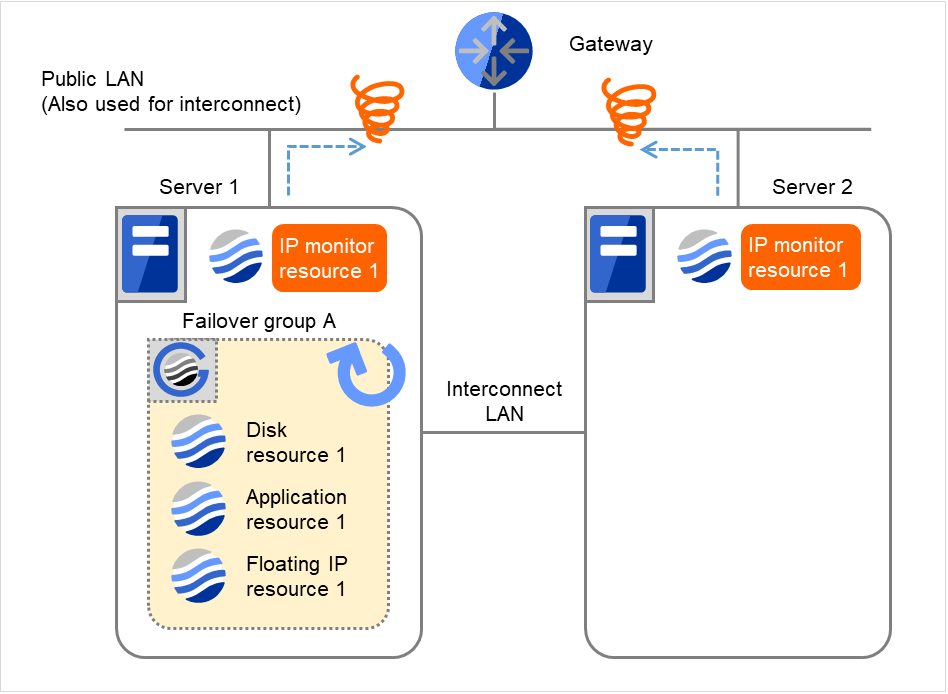
Fig. 4.18 Flow of error detection by the IP monitor resource: when both servers detect an error (5)
Server 1IP monitor resource 1Server 2IP monitor resource 1Recovery Script Execution Count
3
0
Reactivation Count
3
0
Failover Count
0
0
- On Server 1, if the specified threshold of reactivation is exceeded, Failover group A starts to be failed over.Failover Threshold represents how many times the failover is performed on each server.This is the first failover on Server 1.The recovery is not made on Server 2, because the status of Failover group A is Already stopped.

Fig. 4.19 Flow of error detection by the IP monitor resource: when both servers detect an error (6)
Server 1IP monitor resource 1Server 2IP monitor resource 1Recovery Script Execution Count
3
0
Reactivation Count
3
0
Failover Count
1
1
- Failover group A is failed over from Server 1 to Server 2.On Server 2, IP monitor resource 1 finds the error persisting.

Fig. 4.20 Flow of error detection by the IP monitor resource: when both servers detect an error (7)
Server 1IP monitor resource 1Server 2IP monitor resource 1Recovery Script Execution Count
3
0
Reactivation Count
3
0
Failover Count
1
1
IP monitor resource 1 retries the monitoring up to three times.
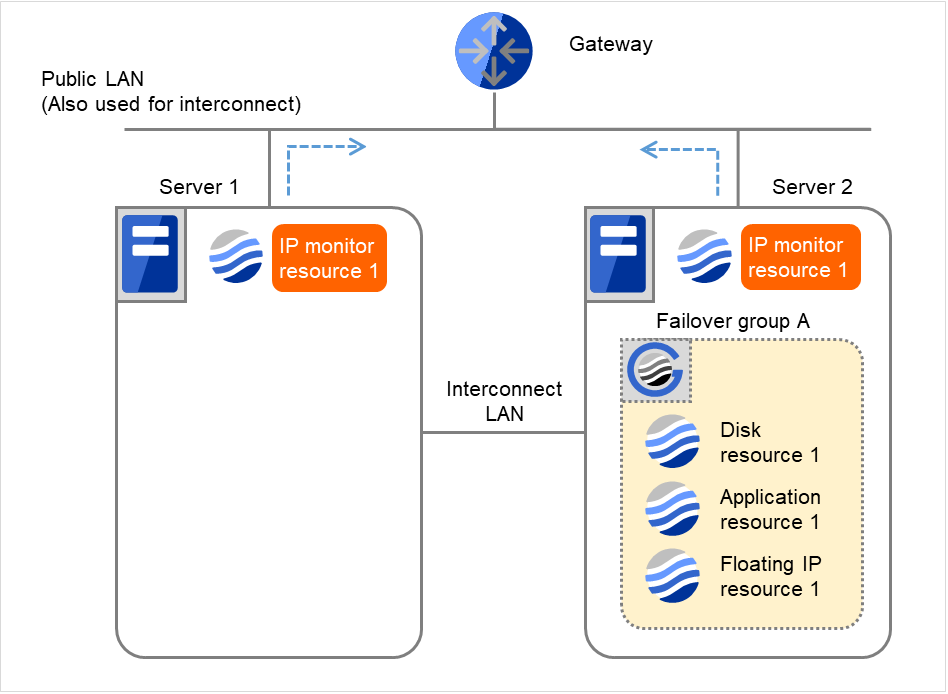
Fig. 4.21 Flow of error detection by the IP monitor resource: when both servers detect an error (8)
If the specified monitor retry count is exceeded by IP monitor resource 1 and the error persists, then executing the recovery script is retried up to three times.
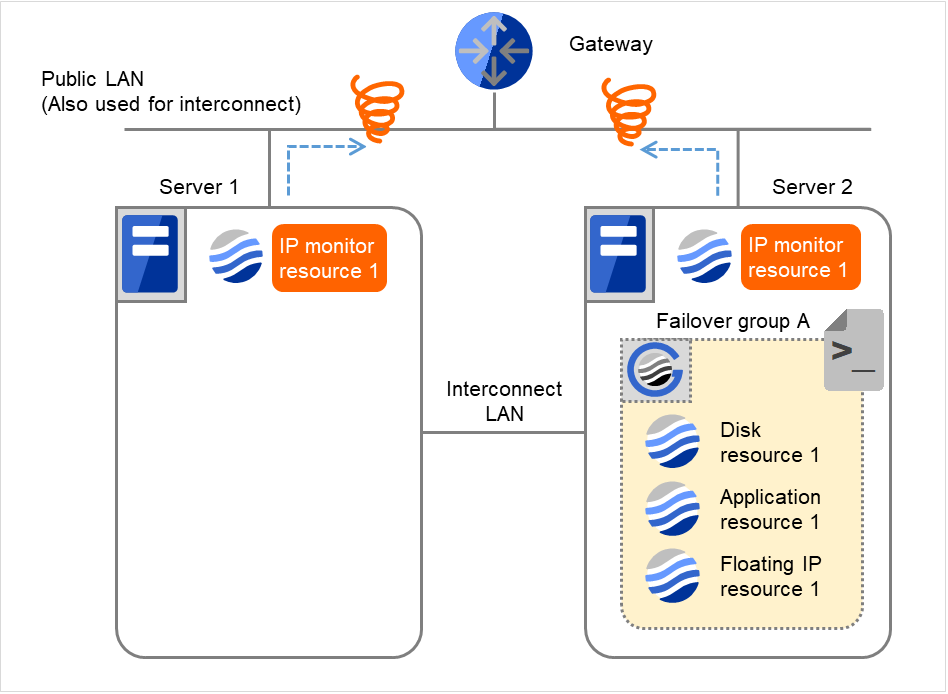
Fig. 4.22 Flow of error detection by the IP monitor resource: when both servers detect an error (9)
On Server 2, if the specified retry count is exceeded for the recovery script execution and the error persists, reactivating Failover group A is retried up to three times.
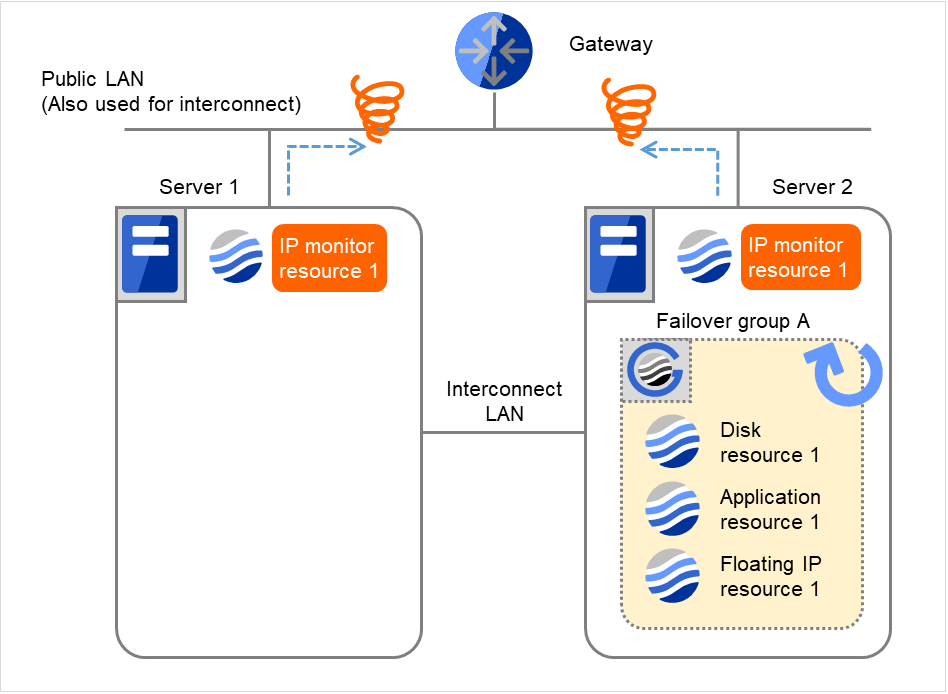
Fig. 4.23 Flow of error detection by the IP monitor resource: when both servers detect an error (10)
Recovery Script Execution Count
3
3
Reactivation Count
3
3
Failover Count
1
1
- On Server 2, if the specified reactivation retry count is exceeded, Failover group A starts to be failed over.This is the first failover on Server 2.
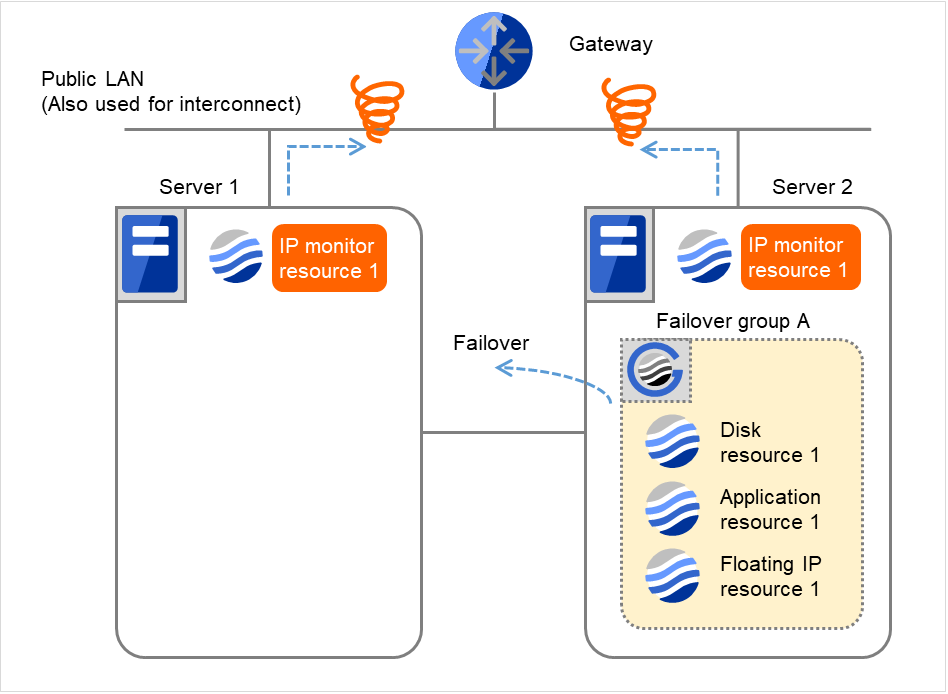
Fig. 4.24 Flow of error detection by the IP monitor resource: when both servers detect an error (11)
Recovery Script Execution Count
3
3
Reactivation Count
3
3
Failover Count
2
2
- Failover group A is failed over from Server 2 to Server 1.On Server 1, IP monitor resource 1 finds the error persisting.
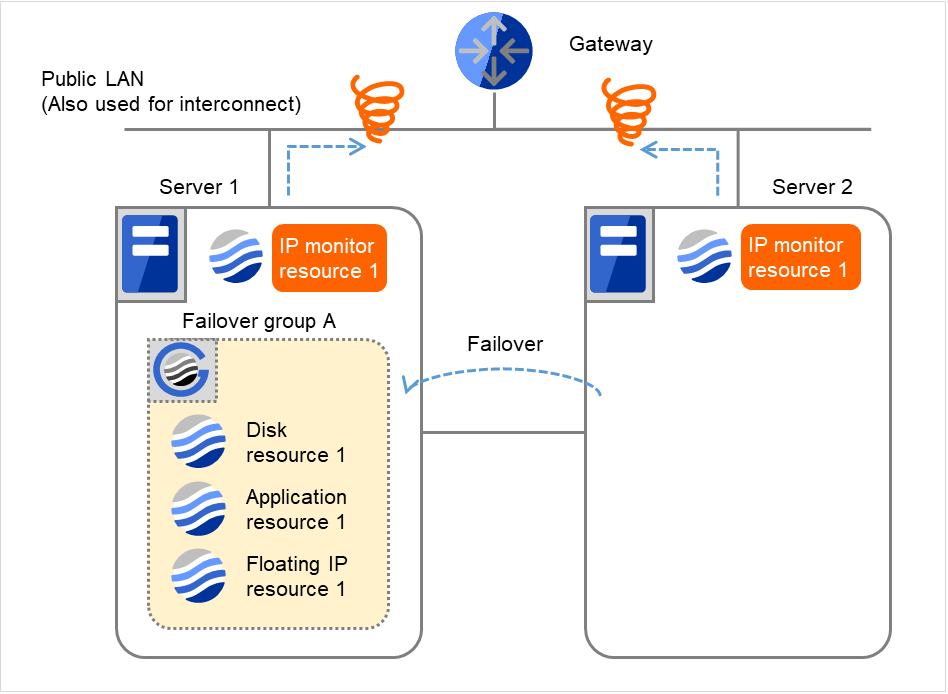
Fig. 4.25 Flow of error detection by the IP monitor resource: when both servers detect an error (12)
Recovery Script Execution Count
3
3
Reactivation Count
3
3
Failover Count
2
2
On Server 1, IP monitor resource 1 retries the monitoring up to three times.

Fig. 4.26 Flow of error detection by the IP monitor resource: when both servers detect an error (13)
- If the specified monitor retry count is exceeded by Disk monitor resource 1 on Server 1 again, the reactivation is not performed. This is because its threshold is 3.In addition, the specified Final Action is started. No failover is performed then, because Failover Threshold is set at 1.On Server 1, the final action of IP monitor resource 1 is started.Final Action means the action to be taken after the specified failover retry count is exceeded.
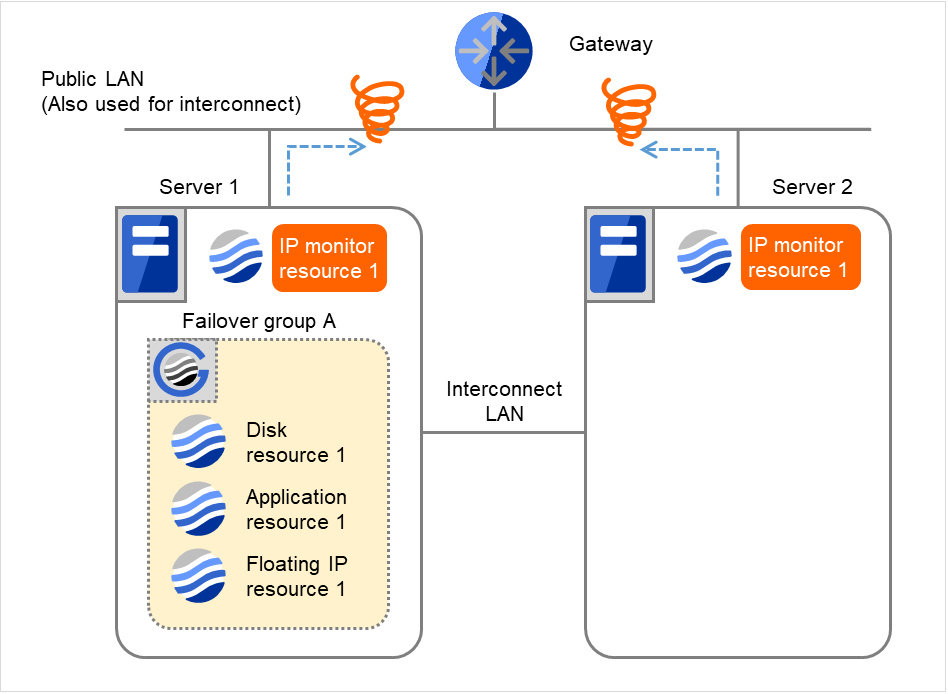
Fig. 4.27 Flow of error detection by the IP monitor resource: when both servers detect an error (14)
Additional Information
When the status of the monitor resource becomes normal from an error, the reactivation count and failover count are reset to zero (0).
4.1.5. Returning from monitor error (Normal)
When return of the monitor resource is detected during or after recovery actions following the detection of a monitoring error, counts for the following thresholds that the monitor resource keeps are reset. Note that when a group resource or failover group is specified as recovery target, these counters are reset only when the status of all the monitor resources in which the same recovery targets are specified become normal.
Reactivation Threshold
Failover Threshold
Whether or not to execute the final action is reset, (execution required).
The following pages describe what will be executed from the point when the final action as described in "Behavior when an error is detected by a monitor resource" is executed and another monitoring error occurs after monitoring returns to normal.
Examples of behavior when the following values are set.
Configuration
- The following figure shows an example of monitoring by the IP monitor resource on two servers.After all recovery actions are taken, a monitoring error persists.On Server 1, the final action of IP monitor resource 1 was taken.
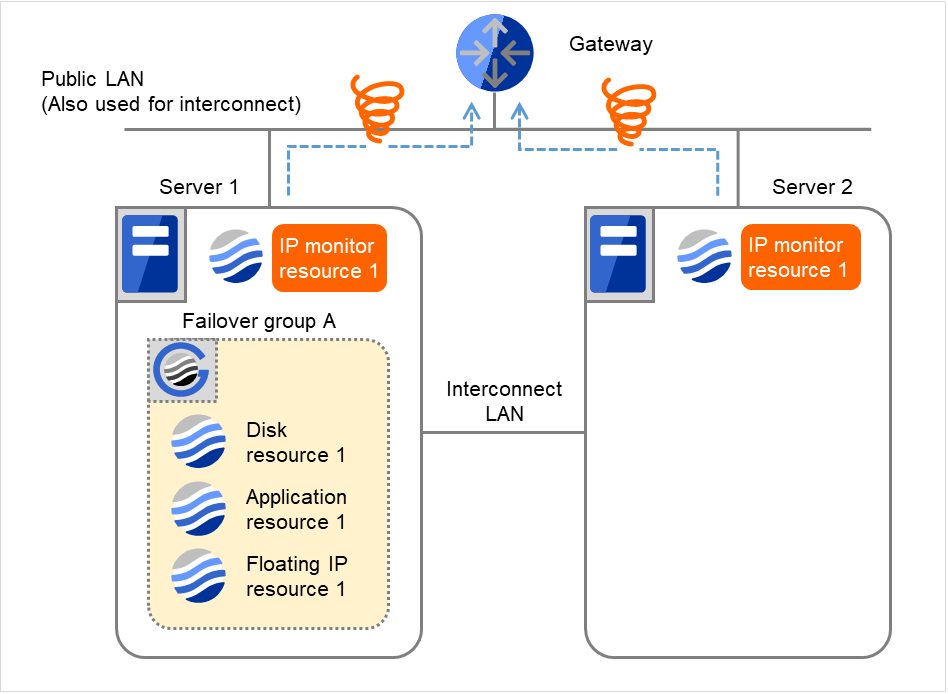
Fig. 4.28 Flow of error detection by the IP monitor resource: normally returning from a monitoring error (1)
Server 1IP monitor resource 1Server 2IP monitor resource 1Recovery Script Execution Count
3
3
Reactivation Count
3
3
Failover Count
2
2
When the gateway is restored, IP monitor resource 1 finds the situation normal.
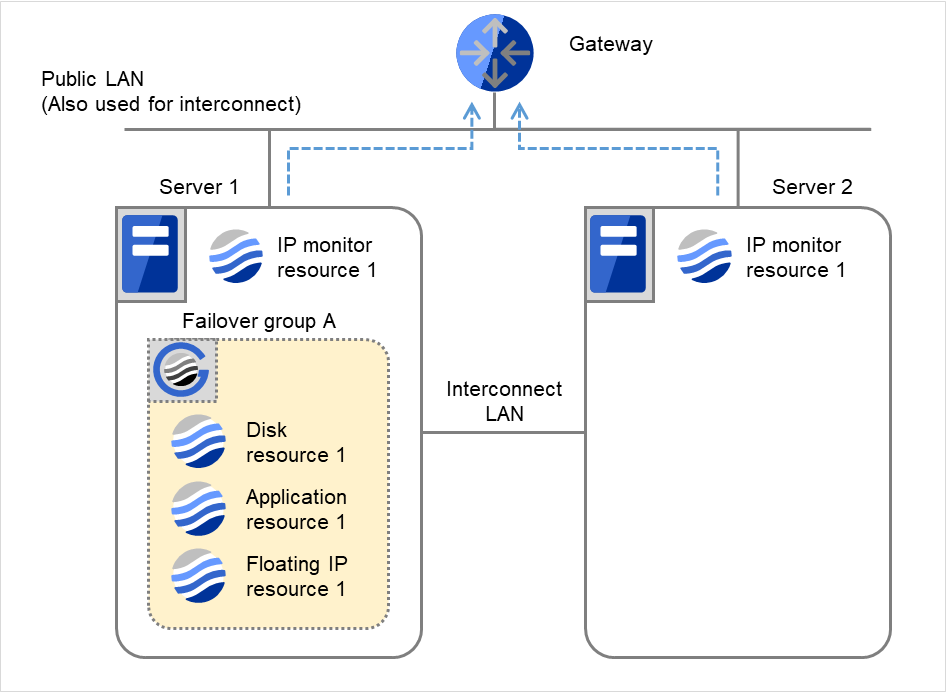
Fig. 4.29 Flow of error detection by the IP monitor resource: normally returning from a monitoring error (2)
Server 1IP monitor resource 1Server 2IP monitor resource 1Recovery Script Execution Count
0
0
Reactivation Count
0
0
Failover Count
0
0
The number of reactivations and failovers are reset because it has been detected that the status of the monitor target resource became normal.
IP monitor resource 1 has detected an error again.

Fig. 4.30 Flow of error detection by the IP monitor resource: normally returning from a monitoring error (3)
- IP monitor resource 1 retries the monitoring up to three times.Retry Count means that on this server.
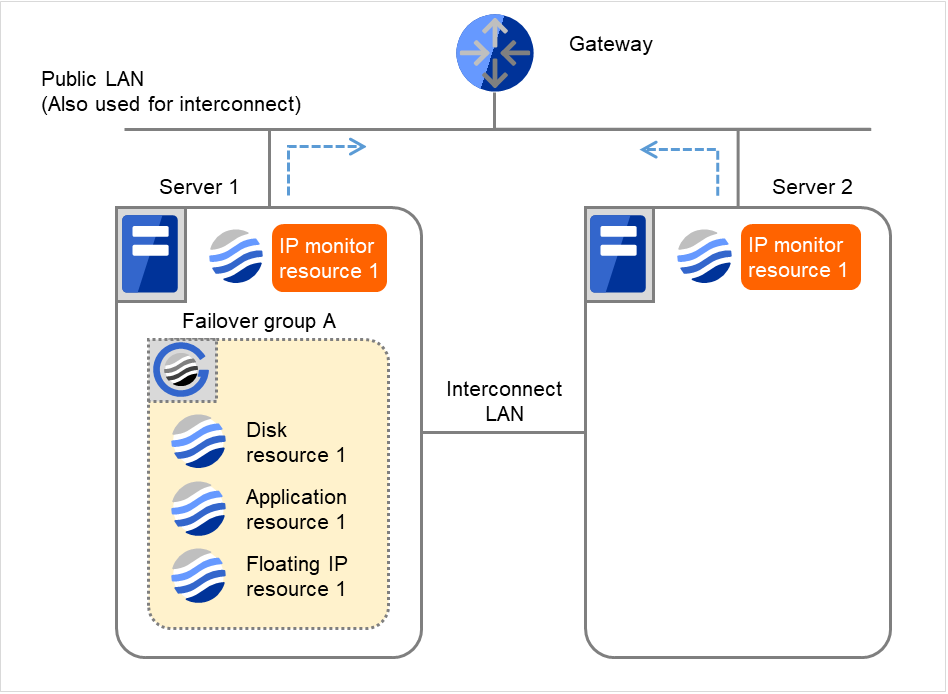
Fig. 4.31 Flow of error detection by the IP monitor resource: normally returning from a monitoring error (4)
Server 1IP monitor resource 1Recovery Script Execution Count
0
Reactivation Count
0
Failover Count
0
If the specified monitor retry count is exceeded, the recovery script starts to be executed on Server 1. Recovery Script Execution Count means how many times the recovery script is executed on each server. This is the first execution of the recovery script on Server 1. The recovery is not made on Server 2, because the status of Failover group A is Already stopped.
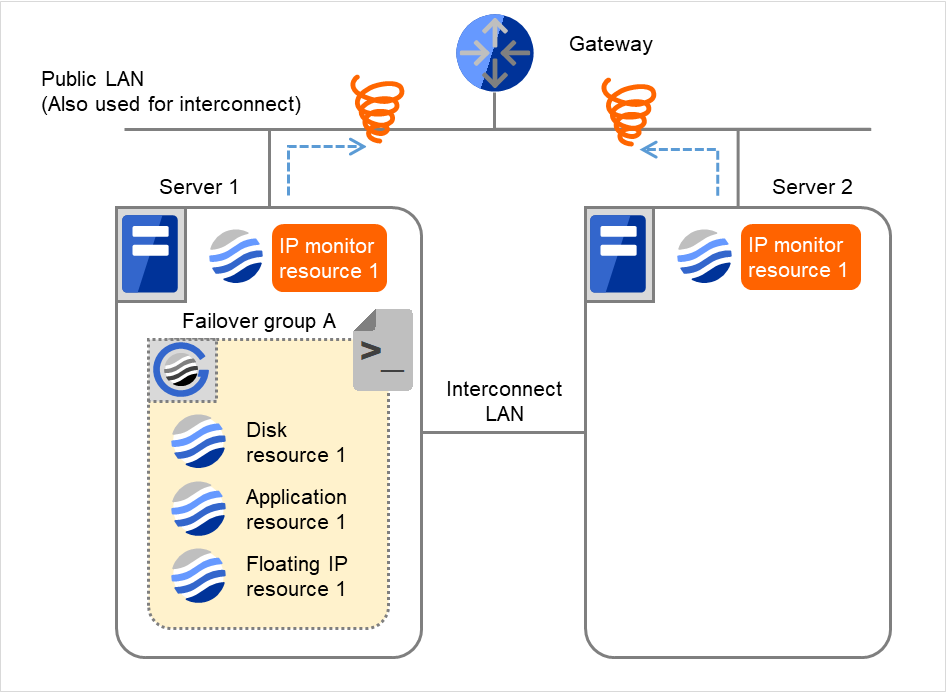
Fig. 4.32 Flow of error detection by the IP monitor resource: normally returning from a monitoring error (5)
Server 1IP monitor resource 1Server 2IP monitor resource 1Recovery Script Execution Count
3
0
Reactivation Count
0
0
Failover Count
0
0
- On Server 1, if the specified Recovery Script Execution Count is exceeded, Failover group A starts to be reactivated.Reactivation Count represents how many times the reactivation is done on each server.This is the first reactivation on Server 1.Reactivation is executed again because it has been detected that the status of the monitor target resource became normal and reactivation count has been reset before.
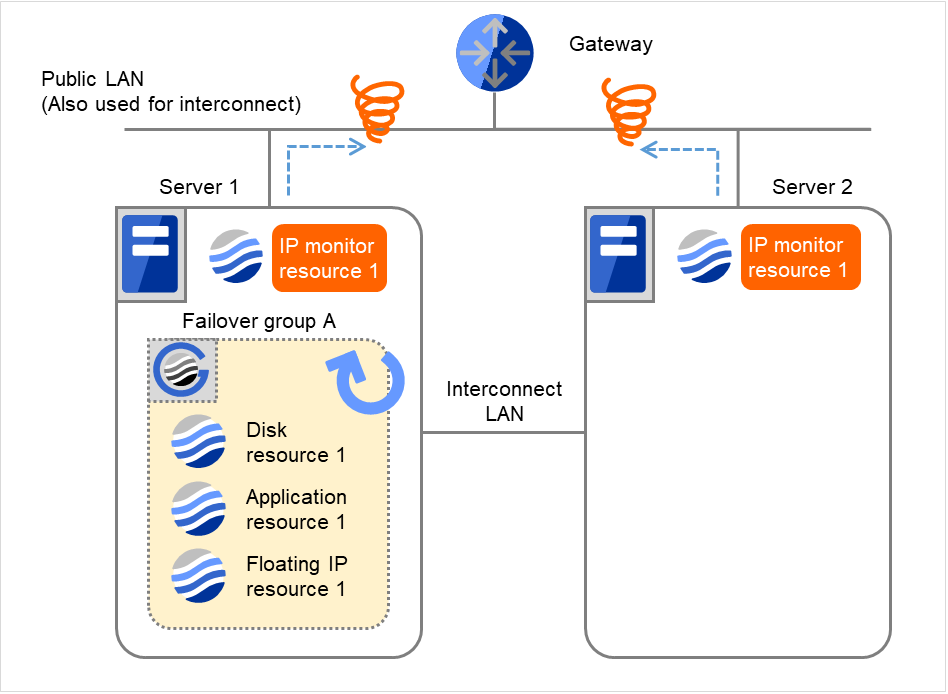
Fig. 4.33 Flow of error detection by the IP monitor resource: normally returning from a monitoring error (6)
Server 1IP monitor resource 1Server 2IP monitor resource 1Recovery Script Execution Count
3
0
Reactivation Count
3
0
Failover Count
0
0
4.1.6. Activation and deactivation error of recovery target when executing recovery operation
When the monitoring target of the monitor resource is the device used for the group resource of the recovery target, an activation/deactivation error of the group resource may be detected during recovery when a monitoring error is detected.
The following is an example of the recovery progress when the same device is specified as the monitor target of the TUR monitor resource and the disk resource of the Failover Group A:
Configuration of the TUR monitor resource
Configuration of the failover group A: disk resource
The following figure shows an example of monitoring by the disk TUR monitor resource on two servers. On Servers 1 and 2, Disk TUR monitor resource 1 and Failover group A start to be activated. At the intervals, ioctl TUR is executed on the device.
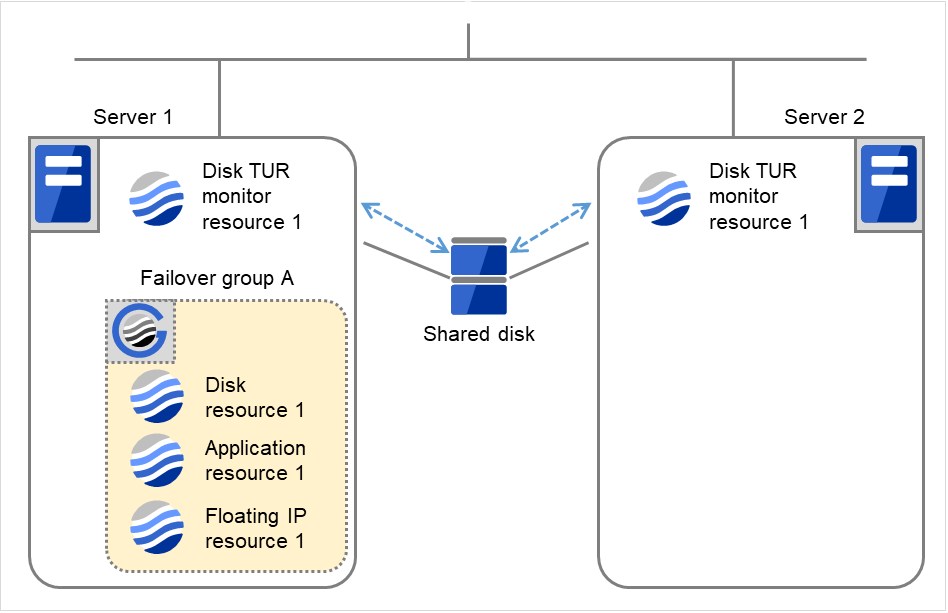
Fig. 4.34 Flow of error detection by the disk TUR monitor resource (1)
Server 1
Server 2
Disk TUR monitor resource 1Failover Count0
0
Disk resource 1Failover Count0
0
- On Servers 1 and 2, Disk TUR monitor resource 1 detects an error: failure in TUR ioctl.Depending on the error location of the disk device, the error may be detected during the deactivation of the disk resource.

Fig. 4.35 Flow of error detection by the disk TUR monitor resource (2)
- Due to the error detected by Disk TUR monitor resource 1 on Server 1, Failover group A starts to be failed over.The failover threshold of the monitor resource means how many times the failover is performed on each server.This is the first failover on Server 1.

Fig. 4.36 Flow of error detection by the disk TUR monitor resource (3)
Server 1
Server 2
Disk TUR monitor resource 1Failover Count1
1
Disk resource 1Failover Count0
0
On Server 2, due to the failover, activating Disk resource 1 fails.
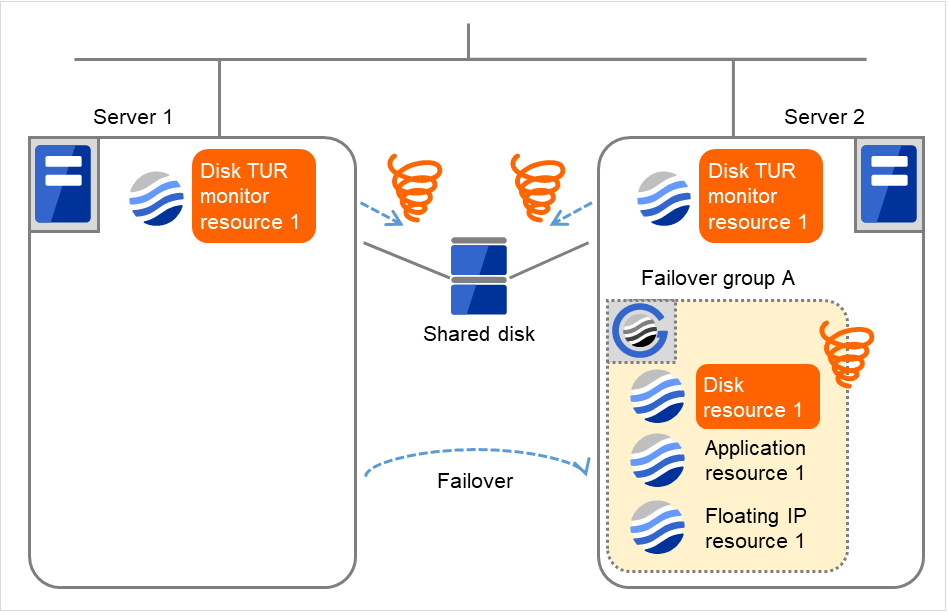
Fig. 4.37 Flow of error detection by the disk TUR monitor resource (4)
- Due to the activation failure of Disk resource 1 on Server 2, Failover group A starts to be failed over.The failover threshold of the group resource means how many times the failover is performed on each server.This is the first failover on Server 2.Depending on the error location of the disk device, the error may be detected during the deactivation of the disk resource.

Fig. 4.38 Flow of error detection by the disk TUR monitor resource (5)
Server 1
Server 2
Disk TUR monitor resource 1Failover Count1
1
Disk resource 1Failover Count1
1
The TUR monitor resource 1 detects an error in server2 as is the case in server1. However, no recovery action is taken because the failover group A, the recovery target, is activated.
For more information on recovery executed by monitor resources against their recovery targets, see " Behavior when an error is detected by a monitor resource "
- On Server 1, due to the failover, activating Disk resource 1 fails.Depending on the error location of the disk device, the error may be detected during the deactivation of the disk resource.

Fig. 4.39 Flow of error detection by the disk TUR monitor resource (6)
Server 1
Server 2
Disk TUR monitor resource 1Failover Count1
1
Disk resource 1Failover Count1
1
- Due to the activation failure of Disk resource 1 on Server 1, Failover group A starts to be failed over.This is the first failover on Server 1.
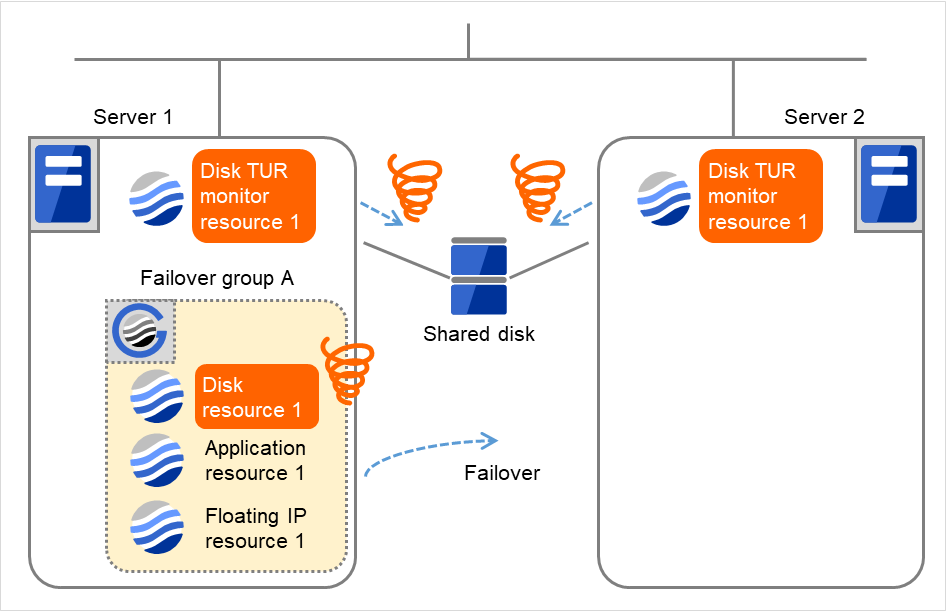
Fig. 4.40 Flow of error detection by the disk TUR monitor resource (7)
Server 1
Server 2
Disk TUR monitor resource 1Failover Count1
1
Disk resource 1Failover Count2
2
- On Server 2, due to the failover, activating Disk resource 1 fails.Depending on the error location of the disk device, the error may be detected during the deactivation of the disk resource.

Fig. 4.41 Flow of error detection by the disk TUR monitor resource (8)
The final action is executed in server2 because the number of failovers due to failure of disk resource activation has exceeded its threshold.
However, note that activation ends abnormally without activating the rest of the group resources in the Failover Group A because "No operation (Next resources are not activated)" is selected as the final action.
- Due to the activation failure of Disk resource 1 on Server 2, the final action has been taken.An activation failure occurs in Failover group A.Depending on the error location of the disk device, the error may be detected during the deactivation of the disk resource.
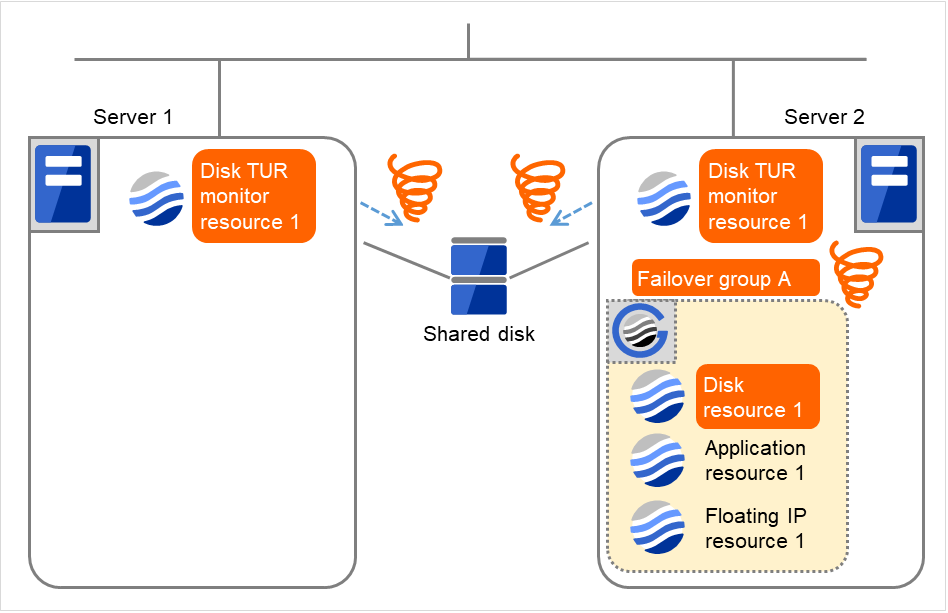
Fig. 4.42 Flow of error detection by the disk TUR monitor resource (9)
- Due to the error detected by Disk TUR monitor resource 1 on Server 2, Failover group A starts to be failed over.This is the first failover on Server 2.
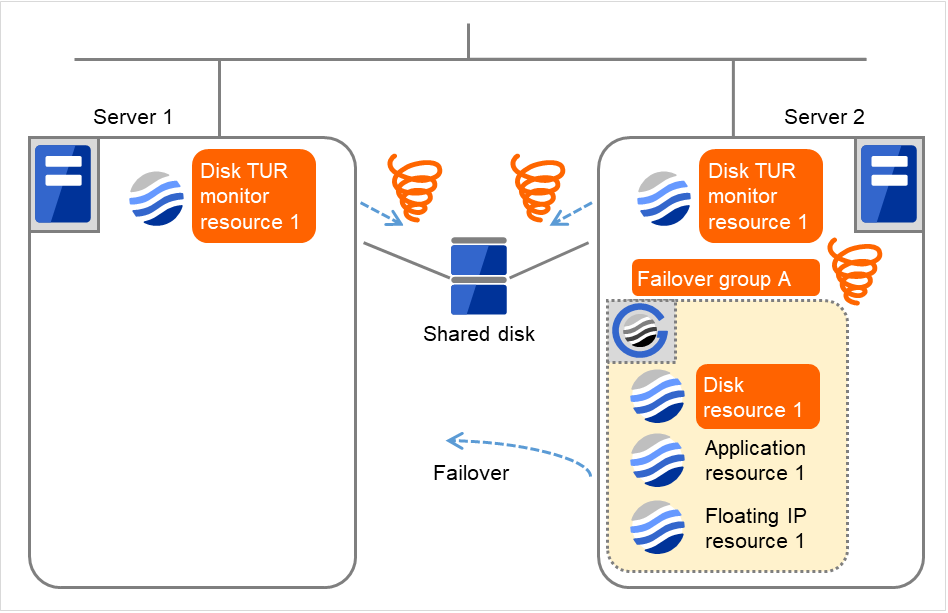
Fig. 4.43 Flow of error detection by the disk TUR monitor resource (10)
Server 1
Server 2
2
2
2
2
On Server 1, due to the failover, activating Disk resource 1 fails.
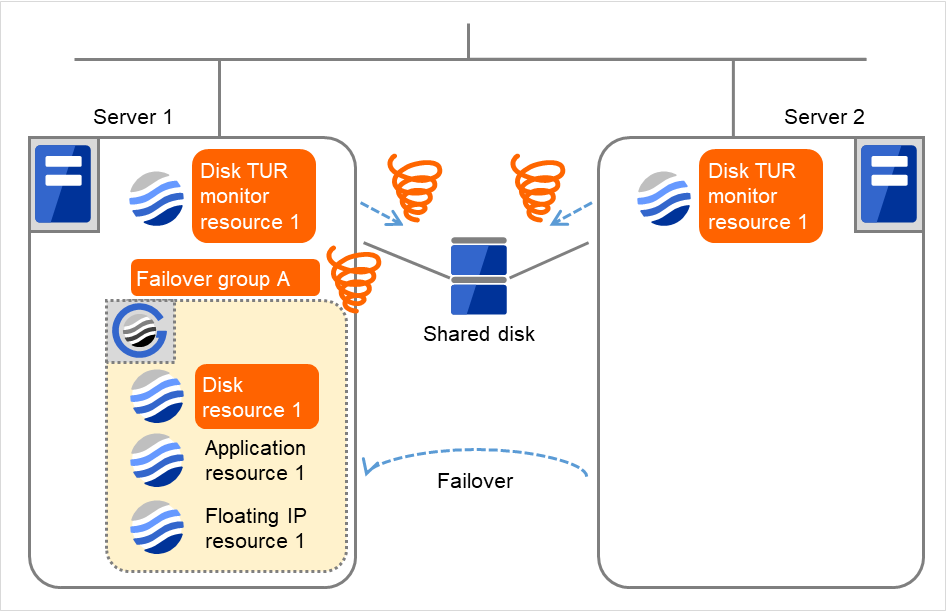
Fig. 4.44 Flow of error detection by the disk TUR monitor resource (11)
The final action is executed in server1 as is the case in server2 because the number of failovers due to failure of activating the disk resource 1 has exceeded the threshold.
However, note that activation ends abnormally without activating the rest of the group resources in the Failover Group A because "No operation (Next resources are not activated)" is selected as the final action.
An error can be detected in deactivation of the disk resource depending on the location of the disk device failure.
Due to the error detected by Disk TUR monitor resource 1 on Server 1, the final action (Stop Failover Group) starts to be taken for Failover group A.
The final action is executed in server1 because the number of failovers due to monitoring error detected by the disk TUR monitor resource 1 has exceeded the threshold.
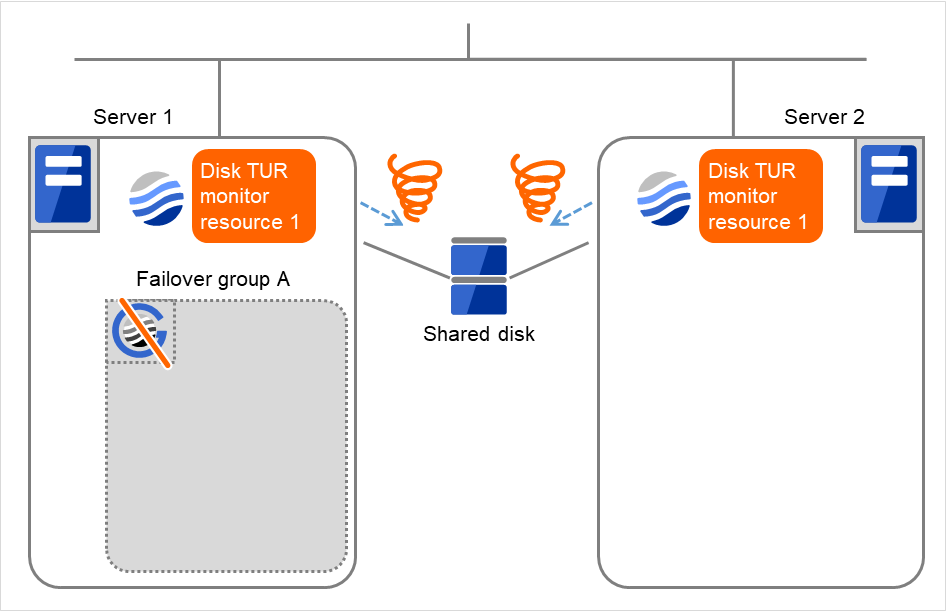
Fig. 4.45 Flow of error detection by the disk TUR monitor resource (12)
After the Failover Group A is stopped due to the final action executed for the disk TUR monitor resource 1 in server1, nothing will happen even if an error is detected by the disk TUR monitor resource 1.
However, note that the final action for the disk TUR monitor resource 1 is executed in server2 if the Failover Group A is manually activated because the final action for the disk monitor TUR resource 1 is not executed yet.
4.1.7. Recovery/pre-recovery action script
Upon the detection of a monitor resource error, a recovery script can be configured to run. Alternatively, before the reactivation, failover, or final action of a recovery target, a pre-recovery action script can be configured to run.
The script is a common file.
Environment variables used in the recovery/pre-recovery action script
EXPRESSCLUSTER sets status information (the recovery action type) in the environment variables upon the execution of the script.
The script allows you to specify the following environment variables as branch conditions according to the operation of the system.
Environment variable |
Value of the environment variable |
Description |
|---|---|---|
CLP_MONITORNAME
...Monitor resource name
|
Monitor resource name |
Name of the monitor resource in which an error that causes the recovery/pre-recovery action script to run is detected. |
CLP_VERSION_FULL
...EXPRESSCLUSTER full version
|
EXPRESSCLUSTER full version |
Represents the EXPRESSCLUSTER full version.
Example: 13.12
|
CLP_VERSION_MAJOR
...EXPRESSCLUSTER major version
|
EXPRESSCLUSTER major version |
Represents the EXPRESSCLUSTER major version.
Example: 13
|
CLP_PATH
...EXPRESSCLUSTER installation path
|
EXPRESSCLUSTER installation path |
Represents the path where EXPRESSCLUSTER is installed.
Example:
C:\Program Files\EXPRESSCLUSTER |
CLP_OSNAME
...Server OS name
|
Server OS name |
Represents the OS name of the server where the script was executed.
Example: Windows Server 2016 Standard
|
CLP_OSVER
...Server OS version
|
Server OS version |
Represents the OS version of the server where the script was executed.
Example: 10.0.14393
|
CLP_ACTION
...Recovery action type
|
RECOVERY |
Execution as a recovery script. |
RESTART |
Execution before reactivation. |
|
FAILOVER |
Execution before failover. |
|
FINALACTION |
Execution before final action. |
|
CLP_RECOVERYCOUNT
...Recovery script execution count
|
Recovery Script Execution Count |
Count for recovery script execution. |
CLP_RESTARTCOUNT
...Reactivation count
|
Reactivation count |
Count for reactivation. |
CLP_FAILOVERCOUNT
...Failover count
|
Failover count |
Count for failover. |
Writing recovery/pre-recovery action scripts
This section explains the environment variables mentioned above, using a practical scripting example.
Example of a recovery/pre-recovery action script
rem ******************************************************
rem *                    preaction.bat                   *
rem ******************************************************

echo START

IF "%CLP_ACTION%"=="" GOTO NO_CLP

IF "%CLP_ACTION%"=="RECOVERY" GOTO RECOVERY
IF "%CLP_ACTION%"=="RESTART" GOTO RESTART
IF "%CLP_ACTION%"=="FAILOVER" GOTO FAILOVER
IF "%CLP_ACTION%"=="FINALACTION" GOTO FINALACTION


:RECOVERY
echo RECOVERY COUNT: %CLP_RECOVERYCOUNT%

rem Here, write a recovery process.
rem This process is to be performed at the timing of the following:
rem
rem  Recovery action: recovery script

GOTO EXIT


:RESTART
echo RESTART COUNT: %CLP_RESTARTCOUNT%

rem Here, write a pre-reactivation process.
rem This process is to be performed at the timing of the following:
rem
rem  Recovery action: reactivation

GOTO EXIT


:FAILOVER
echo FAILOVER COUNT: %CLP_FAILOVERCOUNT%

rem Here, write a recovery process.
rem This process is to be performed at the timing of the following:
rem
rem  Recovery action: failover

GOTO EXIT


:FINALACTION
echo FINALACTION

rem Here, write a recovery process.
rem This process is to be performed at the timing of the following:
rem
rem  Recovery action: final action

:NO_CLP

:EXIT
echo EXIT
exit
Tips for recovery/pre-recovery action script coding
Pay careful attention to the following points when coding the script.
When the script contains a command that requires a long time to run, log the end of execution of that command. The logged information can be used to identify the nature of the error if a problem occurs. clplogcmd is used to log the information.
Note on the recovery/pre-recovery action script
- Condition that a script before final action is executedA script before final action is executed before the final action upon detection of a group resource activation or deactivation failure. Even if No operation (Next Resources Are Activated/Deactivated) or No operation (Next Resources Are Not Activated/Deactivated) is set as the final action, a script before final action is executed.If the final action is not executed because the maximum restart count has reached the upper limit or by the function to suppress the final action when all other servers are being stopped, a script before final action is not executed.
4.1.8. Delay warning of monitor resources
When a server is heavily loaded, due to a reason such as applications running concurrently, a monitor resource may detect a monitoring timeout. It is possible to have settings to issue an alert at the time when the time for monitor processing (the actual elapsed time) reaches a certain percentages of the monitoring time before a timeout is detected.
The following figure shows timeline until a delay warning of the monitor resource is used.
In this example, the monitoring timeout is set to 60 seconds and the delay warning rate is set to 80%, which is the default value.
The following figure shows a case with the monitoring timeout set at 60 seconds and the delay warning rate set at 80% (48 seconds). The arrows indicate monitor polling times.
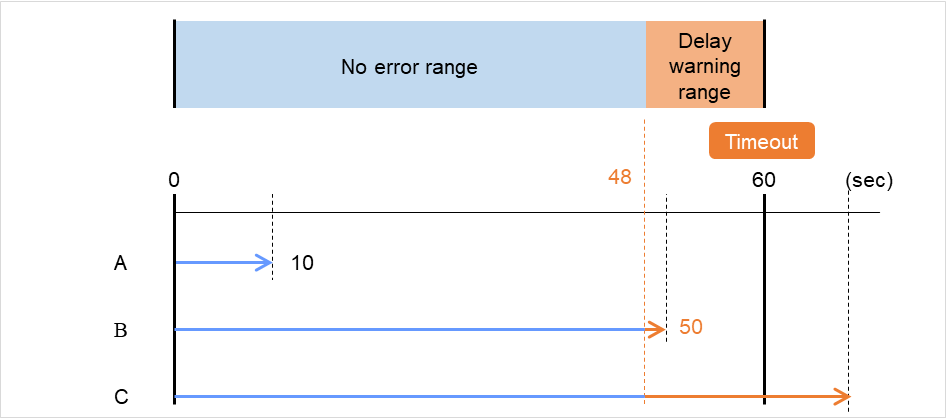
Fig. 4.46 Monitor polling times and a delay warning
- The time for monitor processing is 10 seconds. The monitor resource is in normal status.In this case, no alert is used.
- The time for monitor processing is 50 seconds and the delay of monitoring is detected during this time. The monitor resource is in the normal status.In this case, an alert is used because the delay warning rate has exceeded 80%.
- The time for monitor processing has exceeded 60 seconds of the monitoring timeout and the delay of monitoring is detected. The monitor resource has a problem.In this case, no alert is used.
Alert for the delay warning is used for the heartbeat resources as well.
See also
To configure the delay warning of monitor resources, click Cluster Properties, click Delay Warning, and select Monitor Delay Warning. For details, refer to "2. Parameter details" in this guide.
4.1.9. Waiting for monitor resource to start monitoring
"Wait Time to Start Monitoring" refers to start monitoring after the time period specified as the waiting time elapses.
The following describes how monitoring differs when the wait time to start monitoring is set to 0 second and 30 seconds.
If the wait time to start monitoring is set at 0 seconds, the monitor resource polling is started after a cluster startup or a monitor resumption.
Configuration of monitor resource
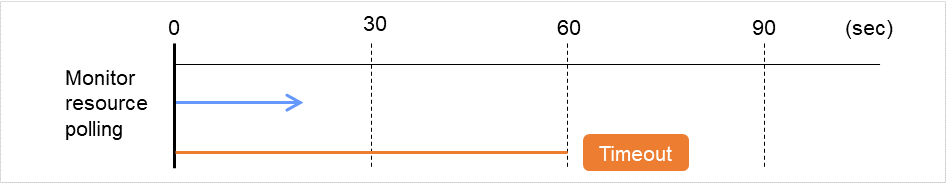
Fig. 4.47 Waiting for monitor resource to start monitoring (with its time set at 0 seconds)
If the wait time to start monitoring is set at 30 seconds, the monitor resource polling is started 30 seconds after a cluster startup or a monitor resumption.
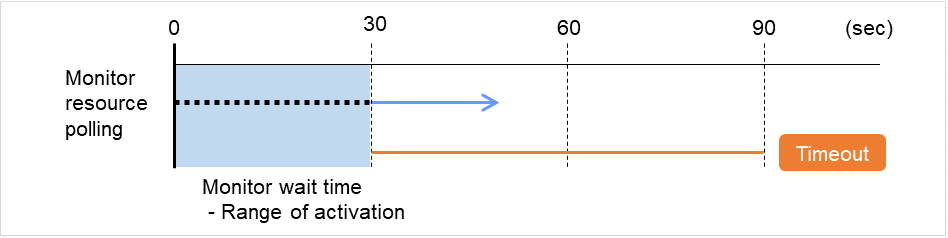
Fig. 4.48 Waiting for monitor resource to start monitoring (with its time set at 30 seconds)
Note
The wait time to start monitoring is used when there is a possibility for monitoring to be terminated right after the start of monitoring due to incorrect application settings, such as the application resource monitored by application monitor resource, and when they cannot be recovered by reactivation.
For example, when the monitor wait time is set to 0 (zero), recovery may be endlessly repeated. See the example below:
In this case, the application is first started. Next, the application monitor resource starts monitoring, then ends its polling. After that, however, the application abends for some reason.
Configuration of application monitor resource
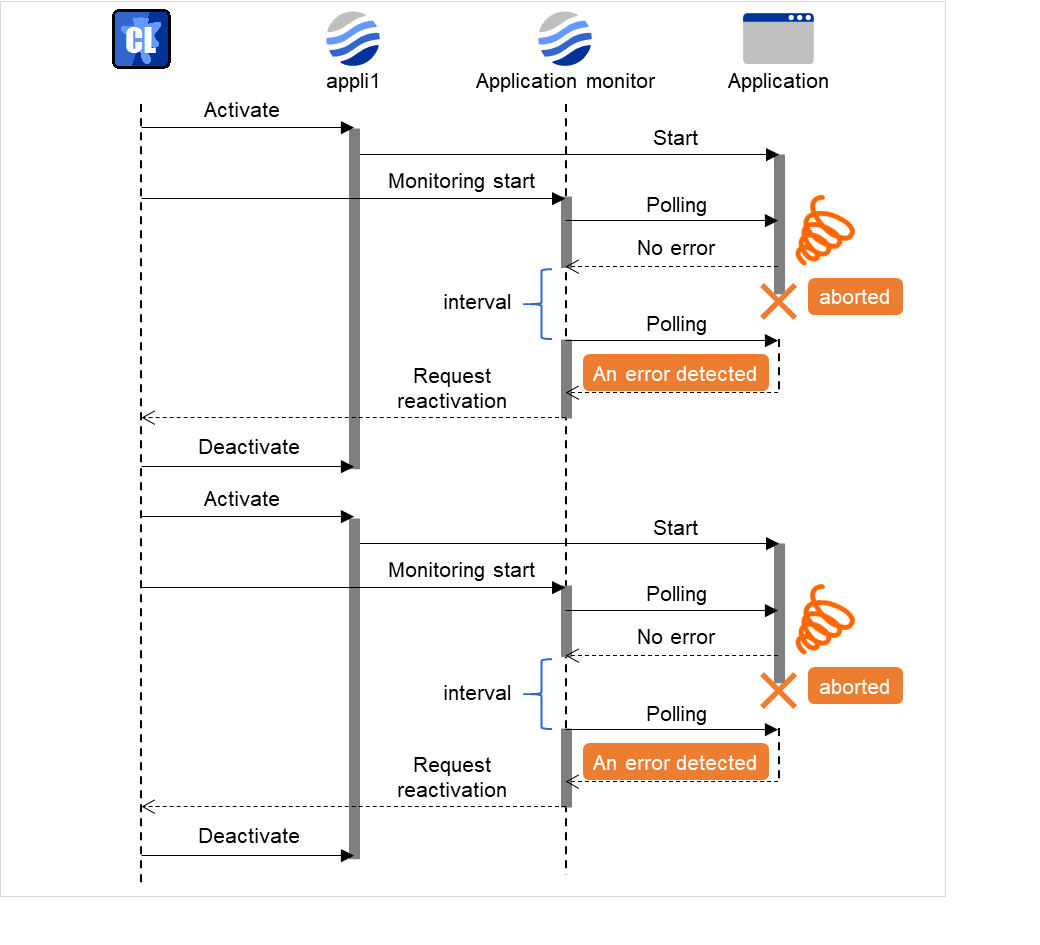
Fig. 4.49 Waiting for monitor resource to start monitoring (with its time set at 0 seconds)
The reason why recovery action is endlessly repeated is because the initial monitor resource polling has terminated successfully. The current count of recoveries the monitor resource has executed is reset when the status of the monitor resource becomes normal (finds no error in the monitor target). Because of this, the current count is always reset to 0 and reactivation for recovery is endlessly repeated.
You can prevent this problem by setting the wait time to start monitoring. By default, 60 seconds is set as the wait time from the application startup to the end.
In this case, the application is first started. Next, through the specified wait time to start monitoring, the application monitor resource starts monitoring. After that, the application abends for some reason. However, the abend is detected with the first round of polling by the application monitor resource.
Configuration of application monitor resource
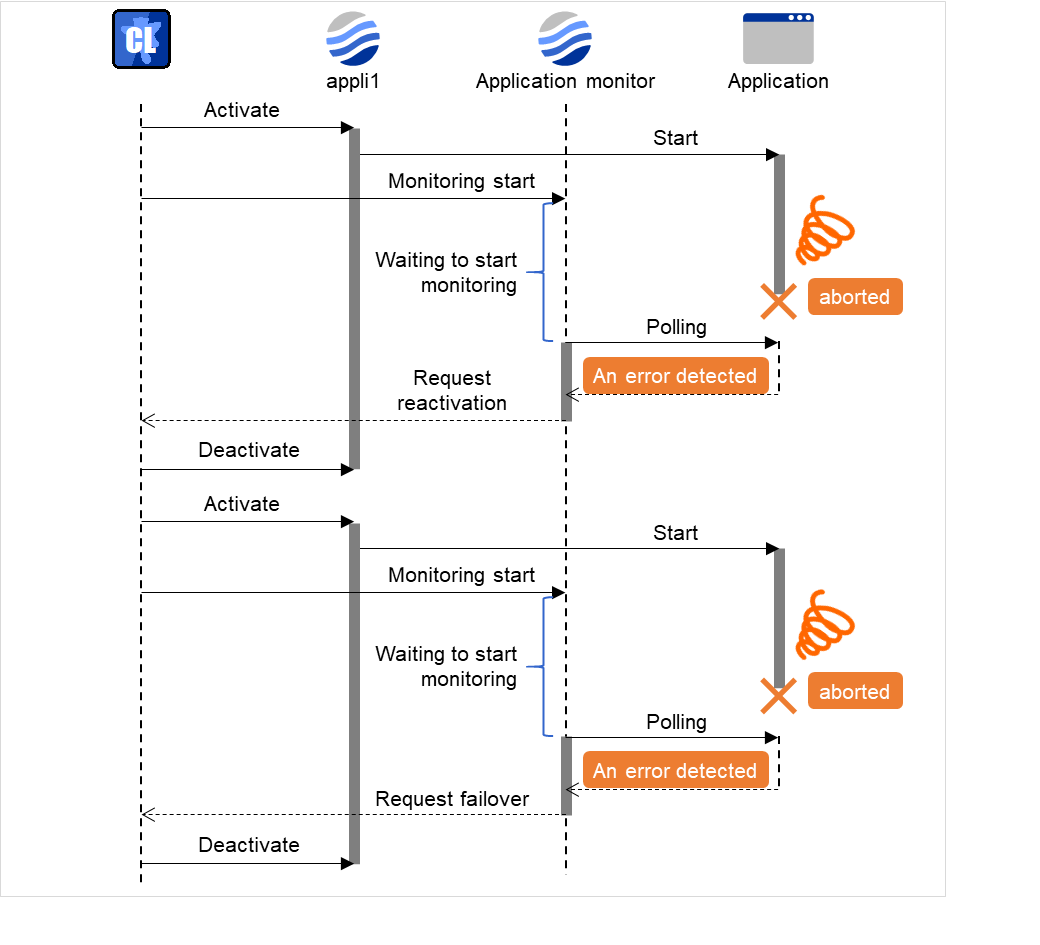
Fig. 4.50 Waiting for monitor resource to start monitoring (with its time set at 60 seconds)
If the application is abnormally terminated in the destination server of the group failover, the group stops as the final action.
4.1.10. Limiting the number of reboots when an error is detected by the monitor resource
When Stop cluster service and shutdown OS or Stop cluster service daemon and reboot OS is selected as a final action to be taken when an error is detected by the monitor resource, the number of shutdowns or reboots can be limited.
Note
The following is an example of the process when the number of reboots is limited.
As a final action, Stop cluster service and reboot OS is executed once because the maximum reboot count is set to one.
When the monitor resource finds no error in its target for 10 minutes after reboot following cluster shutdown, the number of reboots is reset because the time to reset the maximum reboot count is set to 10 minutes.
Configuration example
The following figure shows an example of monitoring by the disk TUR monitor resource on two servers. Disk TUR monitor resource 1 starts to be activated. At the intervals, an I/O process or other processes are executed on the device.

Fig. 4.51 Limiting the number of reboots (1)
Server 1
Server 2
Maximum reboot count
1
1
Reboot count
0
0
Disk TUR monitor resource 1 detects an error (e.g. that of ioctl or read).

Fig. 4.52 Limiting the number of reboots (2)
Stop the cluster service, and then reboot the OS. Since both Retry Count at Activation Failure and Failover Threshold are set at zero (0), the final action is taken. The number of reboots is recorded as 1. Then Failover group A starts to be failed over. Maximum reboot count represents the upper limit of how many times the startup is done on each server. On Server 2, the number of reboots is zero (0).
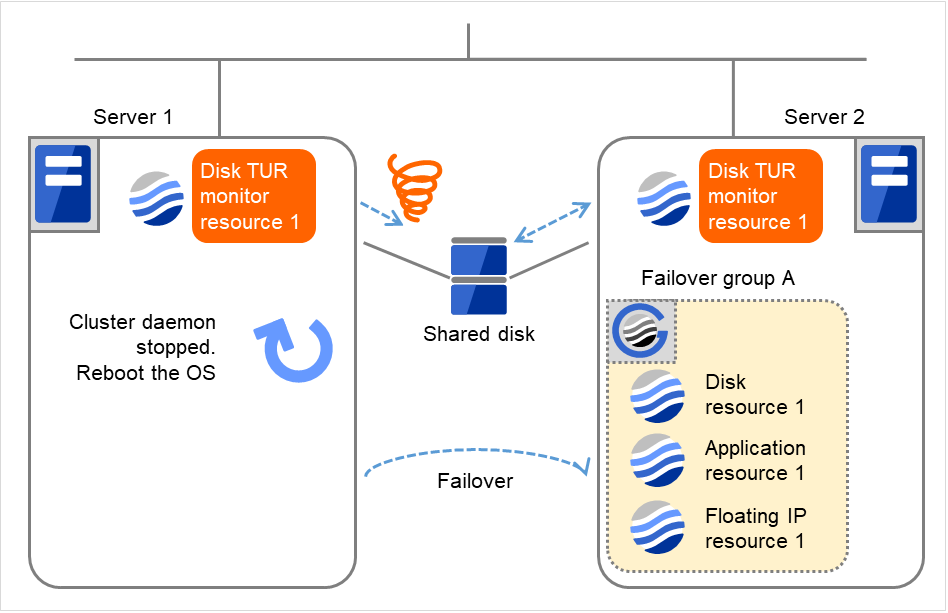
Fig. 4.53 Limiting the number of reboots (3)
Server 1
Server 2
Maximum reboot count
1
1
Reboot count
1
0
Server 1 completes the reboot. Move Failover group A to Server 1 by using the clpgrp command or Cluster WebUI.
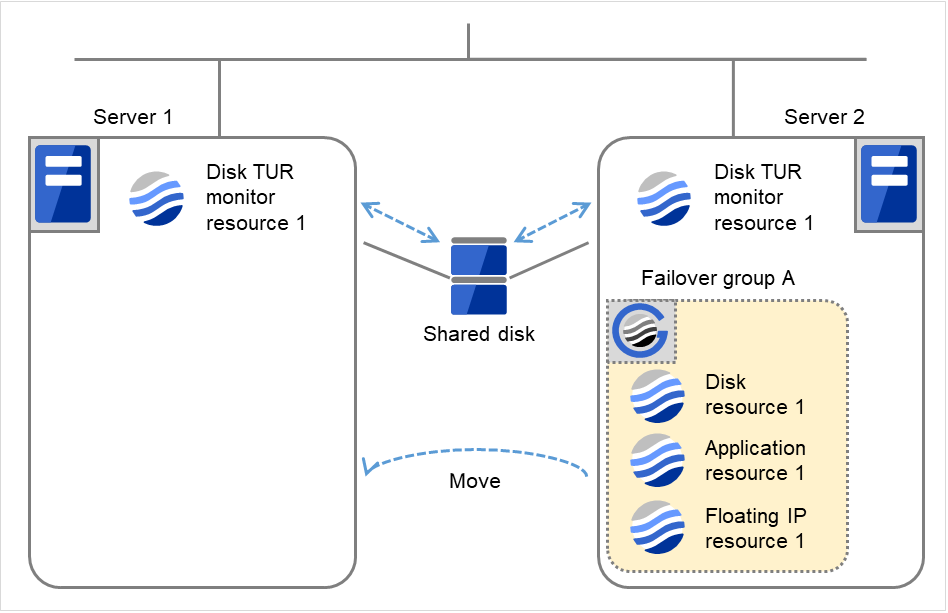
Fig. 4.54 Limiting the number of reboots (4)
Server 1
Server 2
Maximum reboot count
1
1
Reboot count
1
0
Disk TUR monitor resource 1 detects an error (e.g. that of ioctl or read). The final action is not taken on Server 1, because the reboot count has reached its maximum. Even after 10 minutes pass, the reboot count is not reset.
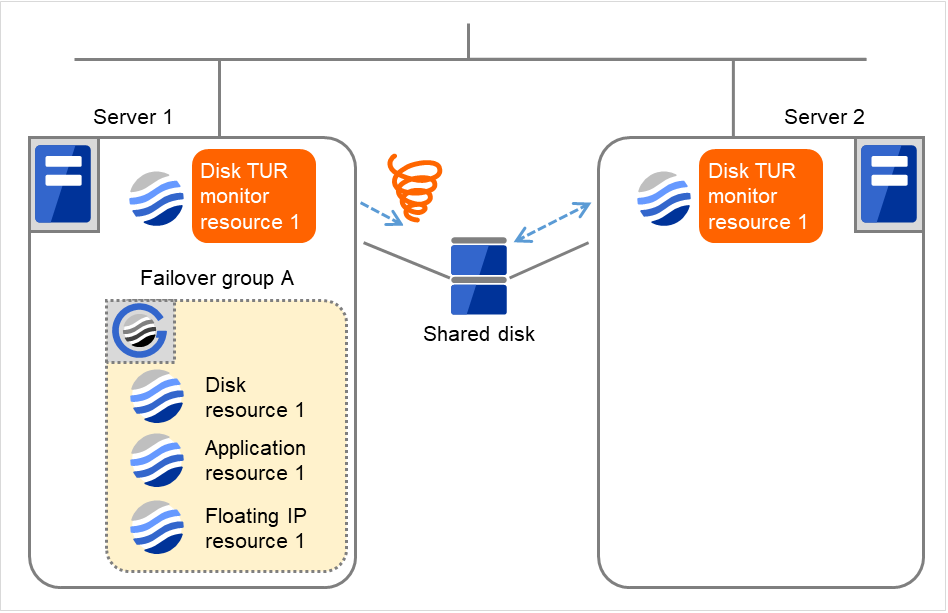
Fig. 4.55 Limiting the number of reboots (5)
Server 1
Server 2
Maximum reboot count
1
1
Reboot count
1
0
Remove the error from the shared disk, shut down the cluster by using the clpstdn command or Cluster WebUI, and then start the reboot.
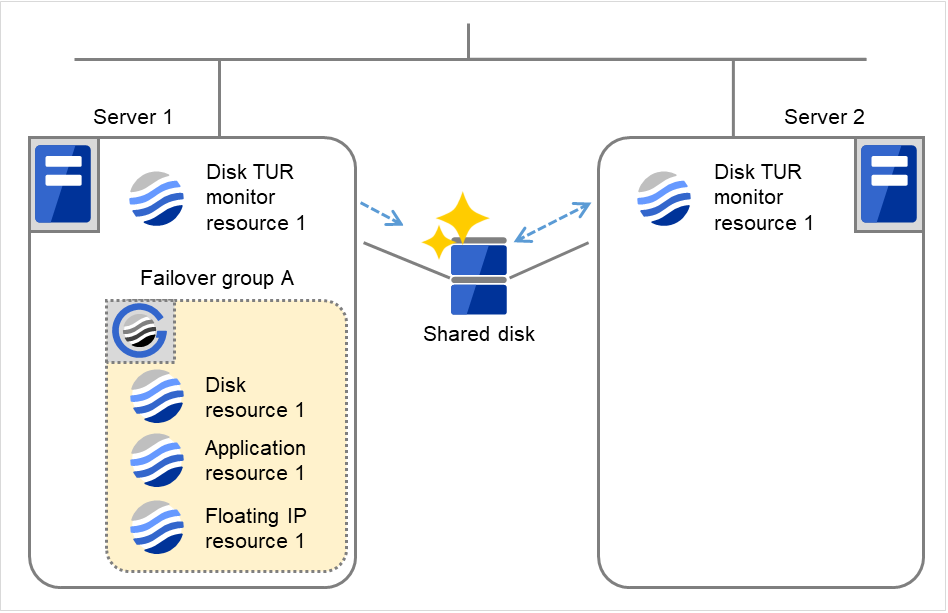
Fig. 4.56 Limiting the number of reboots (6)
Server 1
Server 2
Maximum reboot count
1
1
Reboot count
1
0
On Server 1, Disk TUR monitor resource 1 returns to normal. After 10 minutes pass, the reboot count is reset. Next time Disk TUR monitor resource 1 detects an error, the final action is taken.
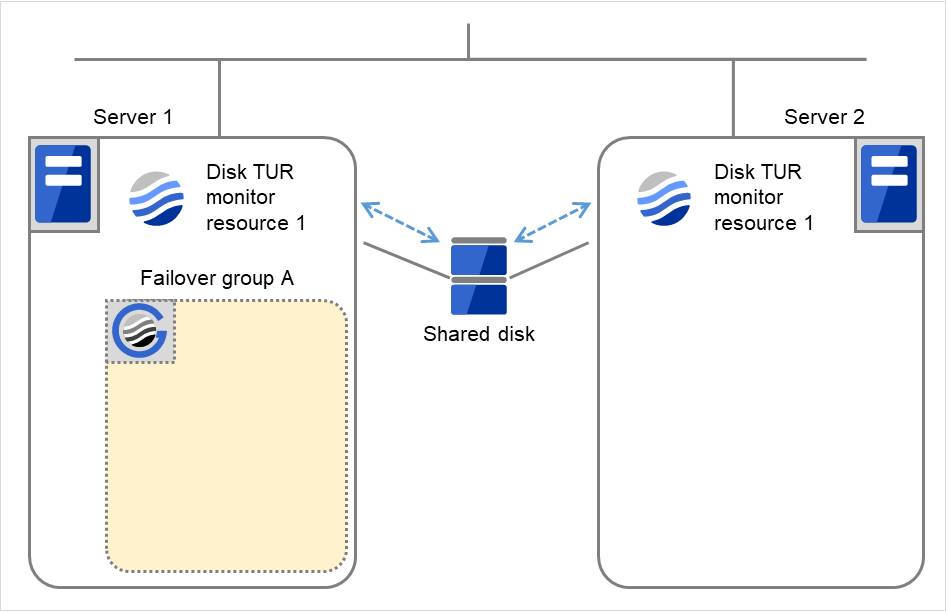
Fig. 4.57 Limiting the number of reboots (7)
Server 1
Server 2
Maximum reboot count
1
1
Reboot count
0
0
4.1.11. Monitor resources that require a license
Monitor resources listed below require a license because they are optional products. To use these monitor resources, obtain and register a product license.
Optional product name |
Monitor resource name |
|---|---|
EXPRESSCLUSTER X Database Agent 5.1 for Windows |
DB2 monitor resources |
ODBC monitor resources |
|
Oracle monitor resources |
|
PostgreSQL monitor resources |
|
SQL Server monitor resources |
|
EXPRESSCLUSTER X Internet Server Agent 5.1 for Windows |
FTP monitor resources |
HTTP monitor resources |
|
IMAP4 monitor resources |
|
POP3 monitor resources |
|
SMTP monitor resources |
|
EXPRESSCLUSTER X Application Server Agent 5.1 for Windows |
Tuxedo monitor resources |
WebSphere monitor resources |
|
WebLogic monitor resources |
|
WebOTX monitor resources |
|
EXPRESSCLUSTER X Java Resource Agent 5.1 for Windows |
JVM monitor resources |
EXPRESSCLUSTER X System Resource Agent 5.1 for Windows |
System monitor resources |
Process resource monitor resources |
For information on how to register a license, refer to " Registering the license" in the "Installation and Configuration Guide".
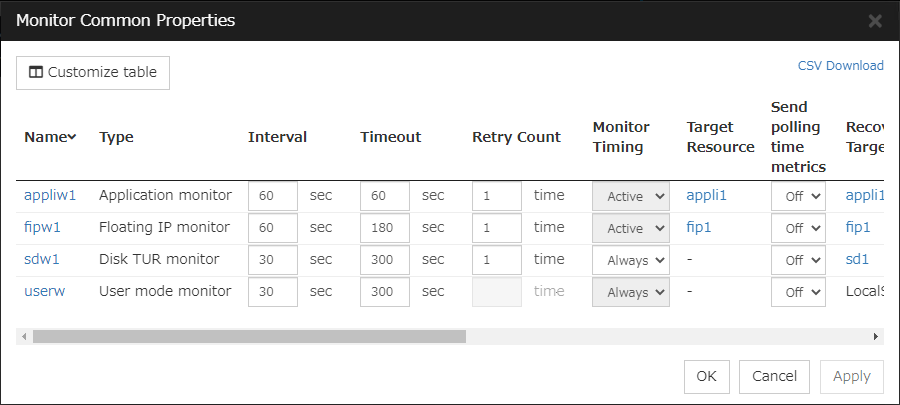
4.2. Monitor Common Properties
4.3. Monitor resource properties
4.3.1. Info tab
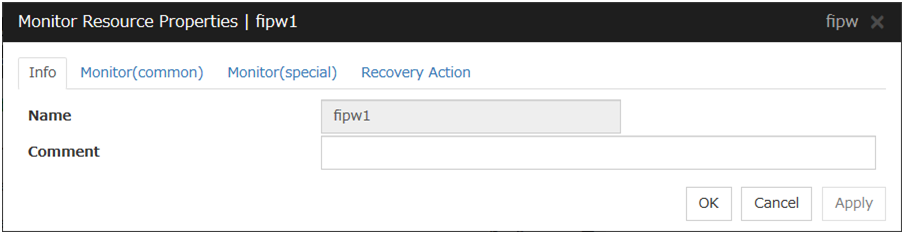
Name
The monitor resource name is displayed.
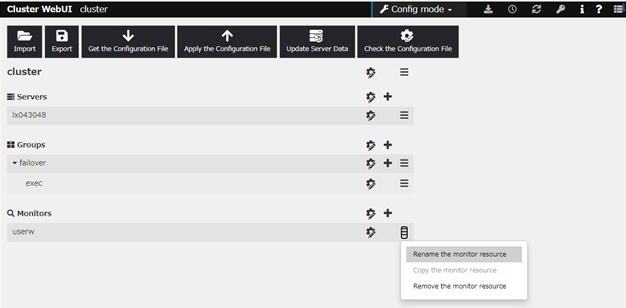
Changing the monitor resource name
click others, and then select Rename the monitor resource.
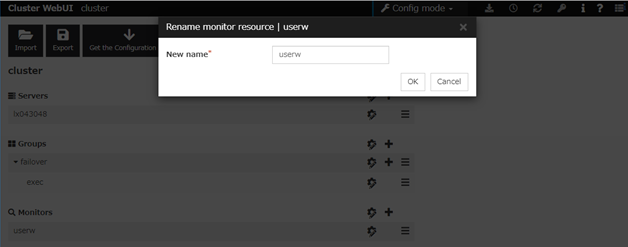
A dialog box to rename monitor resource is displayed.
Naming rules
Only alphanumeric characters, hyphen (-), underscore (_) and space are allowed for names.
Up to 31 characters (31 bytes)
Names cannot start or end with a hyphen (-) or space.
Comment (Within 127 bytes)
Enter a comment for the monitor resource. Use only one-byte alphabets and numbers.
4.3.2. Monitor (common) tab
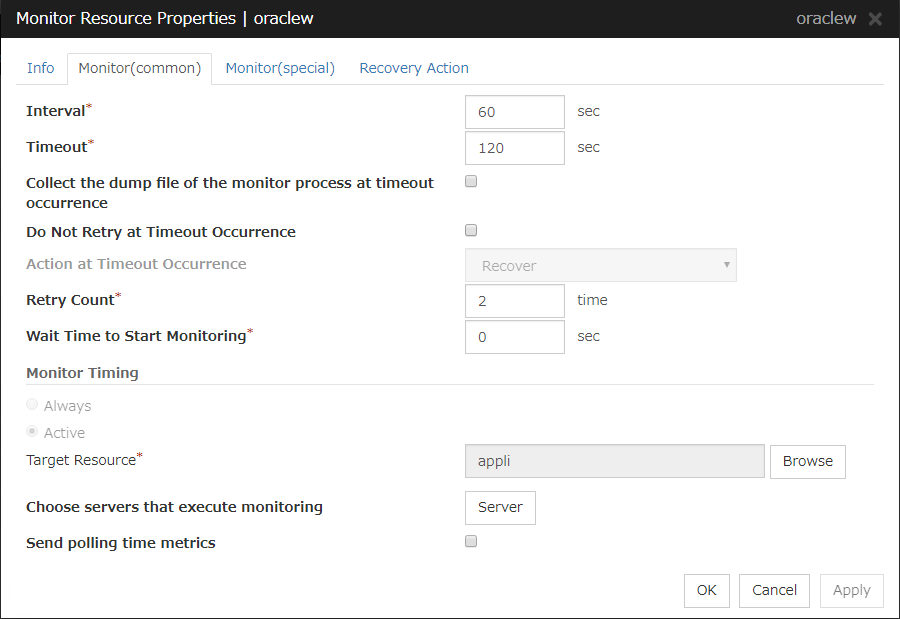
Interval (1 to 999)
Specify the interval to check the status of monitor target.
Timeout (5 to 999)
When the normal status cannot be detected within the time specified here, the status is determined to be error.
Note
It is not recommended to change the timeout value of the mirror disk monitor resource and the hybrid disk monitor resource.
Collect the dump file of the monitor process at timeout occurrence (Only for Oracle monitor resources)
Specify whether collecting the dump file of the EXPRESSCLUSTER monitoring process when time out occurs.
The collected dump file is saved in work\rm\ resource name\errinfo.cur folder under EXPRESSCLUSTER install folder. When collection is executed more than once, the folder names of the past collection information are renamed as errinfo.1, errinfo.2. And the folders are saved by 5 generations from the latest information.
Do Not Retry at Timeout Occurrence
When this function is enabled, recovery action is executed immediately if a monitor resource timeout occurs
Do Not Execute Recovery Action at Timeout Occurrence
When this function is enabled, recovery action is not executed if a monitor resource timeout occurs.
This can be set only when the Do Not Retry at Timeout Occurrence function is enabled.
Note
For the following monitor resources, the Do Not Retry at Timeout Occurrence and Do Not Execute Recovery Action at Timeout Occurrence functions cannot be set.
multi target monitor resources
Custom monitor resource (only when Monitor Type is Asynchronous)
Message receive monitor resource
JVM monitor resource
System monitor resource
Process resource monitor resource
User mode monitor resource
Retry Count (0 to 999)
Specify how many times an error should be detected in a row after the first one is detected before the status is determined as error. If you set this to zero (0), the status is determined as error at the first detection of an error.
Wait Time to Start Monitoring (0 to 9999)
Set the wait time to start monitoring.
Monitor Timing
Set the monitoring timing. Select the timing from:
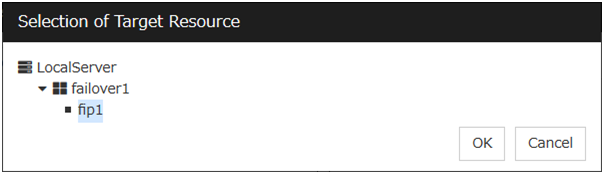
Target Resource
The resource which will be monitored when activated is shown.
Browse
Click this button to open the dialog box to select the target resource. The group names and resource names that are registered in LocalServer and the cluster are shown in a tree view. Select the target resource and click OK.
Choose servers that execute monitoring
Choose the servers that execute monitoring.
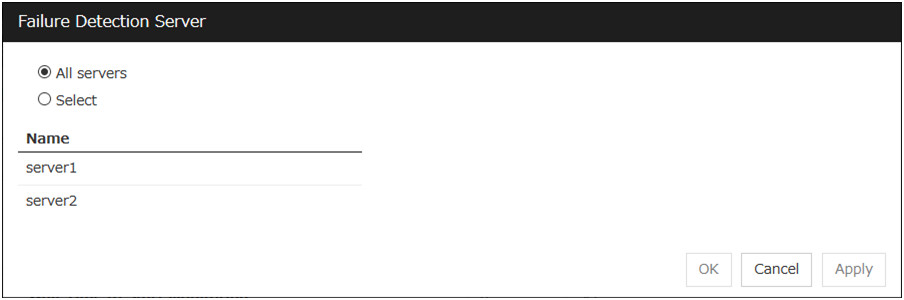
All Servers
All servers monitor the resources.
Select
Servers registered in Available Servers monitor the resources. One or more servers need to be set to Available Servers.
Send polling time metrics
Enable or disable sending metrics: data on the monitoring process time taken by the monitor resource.
Note
Message receive monitor resource
4.3.3. Monitor (special) tab
Some monitor resources require the parameters at the monitoring operation to be configured. The parameters are described in the explanation part about each resource.
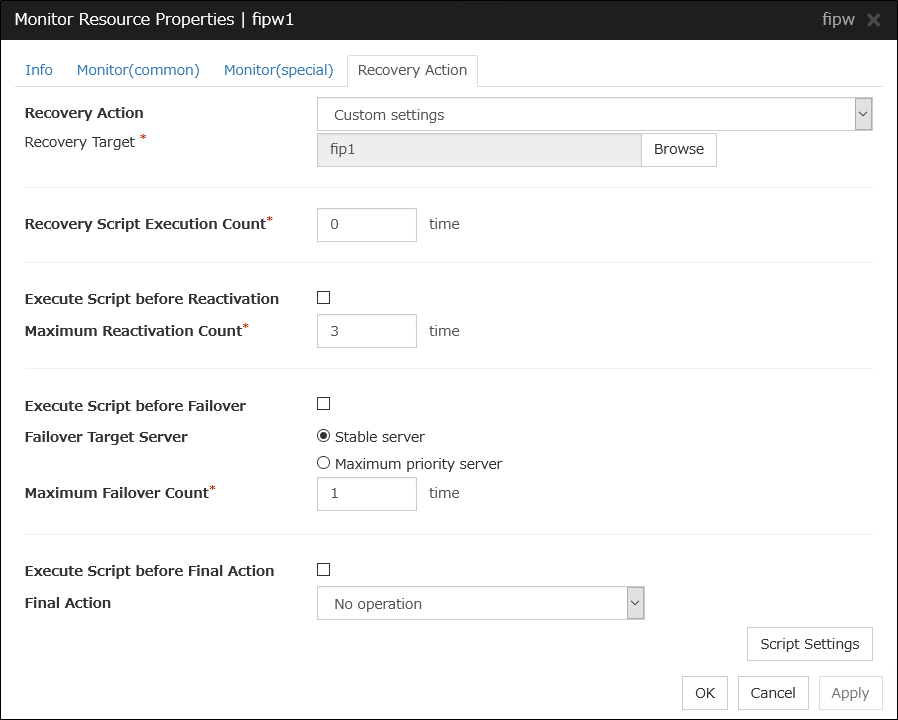
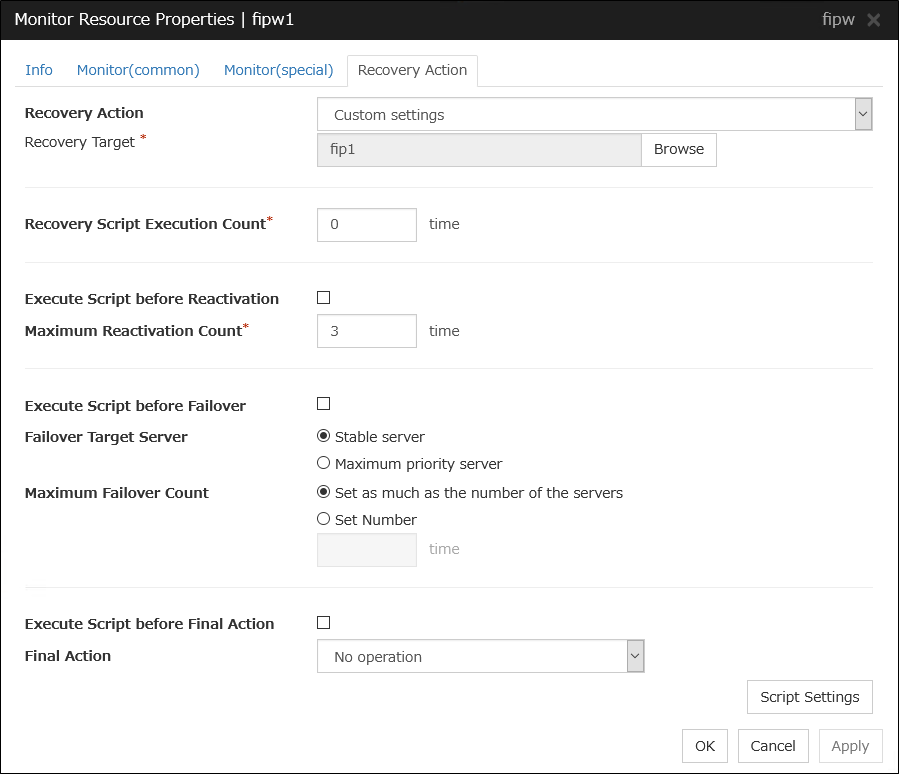
4.3.4. Recovery Action tab
Settings for monitor resources other than message receive monitor resources
When Server is selected for Failover Count Method on the Extension tab in Cluster Properties:
When Cluster is selected for Failover Count Method on the Extension tab in the Cluster Properties:
Settings for message receive monitor resources
In this dialog box, you can configure the recovery target and an action to be taken at the time when an error is detected. By setting this, it allows failover of the group, restart of the resource and cluster when an error is detected. However, recovery will not occur if the recovery target is not activated.
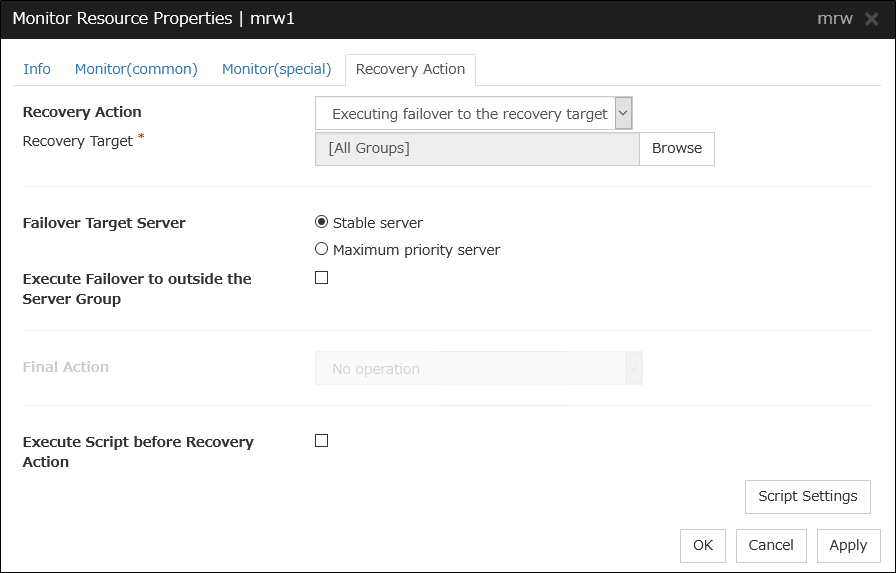
Recovery Action
Select a recovery action when detecting an error.
Recovery Target
A target is shown, which is to be recovered when it is determined as a resource error.
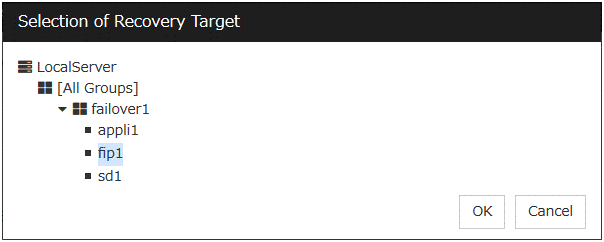
Browse
Click this button to open the dialog box in which you can select the target resource. LocalServer, All Groups, and the group names and resource names that are registered in the cluster are shown in a tree view. Select the target resource and click OK.
Recovery Script Execution Count (0 to 99)
Specify the number of times to allow execution of the script configured by Script Settings when an error is detected. If this is set to zero (0), the script does not run.
Execute Script before Reactivation
Specify whether to run the script before reactivation.
Maximum Reactivation Count (0 to 99)
Specify how many times you allow reactivation when an error is detected. If this is set to zero (0), no reactivation is executed. This is enabled when a group or group resource is selected as a recovery target. This cannot be set for message receive monitor resources.
If a group for which Exclude server with error detected by specified monitor resource, from failover destination in Failover Attribute (Advanced) is set or a resource that belongs to the group is set as the recovery target of an IP monitor resource or NIC Link Up/Down monitor resource, reactivation of the recovery target fails because an error is detected in the monitor resource registered as a critical monitor resource.
Execute Script before Failover
Specify whether to run the script before failover.
Failover Target Server
Select a Failover Target Server for the failover that takes place after reactivation retries upon activation error detection have failed for the number of times specified in Retry Count at Activation Failure.
Execute Failover to outside the Server Group
Can be configured only for message receive monitor resources. Specify whether to fail over to a server group other than the active server group upon the reception of an error message.
Maximum Failover Count (0 to 99)
Specify how many times you allow failover after reactivation fails for the number of times set in Reactivation Threshold when an error is detected. If this is set to zero (0), no failover is executed. This is enabled when a group or group resource or All Groups is selected as a recovery target. This cannot be set for message receive monitor resources.
When Server is selected for Failover Count Method on the Extension tab in the Cluster Properties, set an arbitrary count to the maximum failover count.
When Cluster is selected for Failover Count Method on the Extension tab in the Cluster Properties, set an arbitrary count to the maximum failover count.
For the Failover Count Method settings, refer to " Extension Tab " in " Cluster properties " in " 2. Parameter details " in this guide.
Execute Script before Final Action
Select whether script is run or not before executing final action.
Execute Script before Recovery Action
Select whether script is run or not before executing recovery action.
This can be set only for a message receive monitor resource.
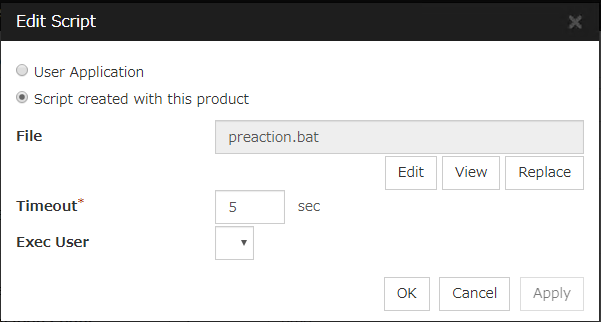
Script Settings
Click here to display the Edit Script dialog box. Set the recovery script/command.
User Application
Use an executable file (executable batch file or execution file) on the server as a script. For the file name, specify an absolute path or name of the executable file of the local disk on the server. If you specify only the name of the executable file, you must configure the path with environment variable in advance. If there is any blank in the absolute path or the file name, put them in double quotation marks ("") as follows.
Example:
"C:\Program Files\script.bat"
If you want to execute VBScript, enter a command and VBScript file name as follows.
Example:
cscript script.vbs
Each executable file is not included in the cluster configuration information of the Cluster WebUI. They must be prepared on each server because they cannot be edited or uploaded by the Cluster WebUI.
Script created with this product
Use a script file which is prepared by the Cluster WebUI as a script. You can edit the script file with the Cluster WebUI if you need. The script file is included in the cluster configuration information.
File (Within 1023 bytes)
Specify a script to be executed (executable batch file or execution file) when you select User Application.
View
Click here to display the script file when you select Script created with this product.
Edit
Click here to edit the script file when you select Script created with this product. Click Save to apply the change. You cannot modify the name of the script file.
Replace
Click here to replace the contents of a script file with the contents of the script file which you selected in the file selection dialog box when you select Script created with this product. You cannot replace the script file if it is currently displayed or edited. Select a script file only. Do not select binary files (applications), and so on.
Timeout (1 to 9999)
Specify the maximum time to wait for completion of script to be executed. The default value is set as 5.
Exec User
Specify a user to run a script. Execution users can be selected from users registered in the Account tab of Cluster propertiesIf you do not specify an execution user, the script is run by local system account.
Final Action
Select a final action to be taken after reactivation fails for the number of times set in Reactivation Threshold, and failover fails for the number of times set in Failover Threshold when an error is detected.
Select the final action from the options below:
Note
Use No operation to:
Suppress the final action temporarily
Show only alerts on detection of an error
Take the final action practically with multi-target monitor resources
4.4. Understanding application monitor resources
Application monitor resources monitor application resources.
4.4.1. Monitoring by application monitor resources
Application monitor resources monitor application resources in a server where they are activated. They regularly monitor whether applications are active or not. When they detect that applications do not exist, it is determined to be an error.
4.4.2. Note on application monitor resources
An application monitor resource monitors a successfully activated application resource. The application resource can be monitored if it is specified as a resident type resource.
4.4.3. Monitor (special) tab
There are no monitor (special) tabs for application monitor resources.
4.5. Understanding disk RW monitor resources
Disk RW monitor resources monitor disk devices by writing dummy data to the file system.
4.5.1. Monitoring by disk RW monitor resources
Disk RW monitor resources write data to the specified file system (basic volume or dynamic volume) with the specified I/O size and evaluate the result.
They solely evaluate whether data was written with the specified I/O size but do not evaluate validity of data. (Created file is deleted after writing)
OS and disk get highly loaded if the size of I/O is large.
Depending on disk and/or interface being used, caches for various writing are mounted. Because of this, if the size of I/O is small, a cache hit may occur and an error in writing may not get detected. Intentionally generate a disk error to confirm that the size of I/O is sufficient to detect an error.
Note
If you want multipath software to initiate path failover when disk path is not connected, you should set longer timeout for disk RW monitor resource than path failover time.
4.5.2. Monitor (special) tab
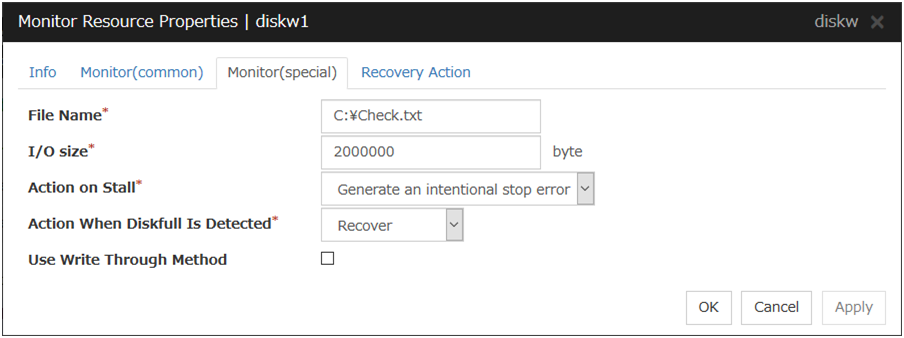
File Name (Within 1023 bytes)
Enter the file name to access. This file is created upon monitoring and deleted after I/O completes.
Note
Specify an absolute path for the file name. If a relative path is specified for the file name, the disk RW monitor resource may monitor the unexpected place.
Important
Do not specify any existing file for the file name. If an existing file is specified for the file name, the data of the file is lost.
I/O size (1 to 9999999)
Specify the I/O size for the disk to monitor.
Action on Stall
Specify the action to take when stalling is detected.
Stalling is detected if I/O control is not returned from the OS within the time specified in Timeout of the Monitor (common) tab.
Note
A Dummy Failure cannot be triggered by a stall.
Action When Diskfull Is Detected
Select the action when diskfull (state in which the disk being monitored has no free space) is detected
Use Write Through Method
Applies the Write Through method to the monitor I/O method.
If the Write Through method is enabled, the error detection precision of the disk RW monitor will improve. However, the I/O load on the system may increase.
- 4
This function does not require ipmiutil, unlike the forced stop function.
4.6. Understanding floating IP monitor resources
Floating IP monitor resources monitor floating IP resources.
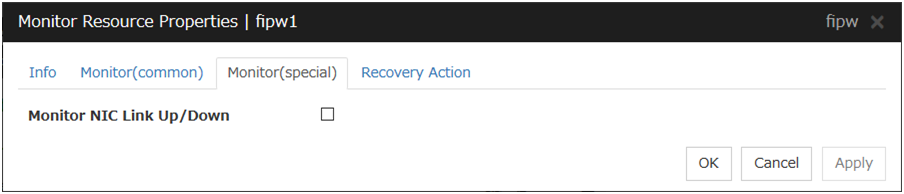
4.6.1. Monitoring by floating IP monitor resources
Floating IP resources monitor using WMI floating IP resources in a server where they are activated. Floating IP monitor resources monitor whether floating IP addresses exist in the list of IP addresses. If a floating IP address does not exist in the list of IP addresses, it is determined to be an error.
Floating IP resources monitor link up/down of NIC where a floating IP address is active. If NIC link down is detected, it is considered as an error.
4.6.2. Note on floating IP monitor resources
4.7. Understanding IP monitor resources
IP monitor resource is a monitor resource which monitors IP addresses by using the ping command depending on whether there is a response or not.
4.7.1. Monitoring by IP monitor resources
IP monitor resource monitors specified IP addresses by using the ping command. If all IP addresses do not respond, the status is determined to be error.
If you want to establish error when all of the multiple IP addresses have error, register all those IP addresses with one IP monitor resource.
The following figure shows an example of one IP monitor resource in which all IP addresses are registered. If any of the registered IP addresses are normal, IP monitor 1 considers all of them to be normal.
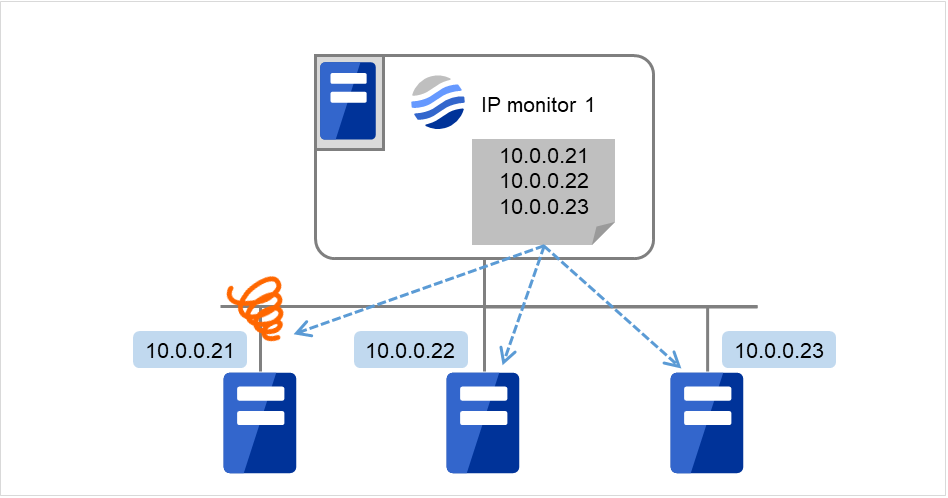
Fig. 4.58 One IP monitor resource where all IP addresses are registered (in normal cases)
The following figure shows an example of one IP monitor resource in which all IP addresses are registered. If all of the registered IP addresses are in error, IP monitor 1 considers so.
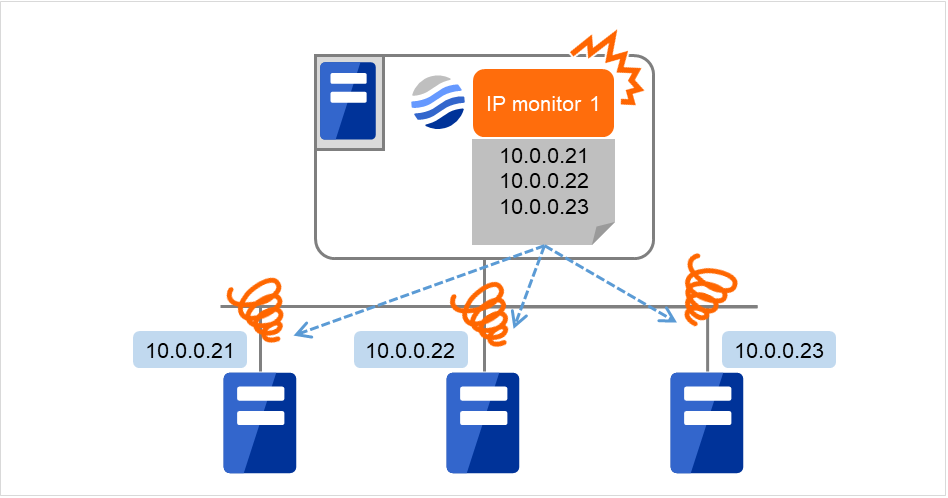
Fig. 4.59 One IP monitor resource where all IP addresses are registered (in error detection)
If you want to establish error when any one of IP addresses has an error, create one IP monitor resource for each IP address.
The following figure shows an example of IP monitor resources, in each of which one IP address is registered. If there is an error of the IP address registered in any of the IP monitor resources, it (IP monitor 1) considers so.
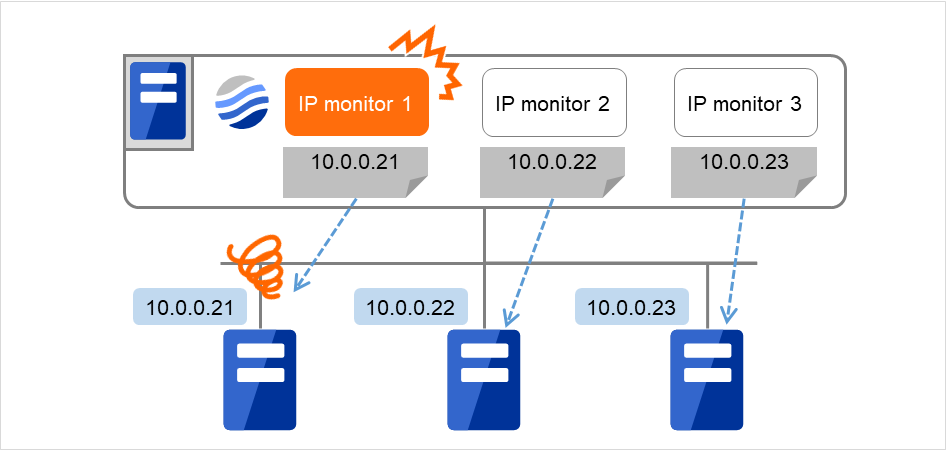
Fig. 4.60 IP monitor resources, in each of which one IP address is registered (in error detection)
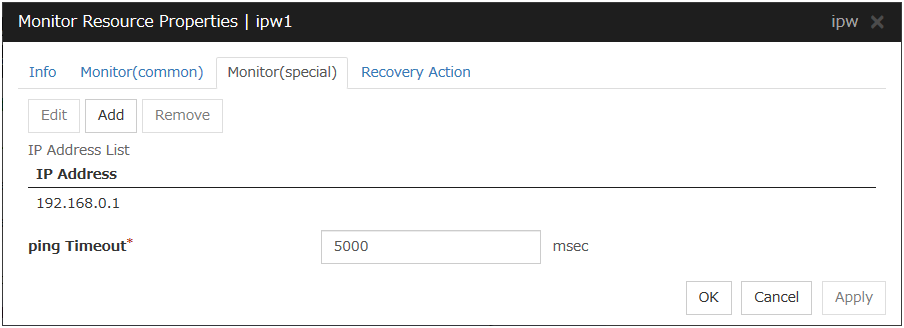
4.7.2. Monitor (spacial) tab
IP addresses to be monitored are listed in IP Addresses.
Add
Click Add to add an IP address to be monitored. A dialog box where you can enter an IP address is displayed.
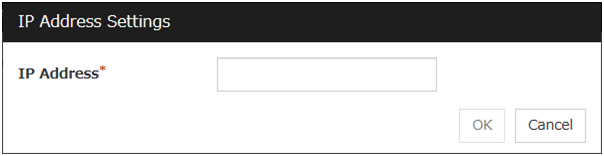
IP Address (Within 255 bytes)
Enter an IP address to be monitored in this field and click OK. The IP address to be entered here should be the one that exists on the public LAN.
Remove
Click Remove to remove an IP address selected in IP Addresses from the list so that it will no longer be monitored.
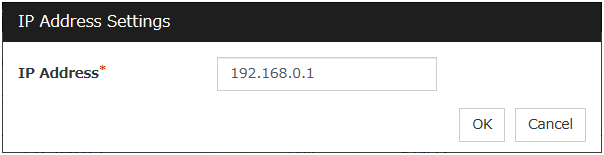
Edit
Click Edit to display the IP Address Settings dialog box. The dialog box shows the IP address selected in IP Addresses on the Parameter tab. Edit the IP address and click OK.
ping Timeout (1 to 999999)
Specify the timeout of the ping to be sent to monitor the IP address in milliseconds.
4.8. Understanding mirror disk monitor resources
Mirror monitor resources monitor a mirror partition device or mirror driver works properly.
4.8.1. Note on mirror disk monitor resources
4.8.2. Monitor (special) tab
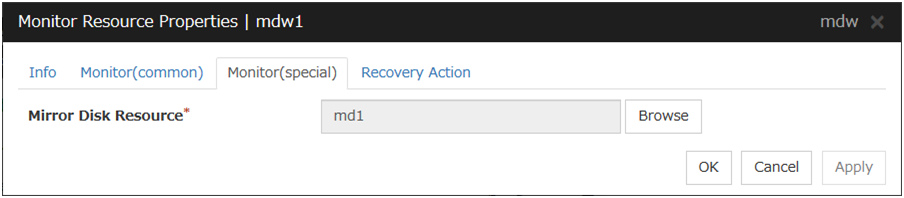
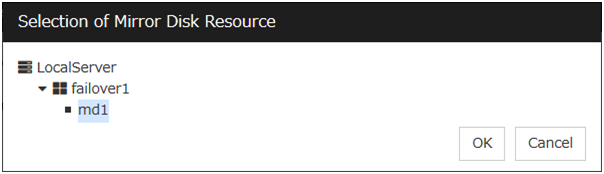
Mirror Disk Resource
The mirror disk resource to be monitored is displayed.
Browse
Click this button to display the dialog box where you can select a mirror disk resource to be monitored. Mirror disk resources registered with the cluster are displayed in a tree view. You can select only mirror disk resources in this view. Select a mirror disk resource and click OK.
4.9. Understanding NIC link up/down monitor resources
NIC Link Up/Down monitor resource obtains the information on how the specified NIC using WMI is linked and monitors the linkage is up or down.
4.9.1. Configuration and range of NIC link up/down monitoring
4.9.2. Monitor (special) tab
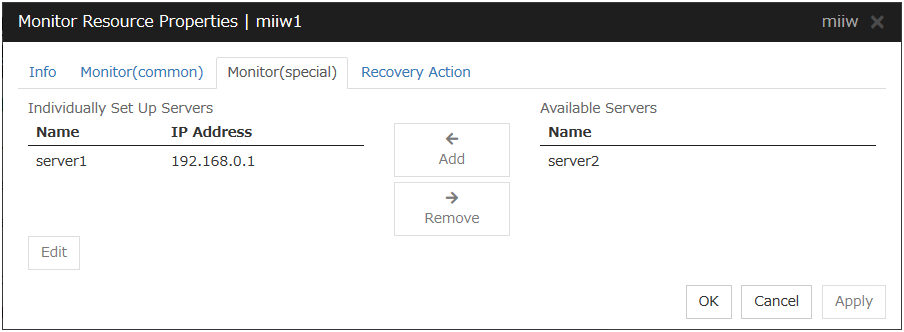
Add
Add the IP address of the NIC to be monitored to the list of monitoring servers.
Remove
Delete the IP address of the NIC to be monitored from the list of monitoring servers.
Edit
Edit the IP address of the NIC to be monitored.
IP Address (Within 47 bytes)
Specify the IP address of the NIC to be monitored.
4.10. Understanding multi target monitor resources
The multi target monitor resource monitors more than one monitor resources.
4.10.1. Note on the multi target monitor resource
The multi target monitor resources regard the offline status of registered monitor resources as being an error. For this reason, for a monitor resource that performs monitoring when the target is active is registered, the multi target monitor resource might detect an error even when an error is not detected by the monitor resource. Do not, therefore, register monitor resources that perform monitoring when the target is active.
4.10.2. Multi target monitor resource status
The status of the multi target monitor resource is determined by the status of registered monitor resources.
The table below describes status of multi target monitor resource when the multi target monitor resource is configured as follows:
The table below describes status of a multi target monitor resource:
Multi target monitor resource status |
Monitor resource1 status |
|||
|---|---|---|---|---|
Normal |
Error |
Offline |
||
Monitor resource2 status |
Normal |
normal |
caution |
caution |
Error |
caution |
error |
error |
|
Offline |
caution |
error |
normal |
|
- Multi target monitor resource monitors status of registered monitor resources.If the number of the monitor resources with the error status exceeds the error threshold, multi target monitor resource detects an error.If the number of the monitor resources with the caution status exceeds the caution threshold, the status of the multi target monitor resource becomes caution.If all registered monitor resources are in the status of stopped (offline), the status of multi-target monitor resource becomes normal.Unless all the registered monitor resources are stopped (offline), the multi target monitor resource recognizes the stopped (offline) status of a monitor resource as error.
- If the status of a registered monitor resource becomes error, actions for the error of the monitor resource are not executed.Actions for error of the multi target monitor resource are executed only when the status of the multi target monitor resource becomes error.
4.10.3. Monitor (special) tab
Monitor resources are grouped and the status of the group is monitored. You can register up to 64 monitor resources in the Monitor Resources.
When the only one monitor resource set in the Monitor Resources is deleted, the multi target monitor resource is deleted automatically.
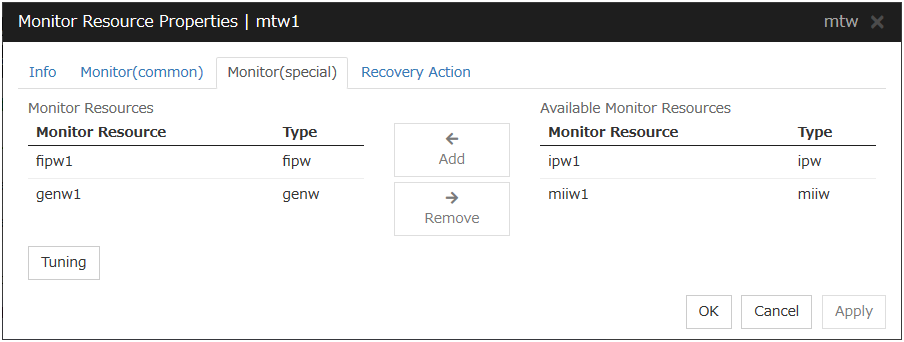
Add
Click Add to add a selected monitor resource to Monitor Resources.
Remove
Click Remove to delete a selected monitor resource from Monitor Resources.
Tuning
Open Multi Target Monitor Resource Tuning Properties dialog box. Configure detailed settings for the multi target monitor resource.
MultiTarget Monitor Resource Tuning Properties
Parameter tab
Display the details of setting the parameter.
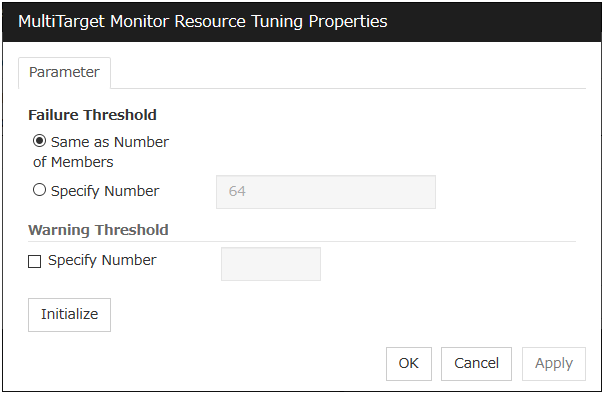
Error Threshold
Select the condition for multi target monitor resources to be determined as an error.
Warning Threshold
Initialize
Clicking Initialize resets all items to their default values.
4.11. Understanding registry synchronization monitor resources
Registry synchronization monitor resources monitor registry synchronization resources.
4.11.1. Note on registry synchronization monitor resources
4.11.2. Monitor (special)
There are no monitor (special) tabs for registry synchronization monitor resources.
4.12. Understanding disk TUR monitor resources
Disk TUR monitor resources monitor the disk specified by disk resource.
4.12.1. Notes on disk TUR monitor resources
- You cannot run the SISI Test Unit Ready command on a disk or disk interface (HBA) that does not support it.Even if your hardware supports this command, consult the driver specifications because the driver may not support it.
TUR monitor resources, compared to disk RW monitor resources, burdens OS and disks less.
In some cases, Test Unit Ready may not be able to detect actual errors in I/O to media.
If you want multipath software to initiate path failover when disk path is not connected, you should set longer timeout for disk RW monitor resource than path failover time.
- This monitor resource is automatically registered when a disk resource is added. A disk TUR monitor resource corresponding to a disk resource is automatically registered.Disk TUR monitor resources are initially defaulted, so configure appropriate resource settings as needed.
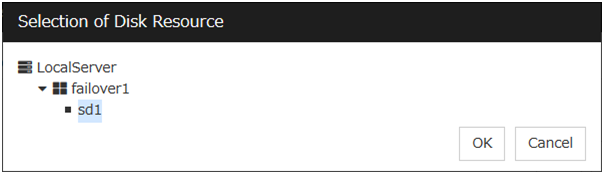
4.12.2. Monitor (special) tab
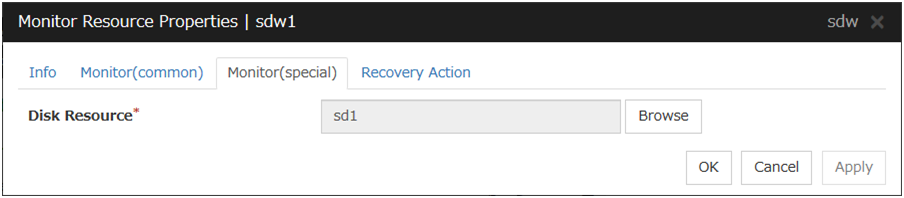
Disk Resource
Select a disk resource.
Browse
Click this button to display the disk resources that can be registered.
4.13. Understanding service monitor resources
Service monitor resources monitor service resources or services.
4.13.1. Monitoring by service monitor resources
They regularly check the service status with the service control manager and if the status of the service resource becomes Stopped, it is considered as an error.
4.13.2. Note on service monitor resources
If you select When activated in Monitor Timing and specify a service resource in Target Resource, the Service Name of the service resource is applied to that of the service monitor resource.
4.13.3. Monitor (special) tab
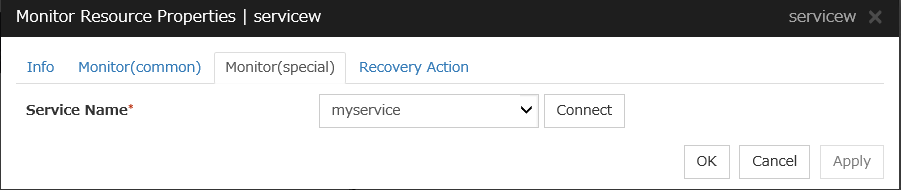
Service Name (Within 1023 bytes)
Specify the service name or service display name used in the service resource.
Combo box options display the list of the service display names of the services collected from the server.
The service name cannot be changed, if you select When activated in Monitor Timing and specify a service resource in Target Resource.
Connect
Collects the service list from all the servers and updates the service display name list to be displayed in the Service Name combo box.
4.14. Understanding virtual computer name monitor resources
Virtual computer name monitor resources monitor virtual computer name resources.
4.14.1. Monitoring by virtual computer name monitor resources
Virtual computer name monitor resources monitor virtual computer name resources in a server where they are activated. Virtual computer name monitor resources regularly check the virtual computer name control process. It is considered an error if the process is not found.
4.14.2. Virtual computer name monitor resource
This monitor resource is automatically registered when the virtual computer name resource is added.
- The effective final actions when an error in this resource is detected is set to Stop the cluster service and shutdown OS, Stop the cluster service and reboot OS and Generating of intentional Stop Error only.This is because the OS reboot is required for correctly activating virtual computer name resource when virtual computer name control process disappeared.The default setting is Stop the cluster service and shutdown OS. Do not change it to other than Stop the cluster service and shutdown OS, Stop the cluster service and reboot OS, or Generate an intentional stop error.If the virtual computer name control process is not found, the group fails over by shutting down or rebooting the server that detected an error.
4.14.3. Monitor (special) tab
There are no monitor (special) tabs for virtual computer name monitor resources.
4.15. Understanding dynamic DNS monitor resources
4.15.1. Notes on dynamic DNS monitor resources
Dynamic DNS monitor resources are automatically created when dynamic DNS resources are added. One dynamic DNS monitor resource is automatically created per dynamic DNS resource.
Dynamic DNS monitor resources cannot be deleted. When dynamic DNS resources are deleted, dynamic DNS monitor resources are automatically deleted.
Do not change the recovery target.
Monitoring cannot be suspended or resumed using the clpmonctrl command or Cluster WebUI.
If the target dynamic DNS resource is active when the cluster is suspended, the dynamic DNS monitor resource continues to operate without stopping.
Alive monitoring is performed for a DDNS control process (clpddnsp.exe) periodically. If a disappearance of the process is detected, it is determined that an error has occurred. The alive monitoring interval is specified in Interval of the Monitor (common) tab. If the Execute Dynamic Update Periodically check box of the dynamic DNS resource Details tab is not selected, a DDNS control process (clpddnsp.exe) is generated, but alive monitoring is not performed.
When the DNS server is down, a failover may start depending on the configuration. Therefore, it is recommended to use IP monitor resources together when checking the connection to the DNS server.
4.15.2. Monitor (special) tab
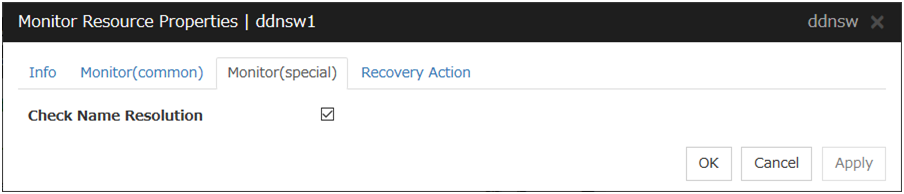
Check Name Resolution
4.16. Understanding virtual IP monitor resources
Virtual IP monitor resources monitor virtual IP resources.
4.16.1. Monitoring by virtual IP monitor resources
Virtual IP monitor resources monitor virtual IP resources in a server where they are activated. Virtual IP monitor resources monitor whether the virtual IP address exists in the list of IP addresses. If the virtual IP address does not exist, it is considered as an error.
Floating IP resources monitor using WMI link up/down of NIC where a virtual floating IP address is active. If NIC link down is detected, it is considered as an error.
4.16.2. Notes on virtual IP monitor resources
This resource is automatically registered when virtual IP resources are added.
4.16.3. Monitor (special) tab
There are no monitor (special) tabs for virtual IP monitor resources.
4.17. Understanding CIFS monitor resources
CIFS monitor resources monitor CIFS resources.
4.17.1. Monitoring by CIFS monitor resources
CIFS resources monitor CIFS resources in a server where they are activated.
CIFS monitor resources obtain the information of shared folders publicized on a server and monitor if the shared folders publicized by CIFS resources are contained. An error is detected when the shared folders publicized by CIFS resources do not exist.
CIFS monitor resources also monitor accessibility to the shared folders.
When auto-saving of shared configuration of drive is executed, activation monitoring of the function to share and save the shared configuration is also be executed.
4.17.2. Notes on CIFS monitor resources
When access check needs to be performed, the specified access method must be permitted for the local system account in the CIFS resources to be monitored.
When Execute the automatic saving of shared configuration of drive is configured and not specify shared folder name to path on the monitoring target CIFS resource and the access check is executed on CIFS monitor resource, the specified access as a check method is executed on all the shared folder of the auto-saving target drive. When Read of folder check/file check is specified as checking method, the folder/file specified on Path must be on each shared folder.
- This monitor resource is automatically registered when a CIFS resource is added. A CIFS monitor resource corresponding to a CIFS resource is automatically registered.The default value is set for CIFS monitor resources. Change it to an appropriate value as needed.
4.17.3. Monitor (special) tab
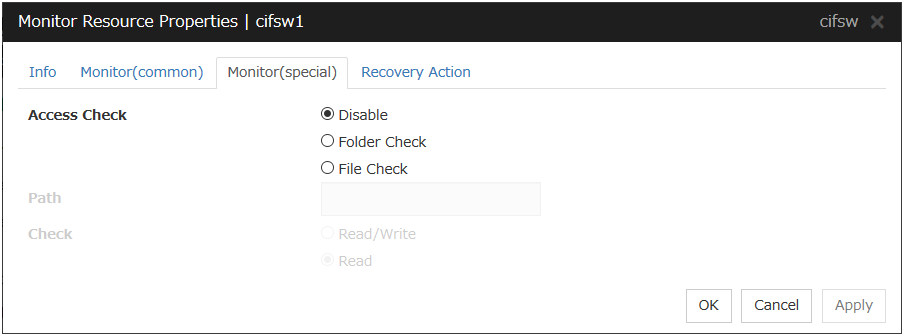
Access Check
Specify the way to check access to the shared folders.
Path (Within 255 bytes)
Specify the file/folder for access check by using a path including the shared folder or a relative path from the shared folder.
For folder check, specify the folder in the shared folder.
When Execute the automatic saving of shared configuration of drive is selected for the target CIFS resource, the file/folder for access check is specified by using an absolute path including the shared folder or a relative path from the shared folder. Based on which path is used, the file/folder which are created in advance for access check are different.
If a path including shared folder is used, only specified shared name file/folder need to be created, use the format "<shared-name>\folder-name/file-name". Surround a shared name with "< >".
If a relative path from the shared folder is used, folders with the same name need to be created in advance on all folders for which the sharing setting is configured.
When specifying shared configuration individually (when Execute the automatic saving of shared configuration of drive is not selected), specify the file/folder by using a relative path from the shared folder.
When Read/Write is selected as a file check method, the specified file is newly created. Make sure to specify a file name that does not overlap with other file names.
When Read is selected a file check method, specify a file in the shared folder. When Execute the automatic saving of shared configuration of drive is configured to the target CIFS resource, files with the same name need to be created in advance on all folders for which the sharing setting is configured.
Check
Select the way to check the access for File Check.
4.18. Understanding hybrid disk monitor resources
Hybrid disk monitor resources monitor a mirror partition device or mirror driver works properly.
4.18.1. Note on hybrid disk monitor resources
4.18.2. Monitor (special) tab
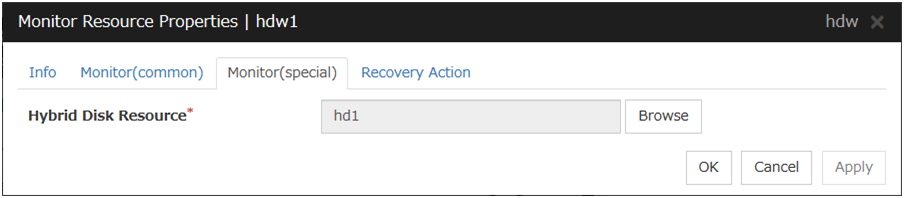
Hybrid Disk Resource
The hybrid disk resource to be monitored is displayed.
Browse
Click this button to display the dialog box where you can select a hybrid disk resource to be monitored. Hybrid disk resources registered with the cluster are displayed in a tree view. You can select only hybrid disk resources in this view. Select a hybrid disk resource and click OK.
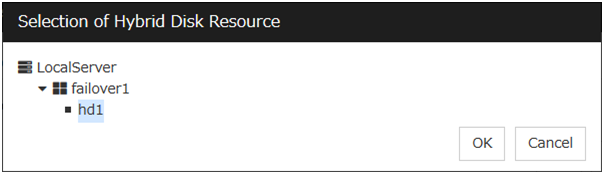
4.19. Understanding hybrid disk TUR monitor resources
Hybrid disk TUR monitor resources monitor the disk specified by hybrid disk resource.
4.19.1. Notes on hybrid disk TUR monitor resources
- This resource is automatically registered when a hybrid disk resource is added. Hybrid disk TUR monitor resources corresponding hybrid disk resources are automatically registered.When this resource is deleted, be careful that auto mirror recovery cannot be executed.Refer to "Automatically recovering from mirroring" in "Recovering from mirror breaks" in "10. Troubleshooting" in this guide for the details.
- You cannot run the SISI Test Unit Ready command on a disk or disk interface (HBA) that does not support it. Even if your hardware supports this command, consult the driver specifications because the driver may not support it.
- TUR monitor resources, compared to disk RW monitor resources, burdens OS and disks less.
- In some cases, Test Unit Ready may not be able to detect actual errors in I/O to media.
4.19.2. Monitor (special) tab
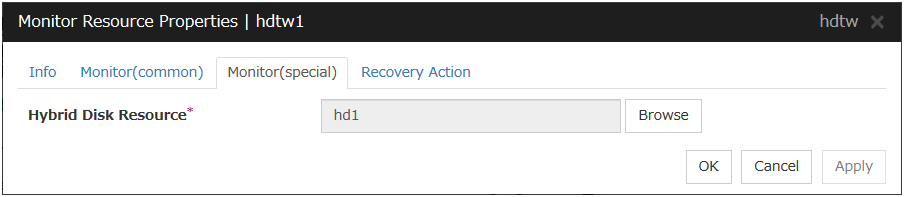
Hybrid Disk Resource
Select a hybrid disk resource.
Browse
Click this button to display the hybrid disk resources that can be registered.

4.20. Understanding custom monitor resources
Custom monitor resources monitor system by executing an arbitrary script.
4.20.1. Monitoring by custom monitor resources
Custom monitor resources monitor system by an arbitrary script.
When Monitor Type is Synchronous, custom monitor resources regularly run a script and detect errors from its error code.
When Monitor Type is Asynchronous, custom monitor resources run a script upon start monitoring and detect errors if the script process disappears.
4.20.2. Note on custom monitor resources
When a command for outputting a message (standard output, error output) in response to the prompt is executed as part of a batch file, the batch file may stop during execution of the command. Therefore, specify (perform redirection to) a file or nul as the message output destination.
When the monitor type is set to Asynchronous, configure for the timeout a larger value than the waiting time for the monitor start.
4.20.3. Monitor (special) tab
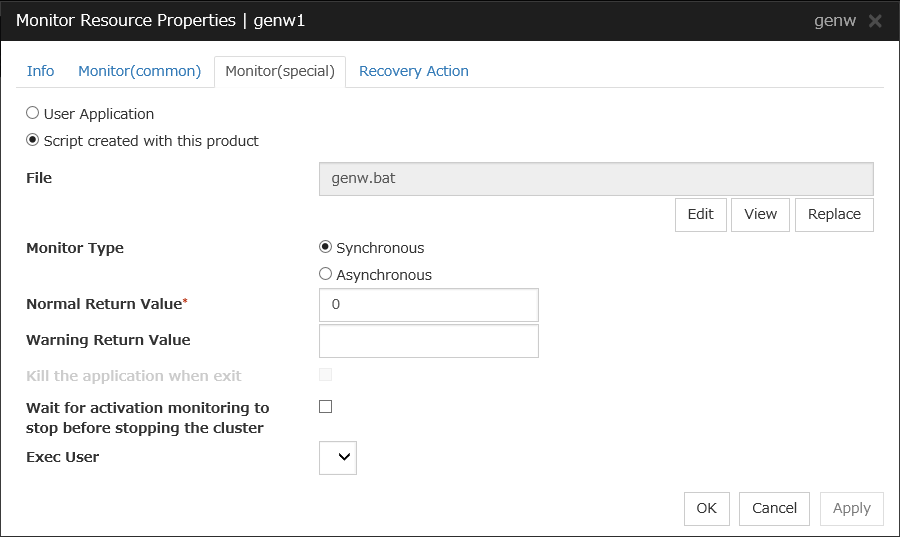
User Application
Use an executable file (executable batch file or execution file) on the server as a script. For the file name, specify an absolute path or name of the executable file of the local disk on the server.Each executable files is not included in the cluster configuration information of the Cluster WebUI. They must be prepared on each server because they cannot be edited nor uploaded by the Cluster WebUI.
Script created with this product
Use a script file which is prepared by the Cluster WebUI as a script. You can edit the script file with the Cluster WebUI if you need. The script file is included in the cluster configuration information.
File (Within 1023 bytes)
Specify the script to be executed (executable shell script file or execution file) when you select User Application with its absolute path on the local disk of the server. However, no argument can be specified after the script.
View
Click here to display the script file when you select Script created with this product.
Edit
Click here to edit the script file when you select Script created with this product. Click Save to apply the change. You cannot modify the name of the script file.
Replace
Click here to replace the contents of a script file with the contents of the script file which you selected in the file selection dialog box when you select Script created with this product. You cannot replace the script file if it is currently displayed or edited. Select a script file only. Do not select binary files (applications), and so on.
Monitor Type
Select a monitor type.
Normal Return Value (Within 1023 bytes)
When Asynchronous is selected for Monitor Type, set the values of script error code to be determined as normal. If you want to set two or more values here, separate them by commas like 0,2,3 or connect them with a hyphen to specify the range like 0-3.
Default value: 0
Warning Return Value (Within 1023 bytes)
When Asynchronous is selected for Monitor Type, set the values of script error code to be determined as warning. If you want to set two or more values here, separate them by commas like 0,2,3 or connect them with a hyphen to specify the range like 0-3.If Warning Return Value is set to the same value as Normal Return Value, it is regarded as normal.
Kill the application when exit
Specify whether or not to forcibly terminate the application as termination of monitoring stop. If this is selected, the application is forcibly terminated instead of normal termination. This is effective only when Monitor Type is set to Asynchronous.
Wait for activation monitoring to stop before stopping the cluster
The cluster stop waits until the custom monitor resource is stopped. This is effective only when the monitoring timing is set to Active.
Exec User
Specify a user to run a script. Execution users can be selected from users registered in the Account tab of Cluster properties.If you do not specify an execution user, the script is run by local system account.
4.21. Understanding message receive monitor resources
4.21.1. Monitoring by message receive monitor resources
When an error message is received from an outside source, the resource recovers the message receive monitor resource whose Category and Keyword have been reported. (The Keyword can be omitted.) If there are multiple message receive monitor resources whose monitor types and monitor targets have been reported, each monitor resource is recovered.
Message receive monitors can receive error messages issued by the clprexec command.
The following figure shows an example of a configuration with a message receive monitor resource. Receiving an error message issued by the clprexec command, the message receive monitor resource of Server 2 changes its own status and starts a recovery from the detected error.
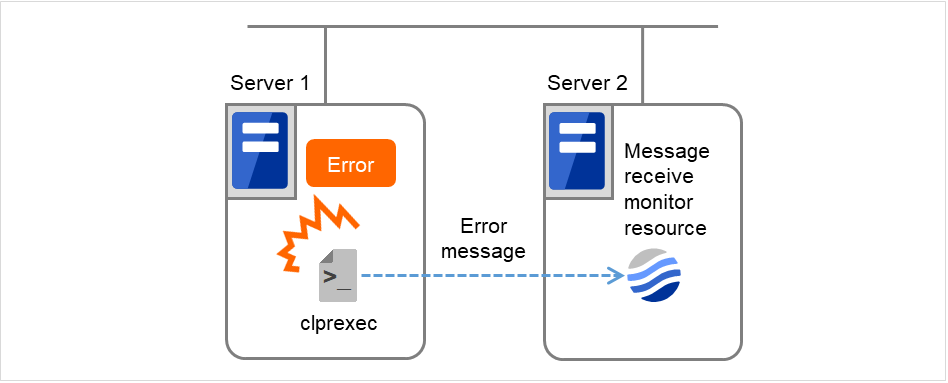
Fig. 4.61 Configuration with a message receive monitor resource
4.21.2. Failover to a server group at another site
Upon the reception of notification of the occurrence of an error, failover from the active server group to another server group is allowed.
The server groups and the following settings must be specified:
Recovery target group resource
Select Use Server Group Settings.
Message receive monitor
Select Execute failover to the recovery target for the recovery target.
Select Execute Failover to outside the Server Group.
Upon the execution of server group failover to another site, the dynamic failover settings and inter-server group failover settings are disabled. The server fails over to the server having the highest priority in a server group other than that to which it belongs.
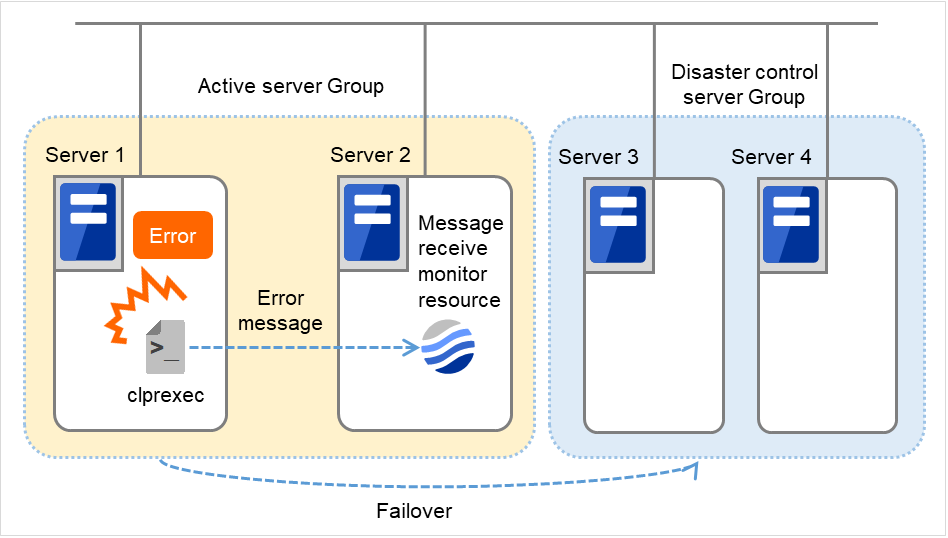
Fig. 4.62 Configuration with a message receive monitor resource (in failing over to another server group)
4.21.3. Notes on message receive monitor resources
<General notes on message receive monitor resources>
If a message receive monitor resource is paused when an error message is received from outside, error correction is not performed.
If an error message is received from outside, the status of the Message receive monitor resource becomes "error." This error status is not automatically restored to "normal." To restore the status to normal, use the clprexec command. For details about this command, see "Requesting processing to cluster servers (clprexec command)" in "9. EXPRESSCLUSTER command reference" in this guide.
If an error message is received when the Message receive monitor resource is already in the error status due to a previous error message, recovery from the error is not performed.
When the recovery action is Executing failover to the recovery target, and if Execute Another Server Group Failover is selected for the recovery target, the server always fails over to a server in a server group other than the active server group. If, however, the above-mentioned settings are configured but the server group is not configured, the failover destination is determined according to the ordinary failover policy.
4.21.4. Monitor (special) tab
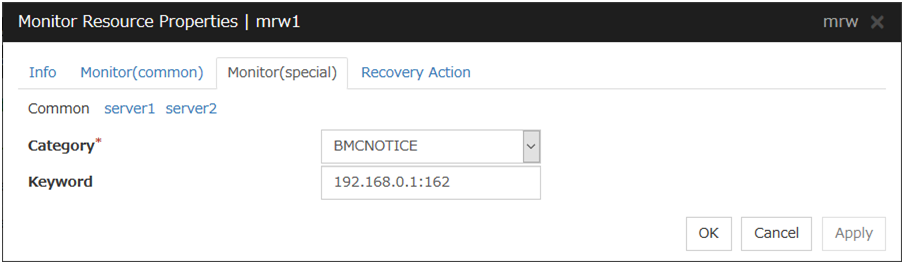
For Category and Keyword, specify a keyword passed using the -k parameter of the clprexec command. The monitor target can be omitted.
Category (Within 32 bytes)
Specify the category specified with -k argument of clprexec command.You can select an existing character string from the list box or specify a desired character string.
Keyword (Within 1023 bytes)
Specify the keyword specified with -k argument of clprexec command.
4.22. Understanding process name monitor resources
Process name monitor resources monitor the process of arbitrary process name.
4.22.1. Notes on process name monitor resources
If you set 1 for Minimum Process Count, and if there are two or more processes having the name specified for the monitor target, only one process is selected according to the following conditions and is subject to monitoring.
When the processes are in a parent-child relationship, the parent process is monitored.
When the processes are not in a parent-child relationship, the process having the earliest activation time is monitored.
When the processes are not in a parent-child relationship and their activation times are the same, the process having the lowest process ID is monitored.
If monitoring of the number of started processes is performed when there are multiple processes with the same name, specify the process count to be monitored for Minimum Process Count. If the number of processes with the same name falls short of the specified minimum count, an error is recognized. You can set 1 to 999 for Minimum Process Count. If you set 1, only one process is selected for monitoring.
Up to 1023 bytes can be specified for the monitor target process name. To specify a monitor target process with a name that exceeds 1023 bytes, use a wildcard (*).
If the name of the target process is 1023 bytes or longer, only the first 1023 bytes will be recognized as the process name. When specifying a process name by using a wild card (such as *), specify a character string that appears in the first 1023 bytes of the process name.
If the name of the target process is too long, the process name is output to the log file with the latter part omitted.
Use the following command to check the name of a process that is actually running and specify the name for the monitor target process name.
EXPRESSCLUSTER installation path\bin\GetProcess.vbs
When the above command is executed, GetProcess_Result.txt is output to the folder in which the command is executed. Open GetProcess_Result.txt and specify the CommandLine section of the process being displayed. If the output information includes double quotations (""), specify the section including the double quotations.
Example of output file
20XX/07/26 12:03:13
Caption         CommandLine
services.exe    C:\WINDOWS\system32\services.exe
svchost.exe     C:\WINDOWS\system32\svchost -k rpcss
explorer.exe    C:\WINDOWS\Explorer.EXE
4.22.2. Monitoring by process name monitor resources
Those processes having the specified process name are monitored. If Minimum Process Count is set to 1, the process ID is determined by the process name, and the error state is determined if the process ID vanishes. Process stalls cannot be detected.
If Minimum Process Count is set to a value greater than 1, the number of processes that have the specified process name are monitored. The number of processes to be monitored is calculated using the process name, and if the number falls below the minimum count, an error is recognized. Process stalls cannot be detected.
4.22.3. Monitor (special) tab
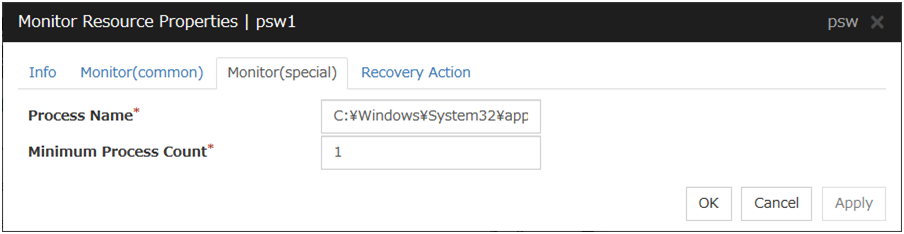
Process Name (Within 1023 bytes)
Specify the name of the process to be monitored. You must specify the process name.
Default value: None
Wild cards can be used to specify process names in the three patterns described below. Patterns other than these cannot be used.
prefix search : <character string included in process name>*
suffix search : *<character string included in process name>
partial search : *<character string included in process name>*
Minimum Process Count (1 to 999)
Set the process count to be monitored for the monitor target process. If the number of processes having the specified monitor target process name falls short of the set value, an error is recognized.
4.23. Understanding DB2 monitor resources
DB2 monitor resources monitor DB2 database that runs on the server.
4.23.1. DB2 monitor resources
For the supported DB2 versions, see "Application supported by the monitoring options" in "System requirements for the EXPRESSCLUSTER Server" in "Installation requirements for EXPRESSCLUSTER" in the "Getting Started Guide".
DLL interface (DB2CLI.DLL/DB2CLI64.DLL) needs to be installed on servers where monitoring is performed because DB2 CLI is used for monitoring.
For target monitoring resources, specify a service resource or a script resource that starts DB2. Monitoring starts after the target resource is activated; however, if the database cannot be started right after the target resource is activated, adjust the time by using Wait Time to Start Monitoring.
A monitor table is created when monitoring is started and it is deleted when monitoring is stopped due to the stop of the failover group. When monitoring is temporarily stopped or when server fails before the failover group stops due to system error, the monitor table will not be deleted. It is not an error even if an alert message saying that "a monitor table exists" is displayed next time when monitoring is started.
DB2 may produce operation logs for each monitoring. Configure DB2 settings if this needs to be adjusted.
Selectable monitor level |
Prior creation of a monitor table |
|---|---|
Level 1 (monitoring by select) |
Required |
Level 2 (monitoring by update/select) |
Optional |
Create a monitor table using either of the following methods:
4.23.2. Monitoring by DB2 monitor resources
DB2 monitor resources perform monitoring according to the specified monitoring level.
- Level 1 (monitoring by select)Monitoring with only reference to the monitor table. SQL statements issued to the monitor table are of (select) type.An error is recognized if:
A database connection could not be established
An error message is sent in response to an SQL statement
- Level 2 (monitoring by update/select)Monitoring with reference to and update of the monitoring table. One SQL statement can read/write numerical data of up to 10 digits. At monitoring start/end, the monitor table is created/deleted. SQL statements issued to the monitor table are of (create / update / select / drop) type.An error is recognized if:
A database connection could not be established
An error message is sent in response to an SQL statement
The written data is not the same as the read data
4.23.3. Monitor (special) tab
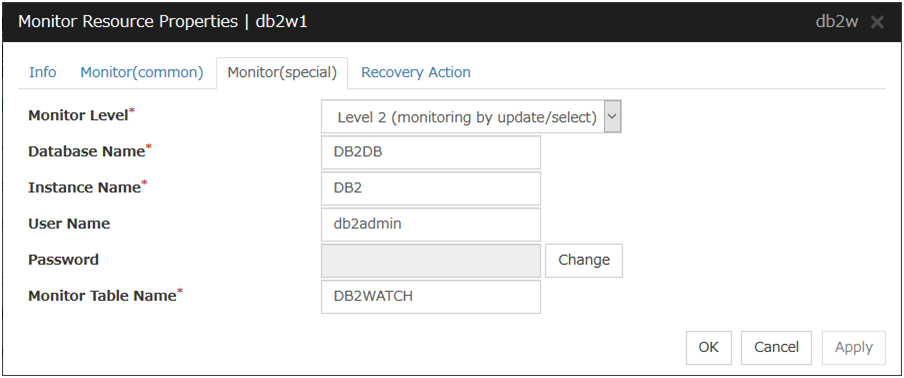
Monitor Level
Select one of the following levels. You cannot omit this level setting.
Default value: Level 2 (monitoring by update/select)
Database Name (Within 255 bytes)
Specify the database to be monitored. You must specify the database.
Default value: None
Instance Name (Within 255 bytes)
Specify the instance name of the database to be monitored. You must specify the instance name.
Default value: DB2
User Name (Within 255 bytes)
Specify the user name to log on to the database.
Default value: db2admin
Password (Within 255 bytes)
Specify the password to log on to the database. Click Change and enter the password in the dialog box.
Default value: None
Monitor Table Name (Within 255 bytes)
Specify the name of a monitor table created on the database. You must specify the name. Make sure not to specify the same name as the table used for operation because a monitor table will be created and deleted. Be sure to set the name different from the reserved word in SQL statements.Some characters cannot be used to specify a monitor table name according to the database specifications. For details, refer to the database specifications.Default value: DB2WATCH
4.24. Understanding FTP monitor resources
FTP monitor resources monitor FTP services that run on the server. FTP monitor resources monitor FTP protocol and they are not intended for monitoring specific applications. FTP monitor resources monitor various applications that use FTP protocol.
4.24.1. FTP monitor resources
For monitoring target resources, specify service resources or script resources that start FTP monitor resources. Monitoring starts after target resource is activated. However, if FTP monitor resources cannot be started immediately after target resource is activated, adjust the time using Wait Time to Start Monitoring.
FTP service may produce operation logs for each monitoring. Configure FTP settings if this needs to be adjusted.
If a change is made to a default FTP message (such as a banner or welcome message) on the FTP server, it may be handled as an error.
With FTPS selected in Protocol, you need to specify the installation path of OpenSSL libraries in the Encryption tab of Cluster Properties. The following OpenSSL library versions support FTPS: OpenSSL 3.0 and OpenSSL 1.1.1.
4.24.2. Monitoring by FTP monitor resources
FTP monitor resources connect to the FTP server and execute the command for acquiring the file list. As a result of monitoring, the following is considered as an error:
When connection to the FTP service fails.
When an error is notified as a response to the command.
4.24.3. Monitor (special) tab
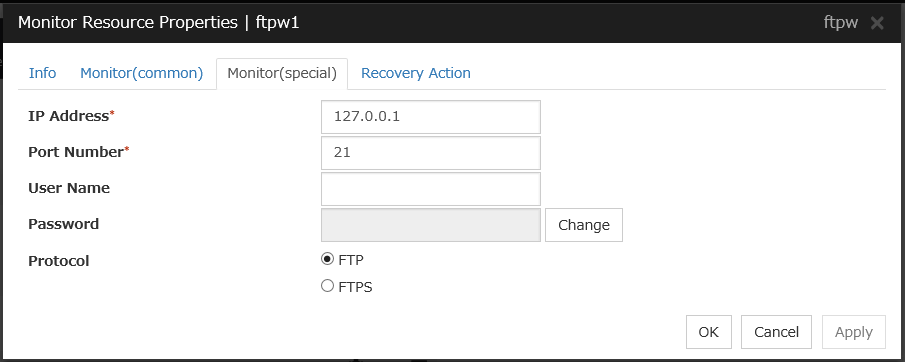
IP Address (Within 255 bytes)
Specify the IP address of the FTP server to be monitored.Usually, specify the loopback address (127.0.0.1) to connect to the FTP server that runs on the local server. If the addresses for which connection is possible are limited by FTP server settings, specify an address for which connection is possible (such as a floating IP address).Default value: 127.0.0.1
Port Number (1 to 65535)
Specify the FTP port number to be monitored. You must specify a port number.
Default value: 21
User Name (Within 255 bytes)
Specify the user name to log on to FTP.
Default value: None
Password (Within 255 bytes)
Specify the password to log on to FTP. Click Change and enter the password in the dialog box.
Default value: None
Protocol
Select a protocol for communication with the FTP server: FTP (in usual cases) or FTPS (with FTP over SSL/TLS connection required).
Default value: FTP
4.25. Understanding HTTP monitor resources
HTTP monitor resources monitor HTTP services that run on the server. HTTP monitor resources monitor HTTP protocol but they are not intended for monitoring specific applications. HTTP monitor resources monitor various applications that implement HTTP protocol.
4.25.1. HTTP monitor resources
For monitoring target resources, specify service resources or script resources that start HTTP services. Monitoring starts after a target resource is activated. However, if HTTP service cannot be started immediately after the target resource is activated, adjust the time using Wait Time to Start Monitoring.
HTTP service may produce operation logs for each monitoring operation. Configure HTTP settings if this needs to be adjusted.
For the DIGEST authentication of HTTP monitor resources, the MD5 algorism is used.
For the client certificate of HTTP monitor resources, IIS can be monitored.
4.25.2. Monitoring by HTTP monitor resources
HTTP monitor resource monitors the following:
Monitors the HTTP daemon by connecting to the HTTP daemon on the server and issuing a HTTP request.
This monitor resource determines the following results as an error:
an error is notified during the connection to the HTTP daemon.
the response message to the HTTP request is not started with "/HTTP"
the status code for the response to the HTTP request is in 400s and 500s (when URI other than the default is specified to the Monitor URI)
4.25.3. Monitor (special) tab
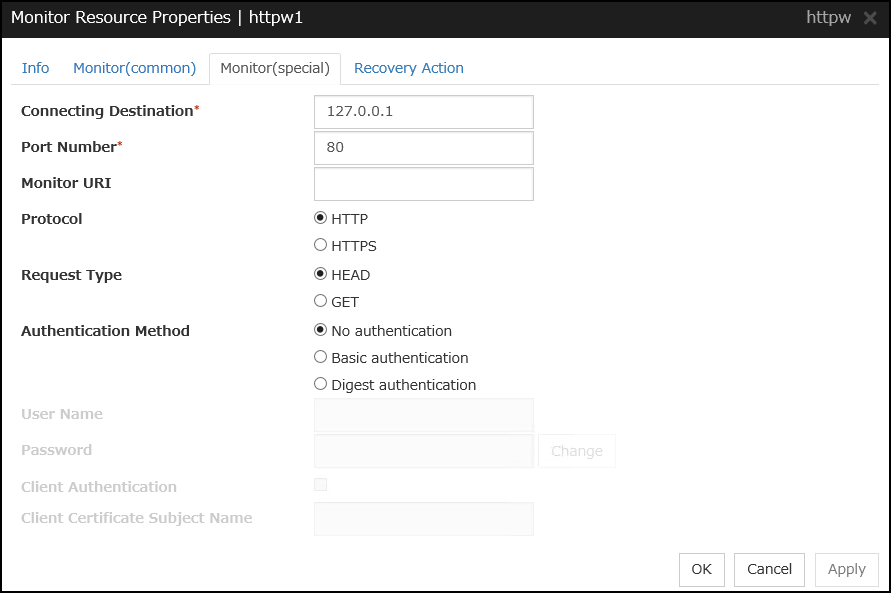
Connecting Destination (Within 255 bytes)
You must specify the IP address of the HTTP server to be monitored and this IP address.Usually, specify the loopback address (127.0.0.1) to connect to the HTTP server that runs on the local server. If the addresses for which connection is possible are limited by HTTP server settings, specify an address for which connection is possible (such as a floating IP address).Default value: 127.0.0.1
Port Number (1 to 65535)
You must specify the port number of the HTTP to be monitored.
Default value:80 (HTTP)443 (HTTPS)
Monitor URI (Within 255 bytes)
Specify the URI of the HTTP to be monitored.
If URI is not specified, the document root is monitored. It is not necessary to create a monitoring page.
If a URI is specified, that URI is monitored. The specified URI needs to allow anonymous access.
Write the following in URI form from the DocumentRoot.
(Example) When the URI of the web page to be monitored is as follows:http://WebServer:80/watch/sample.htm/watch/sample.htmDefault value: None
Protocol
Configure protocol used for communication with HTTP server. In general, HTTP is selected. If you need to connect with HTTP over SSL, select HTTPS.
Note
If you select HTTPS, GET requests are issued regardless of which request type you choose.
Request Type
Specify a type of HTTP request for accessing the HTTP server. Setting this parameter is mandatory.
Default value: HEAD
Authentication Method
Specify an authentication method for connecting to the HTTP server.
Default value: No authentication
User Name (Within 255 bytes)
Set a user name to login to HTTP
Default value: None
Password (Within 255 bytes)
Set a password to login to HTTP
Default value: None
Client Authentication
Enabling this function, which requires selecting HTTPS in Protocol, performs client authentication.
Default value: Disabled
Note
Even if you enable this function for an HTTP server which does not perform client authentication, the operation is not affected.
Client Certificate Subject Name (Within 64 bytes)
Specify the subject name of a client certificate for client authentication. This is required when Client Authentication is enabled.
Note
Based on the subject name specified in Client Certificate Subject Name, the system retrieves the corresponding client certificate stored in Personal of the local computer's certificate store.
Default value: None
4.26. Understanding IMAP4 monitor resources
IMAP4 monitor resources monitor IMAP4 services that run on the server. IMAP4 monitor resources monitor IMAP4 protocol but they are not intended for monitoring specific applications. IMAP4 monitor resources monitor various applications that use IMAP4 protocol.
4.26.1. IMAP4 monitor resources
For monitoring target resources, specify service resources or script resources that start IMAP4 servers. Monitoring starts after target resource is activated. However, if IMAP4 servers cannot be started immediately after a target resource is activated, adjust the time using Wait Time to Start Monitoring.
IMAP4 servers may produce operation logs for each monitoring. Configure IMAP4 servers if this needs to be adjusted.
4.26.2. Monitoring by IMAP4 monitor resources
IMAP4 monitor resources connect to the IMAP4 server and execute the command to verify the operation. As a result of monitoring, the following is considered as an error:
When connection to the IMAP4 server fails.
When an error is notified as a response to the command.
4.26.3. Monitor (special) tab
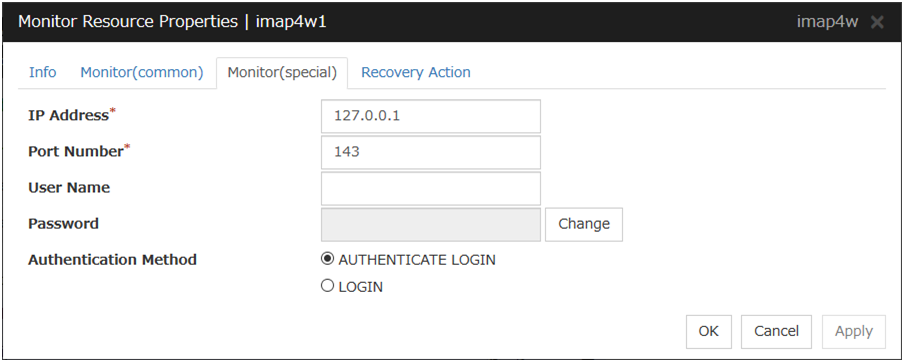
IP Address (Within 255 bytes)
Specify the IP address of the IMAP4 server to be monitored.Usually, specify the loopback address (127.0.0.1) to connect to the IMAP4 server that runs on the local server. If the addresses for which connection is possible are limited by IMAP4 server settings, specify an address for which connection is possible (such as a floating IP address).Default value: 127.0.0.1
Port Number (1 to 65535)
Specify the port number of the IMAP4 to be monitored. You must specify this port number.
Default value: 143
User Name (Within 255 bytes)
Specify the user name to log on to IMAP4.
Default value: None
Password (Within 189 bytes)
Specify the password to log on to IMAP4. Click Change and enter the password in the dialog box.
Default value: None
Authentication Method
Select the authentication method to log on to IMAP4. It must follow the settings of IMAP4 being used:
4.27. Understanding ODBC monitor resources
ODBC monitor resources monitor ODBC database that runs on the server.
4.27.1. ODBC monitor resources
Set the data source using the ODBC data source administrator on Windows because the ODBC driver is used for monitoring. Add the data source to the system data source.
For monitoring target resources, specify service resources or script resources that start the database. Monitoring starts after target resource is activated. However, if the database cannot be started immediately after target resource is activated, adjust the time using Wait Time to Start Monitoring.
A monitor table is created when monitoring is started and it is deleted when monitoring is stopped due to the stop of the failover group. When monitoring is temporarily stopped or when server fails before the failover group stops due to system error, the monitor table will not be deleted. It is not an error even if an alert message saying that "a monitor table exists" is displayed next time when monitoring is started.
ODBC database may produce operation logs for each monitoring. Configure the database settings if this needs to be adjusted.
Selectable monitor level |
Prior creation of a monitor table |
|---|---|
Level 1 (monitoring by select) |
Required |
Level 2 (monitoring by update/select) |
Optional |
Create a monitor table using either of the following methods:
4.27.2. Monitoring by ODBC monitor resources
ODBC monitor resources perform monitoring according to the specified monitoring level.
- Level 1 (monitoring by select)Monitoring with only reference to the monitor table. SQL statements issued to the monitor table are of (select) type.An error is recognized if:
A database connection could not be established
An error message is sent in response to an SQL statement
- Level 2 (monitoring by update/select)Monitoring with reference to and update of the monitoring table. One SQL statement can read/write numerical data of up to 10 digits. At monitoring start/end, the monitor table is created/deleted. SQL statements issued to the monitor table are of (create / update / select / drop) type.An error is recognized if:
A database connection could not be established
An error message is sent in response to an SQL statement
The written data is not the same as the read data
4.27.3. Monitor (special) tab
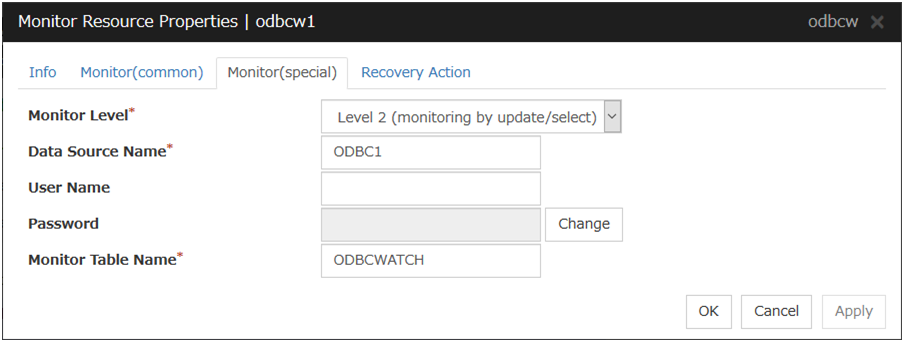
Monitor Level
Select one of the following levels. You cannot omit this level setting.
Default value: Level 2 (monitoring by update/select)
Data Source Name (Within 255 bytes)
Specify the data source name to be monitored. You must specify the name.
Default value: None
User Name (Within 255 bytes)
Specify the user name to log on to the database. You do not have to specify if the user name is specified in the data source settings.
Default value: None
Password (Within 255 bytes)
Specify the password to log on to the database. Click Change and enter the password in the dialog box.
Default value: None
Monitor Table Name (Within 255 bytes)
Specify the name of a monitor table created on the database. You must specify the name. Make sure not to specify the same name as the table used for operation because a monitor table will be created and deleted. Be sure to set the name different from the reserved word in SQL statements.Some characters cannot be used to specify a monitor table name according to the database specifications. For details, refer to the database specifications.Default value: ODBCWATCH
4.28. Understanding Oracle monitor resources
Oracle monitor resources monitor Oracle database that runs on the server.
4.28.1. Oracle monitor resources
For the supported Oracle versions, see "Application supported by the monitoring options" in "System requirements for the EXPRESSCLUSTER Server" in "Installation requirements for EXPRESSCLUSTER" in the "Getting Started Guide".
Interface DLL (OCI.DLL) needs to be installed on the server where monitoring is performed because Oracle OCI is used for monitoring.
For target a monitoring resource, specify a service resource or a script resource that can start Oracle. Monitoring starts after the target resource is activated; however, if the database cannot be started right after the target resource is activated, adjust the time by using Wait Time to Start Monitoring.
A monitor table is created when monitoring is started and it is deleted when monitoring is stopped due to the stop of the failover group. When monitoring is temporarily stopped or when the server fails before the failover group stops due to system error, the monitor table will not be deleted. It is not an error even if an alert message saying that "a monitor table exists" is displayed next time when monitoring is started.
When the OS authentication of a parameter is not selected, normally, the password authentication is used for the Oracle monitor. However, in the following conditions, The OS authentication is used for the Oracle monitor, and the user name and password specified in the parameter are ignored.
SYSDBA is selected for the authentication method of the parameter.
A user with Administrator privileges belongs to the ora_dba group of Windows OS.
The user specified for the user name parameter is sys by default, but when a monitoring-dedicated user has been configured, for each monitor level the following access permissions must be provided for that user (if the sysdba permission is not provided):
Monitor level |
Necessary permissions |
|---|---|
Level 0 (database status) |
SELECT permission for V$PROCESS / SELECT permission for V$INSTANCE |
Level 1 (monitoring by select) |
SELECT permission for V$PROCESS / SELECT permission for a monitor table |
Level 2 (monitoring by update/select) |
SELECT permission for V$PROCESS / CREATE TABLE / DROP ANY TABLE / INSERT permission for a monitor table / UPDATE permission for a monitor table /SELECT permission for a monitor table |
Oracle database may produce operation logs for each monitoring. Configure the Oracle settings if this needs to be adjusted.
Selectable monitor level |
Prior creation of a monitor table |
|---|---|
Level 0 (database status) |
Optional |
Level 1 (monitoring by select) |
Required |
Level 2 (monitoring by update/select) |
Optional |
Create a monitor table using either of the following methods:
*Create this in a schema for the user specified for the user name parameter.
4.28.2. Monitoring by Oracle monitor resources
Oracle monitor resources perform monitoring according to the specified monitor level.
- Level 0 (database status)The Oracle management table (V$INSTANCE table) is referenced to check the DB status (instance status). This level corresponds to simplified monitoring without SQL statements being executed for the monitor table.An error is recognized if:
The Oracle management table (V$INSTANCE table) status is in the inactive state (MOUNTED,STARTED)
The Oracle management table (V$INSTANCE table) database_status is in the inactive state (SUSPENDED,INSTANCE RECOVERY)
- Level 1 (monitoring by select)Monitoring with only reference to the monitor table. SQL statements issued to the monitor table are of (select) type.An error is recognized if:
A database connection could not be established
An error message is sent in response to an SQL statement
- Level 2 (monitoring by update/select)Monitoring with reference to and update of the monitoring table. One SQL statement can read/write numerical data of up to 10 digits. At monitoring start/end, the monitor table is created/deleted. SQL statements issued to the monitor table are of (create / update / select / drop) type.An error is recognized if:
A database connection could not be established
An error message is sent in response to an SQL statement
The written data is not the same as the read data
4.28.3. Monitor (special) tab
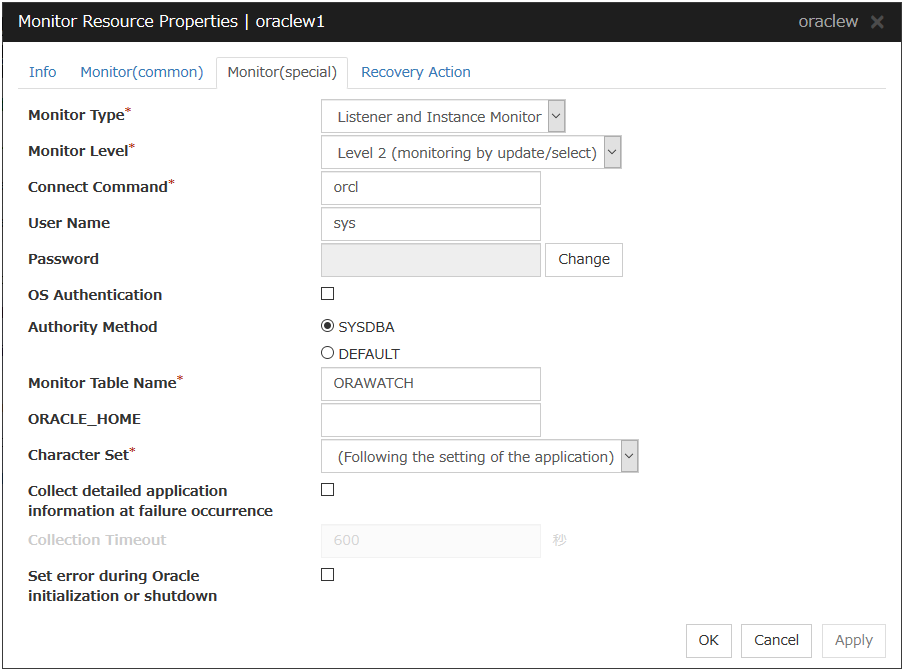
Monitor Type
Select the Oracle features to be monitored.
Default value: Listener and Instance Monitor
Monitor Level
Select one of the following levels. You cannot omit this level setting.
Default value: Level 2 (monitoring by update/select)
Connect String (Within 255 bytes)
Specify the connect string for the database to be monitored. You must specify the connect string.
When Monitor Type is set to Monitor Instance only, set ORACLE_SID.
Monitor Type
ORACLE_HOME
Connect Command
Monitor Level
Listener and Instance Monitor
Need not be specified
Specify the connect string
As specified
Listener Monitor
Monitoring dependent on Oracle command if specified
Specify the connect string
Ignored
Check for connection to the instance through the listener if not specified
Specify the connect string
Ignored
Instance Monitor
Check for the instance by BEQ connection if specified
Specify ORACLE_SID
As specified
Check for the instance through the listener if not specified
Specify the connect string
As specified
Default value: None for the connect string
User Name (Within 255 bytes)
Specify the user name to log on to the database.
Default value: sys
Password (Within 255 bytes)
Specify the password to log on to the database. Click Change and enter the password in the dialog box.
Default value: None
OS Authentication
Specify the authentication method to log on to the Oracle monitor. It must follow the Oracle monitor settings.
Authority Method
Select the user authority to log on to the Oracle monitor. This must be set according to the authority of the specified user name.
Monitor Table Name (Within 255 bytes)
Specify the name of a monitor table created on the database. You must specify the name. Make sure not to specify the same name as the table used for operation because a monitor table will be created and deleted. Be sure to set the name different from the reserved word in SQL statements.Some characters cannot be used to specify a monitor table name according to the database specifications. For details, refer to the database specifications.Default value: ORAWATCH
ORACLE_HOME (Within 255 bytes)
Specify the path name configured in ORACLE_HOME. Begin with [/]. This is used when Monitor Type is set to Monitor Listener only or Monitor Instance only.
Default value: None
Character Set
Select the character set for Oracle.
Collect detailed application information at failure occurrence
Specify whether to collect detailed Oracle information if an Oracle database error is detected.
When using this function, the local system account needs DBA authorization because the database processing for information collection is executed by the local system account. The collected information is saved in work\rm\resource name\errinfo.cur folder under EXPRESSCLUSTER install folder. When collection is executed more than once, the folder names of the past collection information are renamed as errinfo.1, errinfo.2. And the folders are saved by 5 generations from the latest information.
Note
When the oracle service is stopped due to cluster stop or other reasons while collecting, the correct information may not be collected.Do not perform the manual operation such as Group stop or Group move while collecting information. Monitoring process may not work normally depending on the timing of the manual operation.
Collection Timeout (1 to 9999)
Specify the timeout time for collecting detailed information in seconds.
Default value: 600
Set error during Oracle initialization or shutdown
When this function is enabled, a monitor error occurs immediately upon the detection of Oracle initialization or shutdown in progress.
Disable this function when Oracle automatically restarts in cooperation with Oracle Clusterware or the like during operation. Monitoring becomes normal even during Oracle initialization or shutdown.
However, a monitor error occurs if Oracle initialization or shutdown continues for one hour or more.
Default value: Disabled
4.29. Understanding POP3 monitor resources
POP3 monitor resources monitor POP3 services that run on the server. POP3 monitor resources monitor POP3 protocol but they are not intended for monitoring specific applications. POP3 monitor resources monitor various applications that use POP3 protocol.
4.29.1. POP3 monitor resources
For monitoring target resources, specify service resources or script resources that start POP3 services. Monitoring starts after target resource is activated. However, if POP3 services cannot be started immediately after target resource is activated, adjust the time using Wait Time to Start Monitoring.
POP3 services may produce operation logs for each monitoring. Configure the POP3 settings if this needs to be adjusted.
4.29.2. Monitoring by POP3 monitor resources
POP3 monitor resources connect to the POP3 server and execute the command to verify the operation.
As a result of monitoring, the following is considered as an error:
When connection to the POP3 server fails.
When an error is notified as a response to the command.
4.29.3. Monitor (special) tab
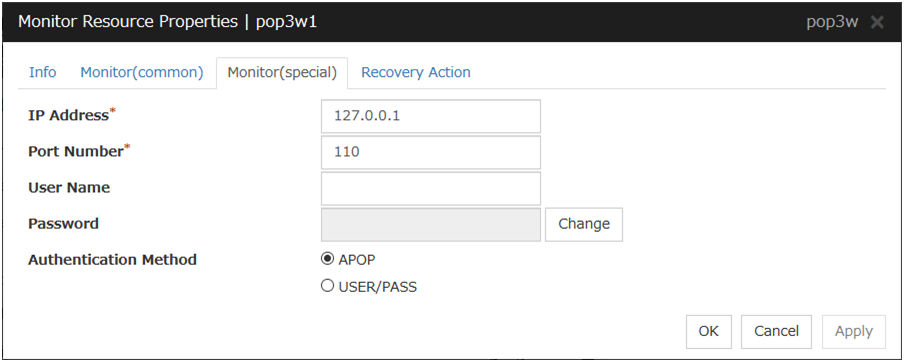
IP Address (Within 255 bytes)
Specify the IP address of the POP3 server to be monitored.Usually, specify the loopback address (127.0.0.1) to connect to the POP3 server that runs on the local server. If the addresses for which connection is possible are limited by POP3 server settings, specify an address for which connection is possible (such as a floating IP address).Default value: 127.0.0.1
Port Number (1 to 65535)
Specify the POP3 port number to be monitored. You must specify this port number.
Default value: 110
User Name (Within 255 bytes)
Specify the user name to log on to POP3.
Default value: None
Password (Within 255 bytes)
Specify the password to log on to POP3. Click Change and enter the password in the dialog box.
Default value: None
Authentication Method
Select the authentication method to log on to POP3. It must follow the settings of POP3 being used:
4.30. Understanding PostgreSQL monitor resources
PostgreSQL monitor resources monitor PostgreSQL database that runs on the server.
4.30.1. PostgreSQL monitor resources
For the supported PostgreSQL/PowerGres versions, see " Application supported by the monitoring options" in "System requirements for the EXPRESSCLUSTER Server" in "Installation requirements for EXPRESSCLUSTER" in the "Getting Started Guide".
Interface DLL (LIBPQ.DLL) needs to be installed on the server where monitoring is performed because PostgreSQL/PowerGres library is used for monitoring. Specify the path of this DLL to the environmental variable when monitoring PostgreSQL.
For a target monitoring resource, specify a service resource or a script resource that can start PostgreSQL/PowerGres. Monitoring starts after the target resource is activated; however, if the database cannot be started right after the target resource is activated, adjust the time by using Wait Time to Start Monitoring.
A monitor table is created when monitoring is started and it is deleted when monitoring is stopped due to the stop of the failover group. When monitoring is temporarily stopped or when server fails before the failover group stops due to system error, the monitor table will not be deleted. It is not an error if an alert message saying that "a monitor table exists" is displayed next time when monitoring is started.
PostgreSQL/PowerGres may produce operation logs for each monitoring. Configure the PostgreSQL/PowerGres settings if this needs to be adjusted.
Because PostgreSQL is open-source software (OSS), its operation is checked but not guaranteed. Make sure to use PostgreSQL after evaluating it by yourself.
If PostgreSQL monitoring is performed, an error indicating that no library can be found may be output depending on the OS and PostgreSQL versions. In this case, add PostgreSQL bin to the PATH of the system environment variable. After that, restart the cluster.
When adding PATH to the environment variable (The following is an example of PATH of PostgreSQL9.6 bin.)
C:\Program Files\PostgreSQL\9.6\bin
When this monitor resource is used, messages like those shown below are output to a log on the PostgreSQL side. These messages are output by the monitor processing and do not indicate any problems.
YYYY-MM-DD hh:mm:ss JST moodle moodle LOG: statement: DROP TABLE psqlwatch
YYYY-MM-DD hh:mm:ss JST moodle moodle ERROR: table "psqlwatch" does not exist
YYYY-MM-DD hh:mm:ss JST moodle moodle STATEMENT: DROP TABLE psqlwatch
YYYY-MM-DD hh:mm:ss JST moodle moodle LOG: statement: CREATE TABLE psqlwatch (num INTEGER NOT NULL PRIMARY KEY)
YYYY-MM-DD hh:mm:ss JST moodle moodle NOTICE: CREATE TABLE / PRIMARY KEY will create implicit index "psqlwatch_pkey" for table "psql watch"
YYYY-MM-DD hh:mm:ss JST moodle moodle LOG: statement: DROP TABLE psqlwatch
Selectable monitor level |
Prior creation of a monitor table |
|---|---|
Level 1 (monitoring by select) |
Required |
Level 2 (monitoring by update/select) |
Optional |
Create a monitor table using either of the following methods:
4.30.2. Monitoring by PostgreSQL monitor resources
PostgreSQL monitor resources perform monitoring according to the specified monitor level.
- Level 1 (monitoring by select)Monitoring with only reference to the monitor table. SQL statements issued to the monitor table are of (select) type.An error is recognized if:
A database connection could not be established
An error message is sent in response to an SQL statement
- Level 2 (monitoring by update/select)Monitoring with reference to and update of the monitoring table. One SQL statement can read/write numerical data of up to 10 digits. At monitoring start/end, the monitor table is created/deleted. SQL statements issued to the monitor table are of ( create / update / select / reindex / drop / vacuum ) type.An error is recognized if:
A database connection could not be established
An error message is sent in response to an SQL statement
The written data is not the same as the read data
4.30.3. Monitor (special) tab
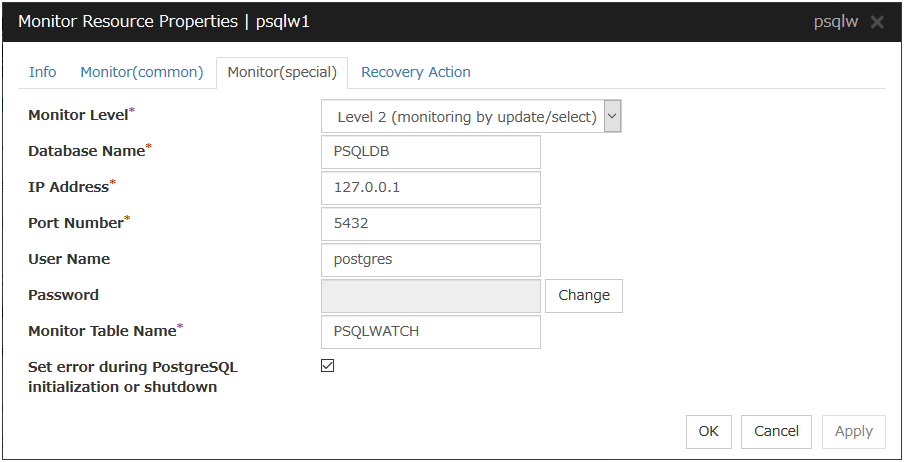
Monitor Level
Select one of the following levels. You cannot omit this level setting.
Default value: Level 2 (monitoring by update/select)
Database Name (Within 255 bytes)
Specify the database name to be monitored. You must specify the name.
Default value: None
IP Address
Specify the IP address of the database server to be monitored.
Default value: 127.0.0.1
Port Number
Specify the PostgreSQL port number to be monitored. You must specify this port number.
Default value: 5432
User Name (Within 255 bytes)
Specify the user name to log on to the database.
Default value: postgres
Password (Within 255 bytes)
Specify the password to log on to the database. Click Change and enter the password in the dialog box.
Default value: None
Monitor Table Name (Within 255 bytes)
You must specify the name of a monitor table created in the database. Make sure not to specify the same name as the table used for operation because a monitor table will be created and deleted. Be sure to set the name different from the reserved word in SQL statements.
Some characters cannot be used to specify a monitor table name according to the database specifications. For details, refer to the database specifications.
Default value: PSQLWATCH
Set error during PostgreSQL initialization or shutdown
When this function is enabled, a monitor error occurs immediately upon the detection of PostgreSQL initialization or shutdown in progress. When this function is disabled, monitoring becomes normal even during PostgreSQL initialization or shutdown. However, a monitor error occurs if PostgreSQL initialization or shutdown continues for one hour or more.
Default value: Disabled
4.31. Understanding SMTP monitor resources
SMTP monitor resources monitor SMTP services that run on the server. SMTP monitor resources monitor SMTP protocol but they are not intended for monitoring specific applications. SMTP monitor resources monitor various applications that use SMTP protocol.
4.31.1. SMTP monitor resources
For monitoring target resources, specify service resources or script resources that start SMTP. Monitoring starts after target resource is activated. However, if the database cannot be started immediately after target resource is activated, adjust the time using Wait Time to Start Monitoring.
SMTP services may produce operation logs for each monitoring. Configure the SMTP settings if
4.31.2. Monitoring by SMTP monitor resources
POP3 monitor resources connect to the POP3 server and execute the command to verify the operation.
As a result of monitoring, the following is considered as an error:
When connection to the SMTP server fails.
When an error is notified as a response to the command.
4.31.3. Monitor (special) tab
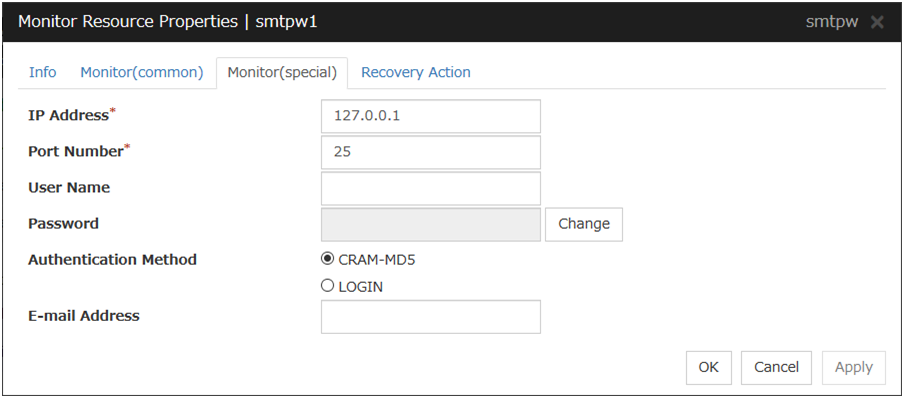
IP Address
You must specify the IP address of the SMTP server to be monitored.
Default value: 127.0.0.1
Port Number
Specify the port number of the SMTP to be monitored. You must specify this port number.
Default value: 25
User Name (Within 255 bytes)
Specify the user name to log on to SMTP. If no user name is specified, SMTP authentication is not performed.
Default value: None
Password (Within 255 bytes)
Specify the password to log on to SMTP. Click Change and enter the password in the dialog box.
Default value: None
Authentication Method
Select the authentication method to log on to the SMTP. It must follow the settings of SMTP being used:
E-mail Address (Within 255 bytes)
Specify the email address used for monitoring. If nothing is specified, monitoring is performed using the command to verify the operation. The command that uses a dummy e-mail address is executed internally. If an email address is specified, monitoring is performed by running SMTP command to the specified e-mail address and verifying the result of it. It is recommended to have an e-mail address dedicated to monitoring.
Default value: None
4.32. Understanding SQL Server monitor resources
SQL Server monitor resources monitor SQL Server database that runs on the server.
4.32.1. SQL Server monitor resources
For the supported SQL Server versions, see "Application supported by the monitoring options" in "System requirements for the EXPRESSCLUSTER Server" in "Installation requirements for EXPRESSCLUSTER" in the "Getting Started Guide".
For target monitoring resource, specify a service resource that can start SQL Server. Monitoring starts after the target resource is activated; however, if the database cannot be started right after the target resource is activated, adjust the time by using Wait Time to Start Monitoring.
A monitor table is created when monitoring is started and it is deleted when monitoring is stopped due to the stop of the failover group. When monitoring is temporarily stopped or when server fails before the failover group stops due to system error, the monitor table will not be deleted. It is not an error if an alert message saying that "a monitor table exists" is displayed next time when monitoring is started.
SQL Server may produce operation logs for each monitoring. Configure the SQL Server settings if this needs to be adjusted.
Selectable monitor level |
Prior creation of a monitor table |
|---|---|
Level 0 (database status) |
Optional |
Level 1 (monitoring by select) |
Required |
Level 2 (monitoring by update/select) |
Optional |
Create a monitor table using either of the following methods:
(In the following example, the monitor table is named SQLWATCH)
When SET IMPLICIT_TRANSACTIONS is OFF:
sql> create table SQLWATCH (num int not null primary key)sql> gosql> insert into SQLWATCH values(0)sql> goWhen SET IMPLICIT_TRANSACTIONS is ON:
sql> create table SQLWATCH (num int not null primary key)sql> gosql> insert into SQLWATCH values(0)sql> gosql> commitsql> go
4.32.2. Monitoring by SQL Server monitor resources
SQL Server monitor resources perform monitoring according to the specified monitor level.
- Level 0 (database status)The SQL Server management table is referenced to check the DB status. This level corresponds to simplified monitoring without SQL statements being executed for the monitor table.An error is recognized if:
The database status is not online
- Level 1 (monitoring by select)Monitoring with only reference to the monitor table. SQL statements issued to the monitor table are of (select) type.An error is recognized if:
A database connection could not be established
An error message is sent in response to an SQL statement
- Level 2 (monitoring by update/select)Monitoring with reference to and update of the monitoring table. One SQL statement can read/write numerical data of up to 10 digits. At monitoring start/end, the monitor table is created/deleted. SQL statements issued to the monitor table are of (create / update / select / drop) type.An error is recognized if:
A database connection could not be established
An error message is sent in response to an SQL statement
The written data is not the same as the read data
4.32.3. Monitor (special) tab
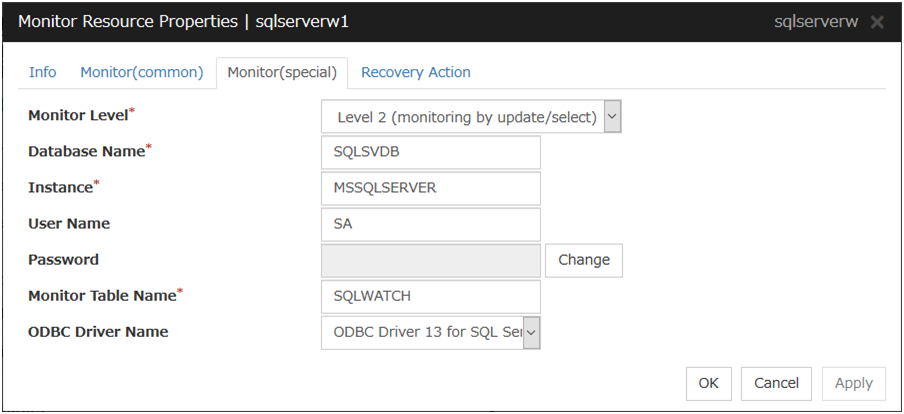
Monitor Level
Select one of the following levels. You cannot omit this level setting.
Default value: Level 2 (monitoring by update/select)
Database Name (Within 255 bytes)
Specify the database name to be monitored. You must specify the name.
Default value: None
Instance Name (Within 255 bytes)
Specify the database instance name. You must specify the instance name.
Default value: MSSQLSERVER
User Name (Within 255 bytes)
Specify the user name to log on to the database. If the user name is not specified, Windows authentication is used.
Default value: SA
Password (Within 255 bytes)
Specify the password to log on to the database. Click Change and enter the password in the dialog box.
Default value: None
Monitor Table Name (Within 255 bytes)
Specify the name of a monitor table created on the database. You must specify the name. Make sure not to specify the same name as the table used for operation because a monitor table will be created and deleted. Be sure to set the name different from the reserved word in SQL statements.
Some characters cannot be used to specify a monitor table name according to the database specifications. For details, refer to the database specifications.
Default value: SQLWATCH
ODBC Driver Name (Within 255 bytes)
Specify the driver name of the target database shown in the Driver tab when you click Start -> Administrative Tools -> Data Sources (ODBC).Select SQL Server Native Client 11.0 in SQL Server 2014.Select ODBC Driver 13 for SQL Server in SQL Server 2016 or SQL Server 2017.Select ODBC Driver 17 for SQL Server in SQL Server 2019.Default value: ODBC Driver 13 for SQL Server
4.33. Understanding Tuxedo monitor resources
Tuxedo monitor resources monitor Tuxedo that runs on the server.
4.33.1. Tuxedo monitor resources
For the supported Tuxedo versions, see "Application supported by the monitoring options" in "System requirements for the EXPRESSCLUSTER Server" in "Installation requirements for EXPRESSCLUSTER" in the "Getting Started Guide".
For target monitoring resource, specify a script resource and application resource that can start Tuxedo. Monitoring starts after the target resource is activated; however, if Tuxedo cannot be started right after the target resource is activated, adjust the time by using Wait Time to Start Monitoring.
Tuxedo may produce operation logs for each monitoring. Configure the Tuxedo settings if this needs to be adjusted.
4.33.2. Monitoring by Tuxedo monitor resources
Tuxedo monitor resources connect to the Tuxedo and execute API to verify the operation. As a result of monitoring, the following is considered as an error:
When an error is reported during the connection to the application server and/or the acquisition of the status.
4.33.3. Monitor (special) tab
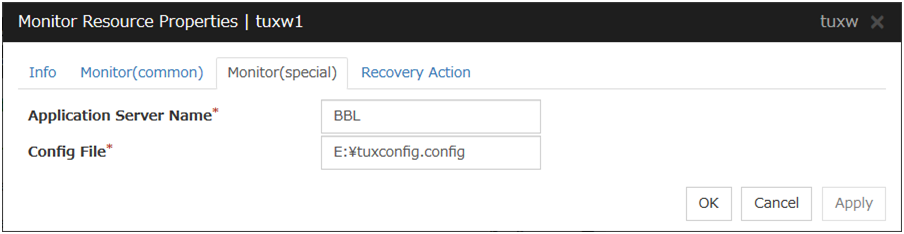
Application Server Name (Within 255 bytes)
Specify the application server name to be monitored. You must specify the name.
Default value: BBL
Config File (Within 1023 bytes)
Specify the placement file name of Tuxedo. You must specify the name.
Default value: None
4.34. Understanding WebSphere monitor resources
WebSphere monitor resources monitor WebSphere that runs on the server.
4.34.1. WebSphere monitor resources
For the supported WebSphere versions, see "Application supported by the monitoring options" in "System requirements for the EXPRESSCLUSTER Server" in "Installation requirements for EXPRESSCLUSTER" in the "Getting Started Guide".
For target monitoring resource, specify a service resource that can start WebSphere. Monitoring starts after the target resource is activated; however, if the database cannot be started right after the target resource is activated, adjust the time by using Wait Time to Start Monitoring.
A Java Runtime Environment is required to start monitoring with this command. The application server system uses Java functions. Therefore if Java stalls, it may be recognized as an error.
WebSphere may produce operation logs for each monitoring. Configure the WebSphere settings if this needs to be adjusted.
4.34.2. Monitoring by WebSphere monitor resources
WebSphere monitor resources use the serverStatus.bat command to verify the operation.
As a result of monitoring, the following is considered as an error:
When an error is reported with the state of the acquired application server.
4.34.3. Monitor (special) tab
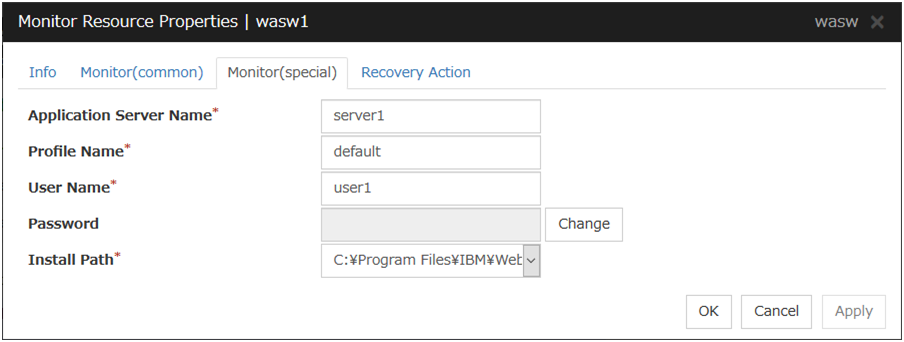
Application Server Name (Within 255 bytes)
Specify the application server name to be monitored. You must specify the name.
Default value: server1
Profile Name (Within 1023 bytes)
Specify the profile name of WebSphere. You must specify the name.
Default value: default
User Name (Within 255 bytes)
Specify the user name of WebSphere. You must specify the name.
Default value: None
Password (Within 255 bytes)
Specify the password of WebSphere. You must specify the password.
Default value: None
Install Path (Within 255 bytes)
Specify the installation path of WebSphere. You must specify the path.
Default value: C:\Program Files\IBM\WebSphere\AppServer
4.35. Understanding WebLogic monitor resources
WebLogic monitor resources monitor WebLogic that runs on the server.
4.35.1. WebLogic monitor resources
For the supported WebLogic versions, see "Application supported by the monitoring options" in "System requirements for the EXPRESSCLUSTER Server" in "Installation requirements for EXPRESSCLUSTER" in the "Getting Started Guide".
If WebLogic cannot run immediately after startup, it is recognized as an error. To prevent this, adjust Wait Time to Start Monitoring. Or, make sure that WebLogic starts first (for example, by specifying the script resource and the application resources that start WebLogic as the monitor target resource).
If the selected monitoring method is WLST for this monitor resource, the monitoring requires a Java environment. Since the Java functions are used by the application server system, a stall of Java (if any) may be recognized as an error.
WebLogic may produce operation logs for each monitoring. Configure the WebLogic settings if this needs to be adjusted.
4.35.2. Monitoring by WebLogic monitor resources
WebLogic monitor resource monitors the following:
Monitoring method: if RESTful API is selected
WebLogic offers RESTful APIs called WebLogic RESTful management services.
The RESTful APIs allow you to monitor the application server.
As a result, an error is considered to be found if:
There is an error message in response to the RESTful API.
Note
Compared with the WLST monitoring method, RESTful API can reduce the CPU load of the application server under the monitoring.
Monitoring method: if WLST is selected
Monitors the application server by performing connect with the "weblogic.WLST" command.
This monitor resource determines the following results as an error:
An error reporting as the response to the connect.
The operations are as follows, based on Authentication Method.
DemoTrust: SSL authentication method using authentication files for demonstration of WebLogic
CustomTrust: SSL authentication method using user-created authentication files
Not Use SSL: SSL authentication method is not used.
4.35.3. Monitor (special) tab
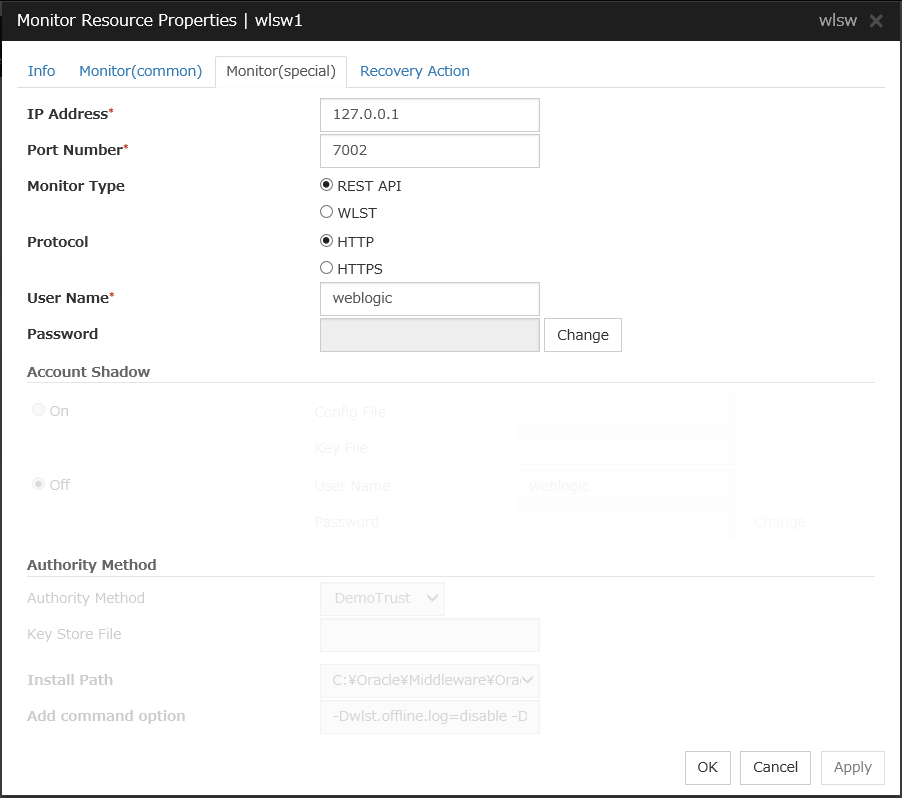
IP Address (Within 79 bytes)
Specify the IP address of the server to be monitored. You must specify the IP address.
Default value: 127.0.0.1
Port (1 to 65535)
Specify the port number used to connect to the server. You must specify the number.
Default value: 7002
Monitor Method
Specify the method of monitoring the server. Setting this parameter is mandatory.
Default value: RESTful API
Protocol
Specify the protocol of the server to be monitored. Setting this parameter is mandatory if RESTful API is selected in Monitor Method.
Default value: HTTP
User Name (Within 255 bytes)
Specify the name of the WebLogic user. Setting this parameter is mandatory if RESTful API is selected in Monitor Method.
Default value: weblogic
Password (Within 255 bytes)
Specify the password for WebLogic, if necessary, with RESTful API selected in Monitor Method.
Default value: None
Account Shadow
When you specify a user name and a password directly, select Off. If not, select On. You must specify the setting.
Default value: Off
Config File (Within 1023 bytes)
Specify the file in which the user information is saved. You must specify the file if Account Shadow is On.
Default value: None
Key File (Within 1023 bytes)
Specify the file in which the password required to access to a config file path is saved. Specify the full path of the file. You must specify the file if Account Shadow is On.
Default value: None
User Name (Within 255 bytes)
Specify the user name of WebLogic. You must specify the file if Account Shadow is Off.
Default value: weblogic
Password (Within 255 bytes)
Specify the password of WebLogic.
Default value: None
Authority Method
Specify the authentication method when connecting to an application server. You must specify the method.
Specify DemoTrust or Custom Trust for Authority Method, in order to execute monitoring by using the SSL communication.
It is determined whether to use DemoTrust or CustomTrust, according to the setting of WebLogic Administration Console.
When Keystores of WebLogic Administration Console is set to Demo Identity and Demo Trust, specify Demo Trust. In this case, you do not need to make settings for Key Store File.
When Keystores of WebLogic Administration Console is set to Custom Identity and Custom Trust, specify Custom Trust. In this case, you need to make settings for Key Store File.
Default value: DemoTrust
Key Store File (Within 1023 bytes)
Specify the authentication file when authenticating SSL. You must specify this when the Authority Method is CustomTrust. Set the file specified in Custom Identity Key Store File on WebLogic Administration Console.
Default value: None
Install Path (Within 255 bytes)
Specify the installation path of WebLogic. You must specify the path.
Default value: C:\Oracle\Middleware\Oracle_Home\wlserver
Add command option (Within 1023 bytes)
Set this value when changing the option to be passed to the webLogic.WLST command.
Default value: -Dwlst.offline.log=disable -Duser.language=en_US
4.36. Understanding WebOTX monitor resources
WebOTX monitor resources monitor WebOTX that runs on the server.
4.36.1. WebOTX monitor resources
For the supported WebOTX versions, see "Application supported by the monitoring options" in "System requirements for the EXPRESSCLUSTER Server" in "Installation requirements for EXPRESSCLUSTER" in the "Getting Started Guide".
For target monitoring resource, specify a script resource that can start WebOTX. Monitoring starts after the target resource is activated; however, if WebOTX cannot be started right after the target resource is activated, adjust the time by using Wait Time to Start Monitoring.
A Java environment is required to start monitoring with this command. The application server system uses Java functions. Therefore if Java stalls, it may be recognized as an error.
WebOTX may produce operation logs for each monitoring. Configure the WebOTX settings if this needs to be adjusted.
WebOTX monitor resource monitors application servers by using the otxadmin.bat command which Web OTX offers. ${AS_INSTALL}\bin where the otxadmin.bat command is arranged is not included in environment variable PATH any more in WebOTX V10.1 or later. When monitoring WebOTX V10.1 or later, configure either of the following settings.
Add the path where otxadmin.bat command is located to the system environment variable, PATH.
Set the install path of WebOTX Application Server to Install Path. (e.g. C:\WebOTX)
4.36.2. Monitoring by WebOTX monitor resources
WebOTX monitor resources use the otxadmin.bat command to verify the operation. As a result of monitoring, the following is considered as an error:
When an error is reported with the state of the acquired application server.
4.36.3. Monitor (special) tab
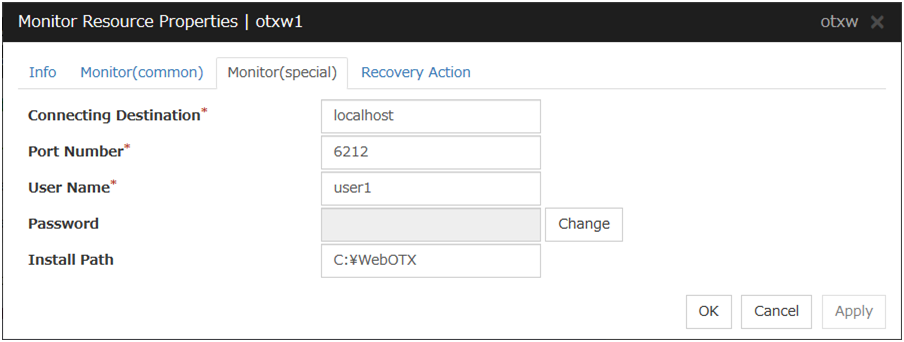
Connecting Destination (Within 255 bytes)
Specify the server name of the server to be monitored. You must specify the name.
Default value: localhost
Port Number (1 to 65535)
Specify the port number used to connect to the server. You must specify the number.
When monitoring a WebOTX user domain, specify the management port number for the WebOTX domain. The management port number is the number which was set for "domain.admin.port" of <domain_name>.properties when the domain was created. Refer to the WebOTX documents for details of <domain_name>.properties
Default value: 6212
User Name (Within 255 bytes)
Specify the user name of WebOTX. You must specify the name.
When monitoring a WebOTX user domain, specify the login user name for the WebOTX domain.
Default value: None
Password (Within 255 bytes)
Specify the password of WebOTX.
Default value: None
Install Path (Within 1023 bytes)
Specify the install path of WebOTX Application Server. You must configure this setting when monitoring WebOTX Application Server V10.1 or later.
Default value: None
4.37. Understanding JVM monitor resources
JVM monitor resources monitor information about the utilization of resources that are used by Java VM or an application server running on a server.
4.37.1. Note on JVM monitor resources
The Java installation path on the JVM monitor tab of Cluster Properties must be set before adding JVM monitor resource.
For a target resource, specify an application server running on Java VM such as WebLogic Server or WebOTX. As soon as the JVM monitor resource has been activated, the Java Resource Agent starts monitoring, but if the target (WebLogic Server or WebOTX) cannot start running immediately after the activation of the JVM monitor resource, use Wait Time to Start Monitoring to compensate.
The setting of Monitor (common) tab-Retry Count is invalid. When you'd like to delay error detection, please change the setting of Cluster Properties-JVM monitor tab-Resource Measurement Settings [Common]-Retry Count.
The status of the JVM monitor resource is "Warning" from when monitoring is started to when the monitoring processing is actually performed.
4.37.2. Monitoring by JVM monitor resources
JVM monitor resource monitors the following:
Monitors application server by using JMX (Java Management Extensions).
The monitor resource determines the following results as errors:
Target Java VM or application server cannot be connected
The value of the used amount of resources obtained for the Java VM or application server exceeds the user-specified threshold a specified number of times (error decision threshold) consecutively
As a result of monitoring, an error is regarded as having been solved if:
The value falls below the threshold when restarting the monitoring after the recovery action.
Note
Collect Cluster Logs in the Cluster WebUI does not handle the configuration file and log files of the target (WebLogic or WebOTX).
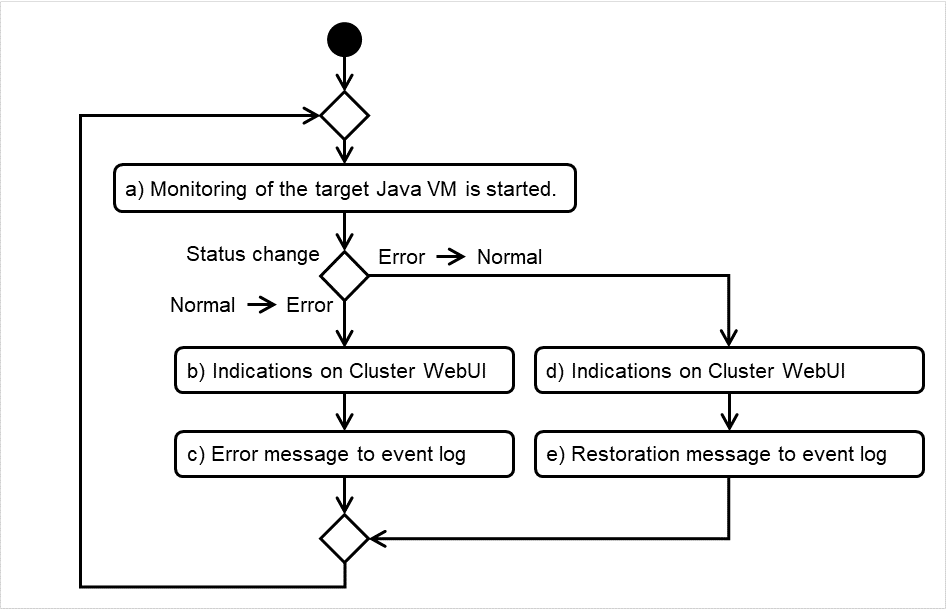
Fig. 4.63 Flow of monitoring by a JVM monitor resource
The standard operations when the threshold is exceeded are as described below.
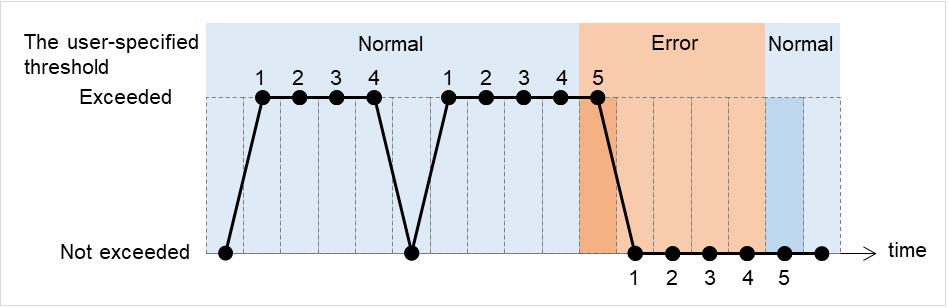
Fig. 4.64 Behavior when the threshold is exceeded
The operations performed if an error persists are as described below.
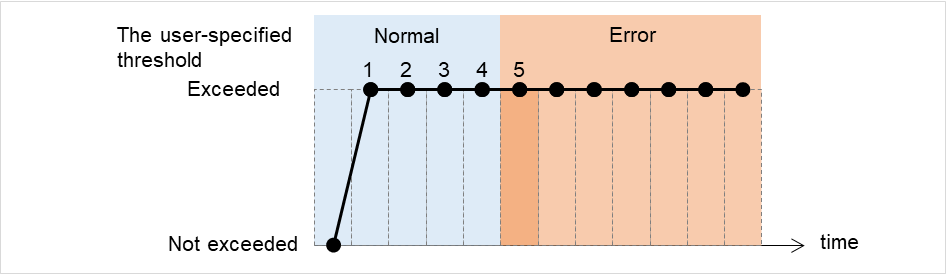
Fig. 4.65 Behavior when an error persists
The following example describes the case of monitoring Full GC (Garbage Collection).In the following figure, the horizontal axis indicates a lapse of time.The upper part of the figure illustrates whether the GC occurrence is detected at each timing of monitoring; the lower part shows how many times Full GC is consecutively detected at each point of time.If a count of the consecutive Full GC occurrence reaches a specified value, the JVM monitor resource considers it as an error.In this case, the error threshold is set at five. Therefore, when the count reaches five, an error is considered to occur.Full GC has a significant influence on the system, thus the recommended error threshold is 1 time.
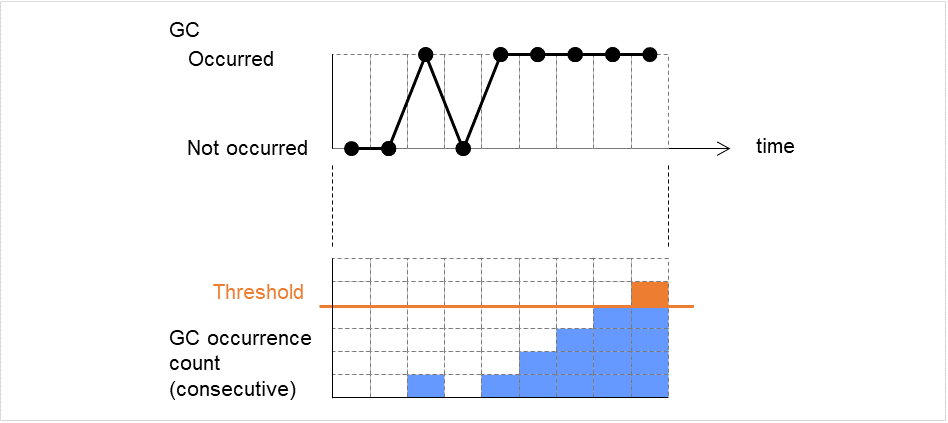
Fig. 4.66 Image of monitoring (when the error threshold is set at five)
4.37.3. JVM statistical log
JVM monitor resources collect statistical information on the monitor target Java VM. The information is stored on CSV-format files, JVM statistical logs. The file is created in the following location:
<EXPRESSCLUSTER_install_path>\log\ha\jra\*.stat
The following "monitor items" refer to parameters in the [Monitor(special)] tab in the [Properties] of the JVM monitor resources.
Statistical information is collected and output to its corresponding JVM statistical log when an item is selected and the threshold value is set for the item. If a monitor item is not selected, statistical information on the item will be neither collected nor output to its corresponding JVM statistical log.
The following table lists monitor items and their corresponding JVM statistical logs.
Monitor items |
Corresponding JVM statistical log |
|---|---|
[Memory] tab - [Monitor Heap Memory Rate]
[Memory] tab - [Monitor Non-Heap Memory Rate]
[Memory] tab-[Monitor Heap Memory Usage]
[Memory] tab -[Monitor Non-Heap Memory Usage]
|
jramemory.stat |
[Thread] tab - [Monitor the number of Active Threads] |
jrathread.stat |
[GC] tab - [Monitor the time in Full GC]
[GC] tab - [Monitor the count of Full GC execution]
|
jragc.stat |
[WebLogic] tab - [Monitor the requests in Work Manager]
[WebLogic] tab - [Monitor the requests in Thread Pool]
When either of the above monitor items is checked, both of the logs, such as wlworkmanager.stat and wlthreadpool.stat, are output. No functions to output only one of the two logs are provided.
|
wlworkmanager.stat
wlthreadpool.stat
|
4.37.4. Java memory area usage check on monitor target Java VM (jramemory.stat)
The jramemory.stat log file records the size of the Java memory area used by the monitor target Java VM. Its file name becomes either of the following two depending on the Rotation Type selected on the Log Output Setting dialog box.
When [Cluster Properties] - [JVM monitor] tab - [Log Output Setting] - [Rotation Type] - [File Capacity] is checked: jramemory<integer starting with 0>.stat
When [Cluster Properties] - [JVM monitor] tab - [Log Output Setting] - [Rotation Type] - [Period] is checked: jramemory<YYYYMMDDhhmm>.stat
Its data formats are as follows.
No |
Format |
Description |
|---|---|---|
1 |
yyyy/mm/dd hh:mm:ss.SSS |
Date and time of log recording |
2 |
Half-size alphanumeric characters and symbols |
Name of the monitor target Java VM; it has been specified in [Properties] - [Monitor(special)] tab - [Identification name] in JVM monitor resources. |
3 |
Half-size alphanumeric characters and symbols |
Name of the Java memory pool; for details, refer to "Java memory pool name". |
4 |
Half-size alphanumeric characters and symbols |
Type of the Java memory pool
Heap, Non-Heap
|
5 |
Half-size numeric characters |
Memory size that the Java VM requests from the OS at startup; it is expressed in bytes. (init)
At the startup of the monitor target Java VM, the size can be specified by the following Java VM startup options.
- HEAP:-Xms
- NON_HEAP permanent area (Perm Gen): -XX:PermSize
- NON_HEAP code cache area (Code Cache): -XX:InitialCodeCacheSize
|
6 |
Half-size numeric characters |
Memory size currently used by the Java VM; it is expressed in bytes. (used) |
7 |
Half-size numeric characters |
Memory size guaranteed for current use in operation of the Java VM; it is expressed in bytes. (committed)
This size varies depending on memory use; it is always equal to the value of "used" or larger but equal to the value of "max" or smaller.
|
8 |
Half-size numeric characters |
Maximum memory size that the Java VM can use; it is expressed in bytes. (max)
The size can be specified by the following Java VM startup options.
- HEAP:-Xmx
- NON_HEAP permanent area (Perm Gen): -XX:MaxPermSize
- NON_HEAP code cache area (Code Cache): -XX:ReservedCodeCacheSize
Example)
java -XX:MaxPermSize=128m -XX:ReservedCodeCacheSize=128m javaAP
In this example, max of NON_HEAP becomes 128 m + 128 m = 256 m.
(Note)
When the same value is specified for -Xms and -Xmx, "ini" may become larger than "max". This is because "max" of HEAP is determined by subtracting half the size of Survivor Space from the area size ensured by specification of -Xmx.
|
9 |
Half-size numeric characters |
Peak size of the memory used after startup of the measurement target Java VM; when the name of the Java memory pool is HEAP or NON_HEAP, this size becomes equal to that of the memory currently used by the Java VM (used). It is expressed in bytes. |
10 |
Half-size numeric characters |
Ignore when Oracle Java (usage monitoring) is selected for JVM Type.
When an item other than Oracle Java (usage monitoring) is selected for JVM Type, Memory size equal to "max" (No. 8 field) *the threshold (%) when the Java memory pool type (No. 4 field) is HEAP; it is expressed in bytes.
When the Java memory pool type is not HEAP, it is 0.
|
4.37.5. Thread operation status check on monitor target Java VM (jrathread.stat)
The jrathread.stat log file records the thread operation status of the monitor target Java VM. Its file name becomes either of the following two depending on the Rotation Type selected on the Log Output Setting dialog box.
When [Cluster Properties] - [JVM monitor] tab - [Log Output Setting] - [Rotation Type] - [File Capacity] is checked: jrathread<integer starting with 0>.stat
When [Cluster Properties] - [JVM monitor] tab - [Log Output Setting] - [Rotation Type] - [Period] is checked: jrathread<YYYYMMDDhhmm>.stat
Its data formats are as follows.
No |
Format |
Description |
|---|---|---|
1 |
yyyy/mm/dd hh:mm:ss.SSS |
Date and time of log recording |
2 |
Half-size alphanumeric characters and symbols |
Name of the monitor target Java VM; it has been specified in [Properties] - [Monitor(special)] tab - [Identification name] in JVM monitor resources. |
3 |
Half-size alphanumeric characters and symbols |
The number of active threads in the monitor target Java VM |
4 |
[Half-size numeric characters: half-size numeric characters:...] |
Deadlocked thread ID in the monitor target Java VM; it contains the IDs of all deadlocked threads successively. |
5 |
Half-size alphanumeric characters and symbols |
Detailed information on deadlocked threads in the monitor target Java VM; it contains information on all deadlocked threads successively in the following format.
ThreadName, ThreadID, ThreadStatus, UserTime, CpuTime, WaitedCount, WaitedTime, isInNative, isSuspended <line feed>
stacktrace<line feed>
stacktrace<line feed>
stacktrace=ClassName, FileName, LineNumber, MethodName, isNativeMethod
|
4.37.6. GC operation status check on monitor target Java VM (jragc.stat)
The jragc.stat log file records the GC operation status of the monitor target Java VM. Its file name becomes either of the following two depending on the Rotation Type selected on the Log Output Setting dialog box.
When [Cluster Properties] - [JVM monitor] tab - [Log Output Setting] - [Rotation Type]-[File Capacity] is checked: jragc< integer starting with 0>.stat
When [Cluster Properties] - [JVM monitor] tab - [Log Output Setting] - [Rotation Type] - [Period] is checked: jragc<YYYYMMDDhhmm>.stat
JVM monitor resources output two types of GC information: Copy GC and Full GC.
On Oracle Java, JVM monitor resources count the increment in the count of execution of the following GC as Full GC.
MarksweepCompact
MarkSweepCompact
PS Marksweep
ConcurrentMarkSweep
Its data formats are as follows.
No |
Format |
Description |
|---|---|---|
1 |
yyyy/mm/dd hh:mm:ss.SSS |
Date and time of log recording |
2 |
Half-size alphanumeric characters and symbols |
Name of the monitor target Java VM; it has been specified in [Properties] - [Monitor(special)] tab - [Identification name] in JVM monitor resources. |
3 |
Half-size alphanumeric characters and symbols |
GC name of the monitor target Java VM
When the monitor target Java VM is Oracle Java
The GC name to be indicated is one of the following.
Copy
MarksweepCompact
MarkSweepCompact
PS Scavenge
PS Marksweep
ParNew
ConcurrentMarkSweep
|
4 |
Half-size numeric characters |
Count of GC execution during the period from startup of the monitor target Java VM to measurement; the count includes GC executed before the JVM monitor resources starts monitoring. |
5 |
Half-size numeric characters |
Total time in GC during the period from startup of the monitor target Java VM to measurement; it is expressed in milliseconds. It includes time taken for GC executed before the JVM monitor resources starts monitoring. |
4.37.7. Operation status check on Work Manager of WebLogic Server (wlworkmanager.stat)
The wlworkmanager.stat log file records the operation status of the Work Manager of the WebLogic Server. Its file name becomes either of the following two depending on the Rotation Type selected on the Log Output Setting dialog box.
When [Cluster Properties] - [JVM monitor] tab - [Log Output Setting] - [Rotation Type] - [File Capacity] is checked: wlworkmanager<integer starting with 0>.stat
When [Cluster Properties] - [JVM monitor] tab - [Log Output Setting] - [Rotation Type] - [Period] is checked: wlworkmanager<YYYYMMDDhhmm>.stat
Its data formats are as follows.
No |
Format |
Description |
|---|---|---|
1 |
yyyy/mm/dd hh:mm:ss.SSS |
Date and time of log recording |
2 |
Half-size alphanumeric characters and symbols |
Name of the monitor target Java VM; it has been specified in [Properties] - [Monitor(special)] tab - [Identification name] in JVM monitor resources. |
3 |
Half-size alphanumeric characters and symbols |
Application name |
4 |
Half-size alphanumeric characters and symbols |
Work Manager name |
5 |
Half-size numeric characters |
Count of request execution |
6 |
Half-size numeric characters |
The number of wait requests |
4.37.8. Operation status check on Thread Pool of WebLogic Server (wlthreadpool.stat)
The wlthreadpool.stat log file records the operation status of the thread pool of the WebLogic Server. Its file name becomes either of the following two depending on the Rotation Type selected on the Log Output Setting dialog box.
When [Cluster Properties] - [JVM monitor] tab - [Log Output Setting] - [Rotation Type] - [File Capacity] is checked:wlthreadpool< integer starting with 0>.stat
When [Cluster Properties] - [JVM monitor] tab - [Log Output Setting] - [Rotation Type] - [Period] is checked: wlthreadpool<YYYYMMDDhhmm>.stat
Its data formats are as follows.
No |
Format |
Description |
|---|---|---|
1 |
yyyy/mm/dd hh:mm:ss.SSS |
Date and time of log recording |
2 |
Half-size alphanumeric characters and symbols |
Name of the monitor target Java VM; it has been specified in [Properties] - [Monitor(special)] tab - [Identification name] in JVM monitor resources. |
3 |
Half-size numeric characters |
Total count of request execution |
4 |
Half-size numeric characters |
The number of requests queued in the WebLogic Server |
5 |
Half-size numeric characters |
Count of request execution per unit time (second) |
6 |
Half-size numeric characters |
The total number of threads for executing the application |
7 |
Half-size numeric characters |
The number of threads in an idle state |
8 |
Half-size numeric characters |
The number of executing threads |
9 |
Half-size numeric characters |
The number of threads in a stand-by state |
4.37.9. Java memory pool name
This section describes the Java memory pool name outputted as memory_name in messages to the JVM operation log file. It also describes the Java memory pool name outputted to a JVM statistical log file, jramemory.stat log file.
The character strings of Java memory pool names are not determined by JVM monitor resources. Character strings received from the monitor target Java VM are output as Java memory pool names.
Their specifications are not open for Java VM, and accordingly, are subject to change without notice in a version upgrade of Java VM.
Therefore, we do not recommend monitoring Java memory pool names contained in messages.
The following monitor items refer to parameters in the [Memory] tab of the [Monitor(special)] tab in the [Properties] of the JVM monitor resources.
The following memory pool names have been confirmed on actual machines operating on Oracle Java.
When Oracle Java is selected for JVM Type, and "-XX:+UseSerialGC" is specified as a startup option of the monitor target Java VM, the No. 3 Java memory pool name in the jramemory.stat log file appears as follows.
Monitor item |
Character string outputted as memory_name |
|---|---|
[Monitor Heap Memory Rate] - [Total Usage] |
HEAP |
[Monitor Heap Memory Rate] - [Eden Space] |
Eden Space |
[Monitor Heap Memory Rate] - [Survivor Space] |
Survivor Space |
[Monitor Heap Memory Rate] - [Tenured Gen] |
Tenured Gen |
[Monitor Non-Heap Memory Rate] - [ Total Usage] |
NON_HEAP |
[Monitor Non-Heap Memory Rate] - [Code Cache] |
Code Cache |
[Monitor Non-Heap Memory Rate] - [Perm Gen] |
Perm Gen |
[Monitor Non-Heap Memory Rate] - [Perm Gen[shared-ro]] |
Perm Gen [shared-ro] |
[Monitor Non-Heap Memory Rate] - [Perm Gen[shared-rw]] |
Perm Gen [shared-rw] |
When Oracle Java is selected for JVM Type, and "-XX:+UseParallelGC" and "-XX:+UseParallelOldGC" are specified as startup options of the monitor target Java VM, the No. 3 Java memory pool name in the jramemory.stat log file appears as follows.
Monitor item |
Character string outputted as memory_name |
|---|---|
[Monitor Heap Memory Rate] - [Total Usage] |
HEAP |
[Monitor Heap Memory Rate] - [Eden Space] |
PS Eden Space |
[Monitor Heap Memory Rate] - [Survivor Space] |
PS Survivor Space |
[Monitor Heap Memory Rate] - [Tenured Gen] |
PS Old Gen |
[Monitor Non-Heap Memory Rate] - [Total Usage] |
NON_HEAP |
[Monitor Non-Heap Memory Rate] - [Code Cache] |
Code Cache |
[Monitor Non-Heap Memory Rate] - [Perm Gen] |
PS Perm Gen |
[Monitor Non-Heap Memory Rate] - [Perm Gen[shared-ro]] |
Perm Gen [shared-ro] |
[Monitor Non-Heap Memory Rate] - [Perm Gen[shared-rw]] |
Perm Gen [shared-rw] |
When Oracle Java is selected for JVM Type, and "-XX:+UseConcMarkSweepGC" is specified as a startup option of the monitor target Java VM, the No. 3 Java memory pool name in the jramemory.stat log file appears as follows.
Monitor item |
Character string outputted as memory_name |
|---|---|
[Monitor Heap Memory Rate] - [Total Usage] |
HEAP |
[Monitor Heap Memory Rate] - [Eden Space] |
Par Eden Space |
[Monitor Heap Memory Rate] - [Survivor Space] |
Par Survivor Space |
[Monitor Heap Memory Rate] - [Tenured Gen] |
CMS Old Gen |
[Monitor Non-Heap Memory Rate] - [Total Usage] |
NON_HEAP |
[Monitor Non-Heap Memory Rate] - [Code Cache] |
Code Cache |
[Monitor Non-Heap Memory Rate] - [Perm Gen] |
CMS Perm Gen |
[Monitor Non-Heap Memory Rate] - [Perm Gen[shared-ro]] |
Perm Gen [shared-ro] |
[Monitor Non-Heap Memory Rate] - [Perm Gen[shared-rw]] |
Perm Gen [shared-rw] |
When [Oracle Java(usage monitoring)] is selected for [JVM Type] and "-XX:+UseSerialGC" is specified as a startup option for the monitor target Java VM, the No. 3 Java memory pool name in the jramemory.stat file will be as follows.
Monitor item |
Character string output as memory_name |
|---|---|
[Monitor Heap Memory Usage]-[Total Usage] |
HEAP |
[Monitor Heap Memory Usage]-[Eden Space] |
Eden Space |
[Monitor Heap Memory Usage]-[Survivor Space] |
Survivor Space |
[Monitor Heap Memory Usage]-[Tenured Gen] |
Tenured Gen |
[Monitor Non-Heap Memory Usage]-[Total Usage] |
NON_HEAP |
[Monitor Non-Heap Memory Usage]-[Code Cache] |
Code Cache(For Java 9 or later, no output) |
[Monitor Non-Heap Memory Usage]-[Metaspace] |
Metaspace |
[Monitor Non-Heap Memory Usage]-[CodeHeap non-nmethods] |
CodeHeap non-nmethods |
[Monitor Non-Heap Memory Usage]-[CodeHeap profiled] |
CodeHeap profiled nmethods |
[Monitor Non-Heap Memory Usage]-[CodeHeap non-profiled] |
CodeHeap non-profiled nmethods |
[Monitor Non-Heap Memory Usage]-[Compressed Class Space] |
Compressed Class Space |
When [Oracle Java(usage monitoring)] is selected for [JVM Type] and "-XX:+UseParallelGC" is specified as a startup option for the monitor target Java VM, the No. 3 Java memory pool name in the jramemory.stat file will be as follows.
Monitor item |
Character string output as memory_name |
|---|---|
[Monitor Heap Memory Usage]-[Total Usage] |
HEAP |
[Monitor Heap Memory Usage]-[Eden Space] |
PS Eden Space |
[Monitor Heap Memory Usage]-[Survivor Space] |
PS Survivor Space |
[Monitor Heap Memory Usage]- [Tenured Gen] |
PS Old Gen |
[Monitor Non-Heap Memory Usage]-[Total Usage] |
NON_HEAP |
[Monitor Non-Heap Memory Usage]-[Code Cache] |
Code Cache(For Java 9 or later, no output) |
[Monitor Non-Heap Memory Usage]- [Metaspace] |
Metaspace |
[Monitor Non-Heap Memory Usage]-[CodeHeap non-nmethods] |
CodeHeap non-nmethods |
[Monitor Non-Heap Memory Usage]-[CodeHeap profiled] |
CodeHeap profiled nmethods |
[Monitor Non-Heap Memory Usage]-[CodeHeap non-profiled] |
CodeHeap non-profiled nmethods |
[Monitor Non-Heap Memory Usage]-[Compressed Class Space] |
Compressed Class Space |
When [Oracle Java(usage monitoring)] is selected for [JVM Type] and "-XX:+UseParNewGC" is specified as a startup option for the monitor target Java VM, the No. 3 Java memory pool name in the jramemory.stat file will be as follows. For Java 9 or later, if -XX:+UseParNewGC is specified, the monitor target Java VM does not start.
Monitor item |
Character string output as memory_name |
|---|---|
[Monitor Heap Memory Usage]-[Total Usage] |
HEAP |
[Monitor Heap Memory Usage]-[Eden Space] |
Par Eden Space |
[Monitor Heap Memory Usage]-[Survivor Space] |
Par Survivor Space |
[Monitor Non-Heap Memory Usage]-[Tenured Gen] |
Tenured Gen |
[Monitor Non-Heap Memory Usage]-[Total Usage] |
NON_HEAP |
[Monitor Non-Heap Memory Usage]-[Code Cache] |
Code Cache |
[Monitor Non-Heap Memory Usage]-[ Metaspace] |
Metaspace |
[Monitor Non-Heap Memory Usage]-[CodeHeap non-nmethods] |
CodeHeap non-nmethods |
[Monitor Non-Heap Memory Usage]-[CodeHeap profiled] |
CodeHeap profiled nmethods |
[Monitor Non-Heap Memory Usage]-[CodeHeap non-profiled] |
CodeHeap non-profiled nmethods |
[Monitor Non-Heap Memory Usage]-[Compressed Class Space] |
Compressed Class Space |
When [Oracle Java(usage monitoring)] is selected for [JVM Type] and "-XX::+UseG1GC" is specified as a startup option for the monitor target Java VM the No. 3 Java memory pool name in the jramemory.stat file will be as follows.
Monitor item |
Character string output as memory_name |
|---|---|
[Monitor Heap Memory Usage]-[Total Usage] |
HEAP |
[Monitor Heap Memory Usage]-[Eden Space] |
G1 Eden Space |
[Monitor Heap Memory Usage]-[Survivor Space] |
G1 Survivor Space |
[Monitor Heap Memory Usage]-[ Tenured Gen(Old Gen)] |
G1 Old Gen |
[Monitor Non-Heap Memory Usage]-[Total Usage] |
NON_HEAP |
[Monitor Non-Heap Memory Usage]-[Code Cache] |
Code Cache(For Java 9 or later, no output) |
[Monitor Non-Heap Memory Usage]-[ Metaspace] |
Metaspace |
[Monitor Non-Heap Memory Usage]-[CodeHeap non-nmethods] |
CodeHeap non-nmethods |
[Monitor Non-Heap Memory Usage]-[CodeHeap profiled] |
CodeHeap profiled nmethods |
[Monitor Non-Heap Memory Usage]-[CodeHeap non-profiled] |
CodeHeap non-profiled nmethods |
[Monitor Non-Heap Memory Usage]-[Compressed Class Space] |
Compressed Class Space |
Java memory pool names appearing in the jramemory.stat log file, a JVM statistical log file, correspond to the Java VM memory space as follows.
For Oracle Java 8/Oracle Java 9/Oracle Java 11/Oracle Java 17
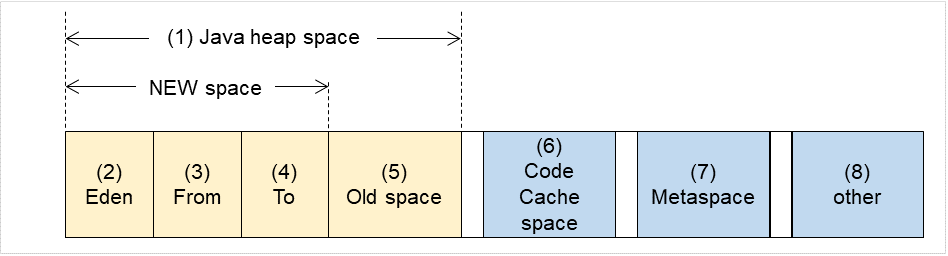
Fig. 4.67 Java VM memory space (Oracle Java 8/Oracle Java 9/Oracle Java 11/Oracle Java 17)
Number in diagram |
Monitor item |
Java memory pool name in jramemory.stat log file |
|---|---|---|
(1) |
[Monitor Heap Memory Usage] - [Total Usage] |
HEAP |
(2) |
[Monitor Heap Memory Usage] - [Eden Space] |
EdenSpace
PS Eden Space
Par Eden Space
G1 Eden Space
|
(3)+(4) |
[Monitor Heap Memory Usage] - [Survivor Space] |
Survivor Space
PS Survivor Space
Par Survivor Space
G1 Survivor Space
|
(5) |
[Monitor Heap Memory Usage] - [Tenured Gen] |
Tenured Gen
PS Old Gen
G1 Old Gen
|
(6) |
[Monitor Non-Heap Memory Usage] - [Code Cache] |
Code Cache (For Java 9 or later, no output) |
(6) |
[Monitor Non-Heap Memory Usage]-[CodeHeap non-nmethods] |
CodeHeap non-nmethods (Only for Java 9 or later, it is output.) |
(6) |
[Monitor Non-Heap Memory Usage]-[CodeHeap profiled] |
CodeHeap profiled nmethods (Only for Java 9 or later, it is output.) |
(6) |
[Monitor Non-Heap Memory Usage]-[CodeHeap non-profiled] |
CodeHeap non-profiled nmethods (Only for Java 9 or later, it is output.) |
(7) |
[Monitor Non-Heap Memory Usage] - [Metaspace] |
Metaspace |
(8) |
[Monitor Non-Heap Memory Usage]-[Compressed Class Space] |
Compressed Class Space |
(6)+(7)+(8) |
[Monitor Non-Heap Memory Usage] - [Total Usage] |
NON_HEAP |
4.37.10. Executing command corresponding to cause of each detected error
EXPRESSCLUSTER does not provide means for executing specific commands according to the causes of detected monitor resource errors.
JVM monitor resources can execute specific commands according to error causes. If an error is detected, JVM monitor resources will execute an appropriate command.
The following setting items specify commands that will be executed according to error causes.
Error cause |
Setting item |
|---|---|
- Failure in connection to the monitor target Java VM
- Failure in resource measurement
|
[Monitor(special)] tab - [Command] |
- Heap memory rate
- Non-heap memory rate
- Heap memory usage
- Non-heap memory usage
|
[Monitor(special)] tab - [Tuning] properties - [Memory] tab - [Command] |
- The number of active threads |
[Monitor(special)] tab - [Tuning] properties - [Thread] tab - [Command] |
- Time in Full GC
- Count of Full GC execution
|
[Monitor(special)] tab - [Tuning] properties - [GC] tab - [Command] |
- Requests in Work Manager of WebLogic
- Requests in Thread Pool of WebLogic
|
[Monitor(special)] tab - [Tuning] properties - [WebLogic] tab - [Command] |
A [Command] passes the detail of an error cause as the arguments of a command with the arguments attached to the end of the [Command]. A Command further specialized for dealing with specific error causes can be defined by designing and specifying a script etc. for a [Command]. The following character strings are passed as the arguments.
When multiple character strings are stated as possible arguments, one of them will be passed according to the CG type of the monitor target Java VM. For the details of their differences, refer to "Java memory pool name".
Statements "(For Oracle Java)" suggest that different character strings are used according to the JVM type. When no such statement is contained, the same character strings will be equally used for all JVM types.
Details of error causes |
Character string for argument |
|---|---|
- Failure in connection to the monitor target Java VM
- Failure in resource measurement
|
No character string defined |
[Monitor(special)] tab - [Tuning] properties - [Memory] tab - [Monitor Memory Heap Rate] - [Total Usage]
(For Oracle Java)
|
HEAP |
[Memory] tab - [Monitor Memory Heap Rate] - [Eden Space]
(For Oracle Java)
|
EdenSpace
PSEdenSpace
ParEdenSpace
|
[Memory] tab - [Monitor Memory Heap Rate] - [Survivor Space]
(For Oracle Java)
|
SurvivorSpace
PSSurvivorSpace
ParSurvivorSpace
|
[Memory] tab - [Monitor Memory Heap Rate] - [Tenured Gen]
(For Oracle Java)
|
TenuredGen
PSOldGen
CMSOldGen
|
[Memory] tab - [Monitor Non-Heap Memory Rate] - [ Total Usage]
(For Oracle Java)
|
NON_HEAP |
[Memory] tab - [Monitor Memory Non-Heap Rate] - [Code Cache]
(For Oracle Java)
|
CodeCache |
[Memory] tab - [Monitor Memory Non-Heap Rate] - [Perm Gen]
(For Oracle Java)
|
PermGen
PSPermGen
CMSPermGen
|
[Memory] tab - [Monitor Memory Non-Heap Rate] - [Perm Gen[shared-ro]]
(For Oracle Java)
|
PermGen[shared-ro]
|
[Memory] tab - [Monitor Memory Non-Heap Rate] - [Perm Gen[shared-rw]]
(For Oracle Java)
|
PermGen[shared-rw] |
[Memory] tab - [Monitor Heap Memory Usage] - [Total Usage] (for Oracle Java(usage monitoring)) |
HEAP |
[Memory] tab - [Monitor Heap Memory Usage] - [Eden Space] (for Oracle Java(usage monitoring)) |
EdenSpace
PSEdenSpace
ParEdenSpace
G1EdenSpace
|
[Memory] tab - [Monitor Heap Memory Usage]-[Survivor Space] (for Oracle Java(usage monitoring)) |
SurvivorSpace
PSSurvivorSpace
ParSurvivorSpace
G1SurvivorSpace
|
[Memory] tab - [Monitor Heap Memory Usage] - [Tenured Gen] (for Oracle Java(usage monitoring)) |
TenuredGen
PSOldGen
CMSOldGen
G1OldGen
|
[Memory] tab - [Monitor Non-Heap Memory Usage] - [Total Usage] (for Oracle Java(usage monitoring)) |
NON_HEAP |
[Memory] tab - [Monitor Non-Heap Memory Usage] - [Code Cache] (for Oracle Java(usage monitoring)) |
CodeCache |
[Memory] tab - [Monitor Non-Heap Memory Usage] - [Metaspace] (for Oracle Java(usage monitoring)) |
Metaspace |
[Memory] tab - [Monitor Non-Heap Memory Usage]-[CodeHeap non-nmethods] (when Oracle Java (usage monitoring) is selected) |
non-nmethods |
[Memory] tab - [Monitor Non-Heap Memory Usage]-[CodeHeap profiled] (when Oracle Java (usage monitoring) is selected) |
profilednmethods |
[Memory] tab - [Monitor Non-Heap Memory Usage]-[CodeHeap non-profiled] (when Oracle Java (usage monitoring) is selected) |
non-profilednmethods |
[Memory] tab - [Monitor Non-Heap Memory Usage]-[Compressed Class Space] (when Oracle Java (usage monitoring) is selected) |
CompressedClassSpace |
[Thread] tab - [Monitor the number of Active Threads] |
Count |
[GC] tab - [Monitor the time in Full GC] |
Time |
[GC] tab - [Monitor the count of Full GC execution] |
Count |
[WebLogic] tab - [Monitor the requests in Work Manager] - [Waiting Requests, The number] |
WorkManager_PendingRequests |
[WebLogic] tab - [Monitor the requests in Thread Pool] - [ Waiting Requests, The number] |
ThreadPool_PendingUserRequestCount |
[WebLogic] tab - [ Monitor the requests in Thread Pool] - [Executing Requests, The number] |
ThreadPool_Throughput |
The following are examples of execution.
Example 1)
Setting item |
Setting information |
|---|---|
[Monitor(special)] tab - [Tuning] properties - [GC] tab - [Command] |
c:\Program Files\bin\downcmd |
[Monitor(special)] tab - [Tuning] properties - [GC] tab - [Monitor the count of Full GC execution] |
1 |
[Cluster] properties - [JVM monitor] tab - [Resource Measurement Setting] - [Common] tab - [Error Threshold] |
3 |
If Full GC is executed successively as many times as specified by the Error Threshold (three times), JVM monitor resources will detect a monitor error and execute a command corresponding to "c:\Program Files\bin\downcmd Cont".
Example 2)
Setting item |
Setting information |
|---|---|
[Monitor(special)] tab - [Tuning] properties - [GC] tab - [Command] |
"c:\Program Files\bin\downcmd" GC |
[Monitor(special)] tab - [Tuning] properties - [GC] tab - [ Monitor the time in Full GC] |
65536 |
[Cluster] properties - [JVM monitor] tab - [Resource Measurement Setting] - [Common] tab - [Error Threshold] |
3 |
If the time in Full GC exceeds 65535 milliseconds successively as many times as specified by the Error Threshold (three times), JVM monitor resources will detect a monitor error and execute a command corresponding to "c:\Program Files\bin\downcmd GC Time".
Example 3)
Setting item |
Setting information |
|---|---|
[Monitor(special)] tab - [Tuning] properties - [Memory] tab - [Command] |
"c:\Program Files\bin\downcmd" memory |
[Monitor(special)] tab - [Tuning] properties - [Memory] tab - [Monitor Heap Memory Rate] |
On |
[Monitor(special)] tab - [Tuning] properties - [Memory] tab - [Eden Space] |
80 |
[Monitor(special)] tab - [Tuning] properties - [Memory] tab - [Survivor Space] |
80 |
[Cluster] properties - [JVM monitor] tab - [Resource Measurement Setting] - [Common] tab - [Error Threshold] |
3 |
If the usage rate of the Java Eden Space and that of the Java Survivor Space exceed 80% successively as many times as specified by the Error Threshold (three times), JVM monitor resources will detect a monitor error and execute a command corresponding to "c:\Program Files\bin\downcmd memory EdenSpace SurvivorSpace".
Timeout (second) for waiting for the completion of execution of the command specified by the [Command] is set by specifying the [Command Timeout] in the [JVM monitor] of the [Cluster Properties] window. The same value is applied to the timeout of the [Command] of each of the above-mentioned tabs; the timeout cannot be specified for each [Command] separately.
If a timeout occurs, the system will not perform processing for forced termination of the [Command] process; the operator needs to perform post-processing (e.g. forced termination) of the [Command] process. When a timeout occurs, the following message is output to the JVM operation log:
action thread execution did not finish. action is alive = <command>
Note the following cautions.
No [Command] is executed when restoration of the Java VM to normal operation (error -> normal operation) is detected.
A [Command] is executed upon detection of an error of the Java VM (when threshold crossing occurs successively as many times as specified by the error threshold). It is not executed at each threshold crossing.
Note that specifying a [Command] on multiple tabs allows multiple commands to be executed if multiple errors occur simultaneously, causing a large system load.
A [Command] may be executed twice simultaneously when the following two items are monitored: [Monitor(special)] tab - [Tuning] properties - [WebLogic] tab - [Monitor the requests in Work Manager] - [Waiting Requests, The Number]; [Monitor(special)] tab - [Tuning] properties - [WebLogic] tab - [Monitor the requests in Work Manager] - [Waiting Requests, Average].
This is because errors may be detected simultaneously on the following two items: [Cluster] properties - [JVM monitor] tab - [Resource Measurement Setting] - [WebLogic] tab - [Interval, The number of request]; [Cluster] properties - [JVM monitor] tab - [Resource Measurement Setting] - [WebLogic] tab - [Interval, The average number of the request]. To avoid this phenomenon, specify only one of the two items as a monitor target. This applies to the following combinations of monitor items.
[Monitor(special)] tab - [Tuning] properties - [WebLogic] tab - [Monitor the requests in Thread Pool] - [Waiting Requests, The Number] and [Monitor(special)] tab - [Tuning] properties - [WebLogic] tab - [Monitor the requests in Thread Pool] - [Waiting Requests, Average]
[Monitor(special)] tab - [Tuning] properties - [WebLogic] tab - [Monitor the requests in Thread Pool] - [Executing Requests, The Number] and [Monitor(special)] tab - [Tuning] properties - [WebLogic] tab - [Monitor the requests in Thread Pool] - [Executing Requests, Average]
4.37.11. Monitoring WebLogic Server
For how to start the operation of the configured target WebLogic Server as an application server, see the manual for WebLogic Server.
This section describes only the settings required for monitoring by the JVM monitor resource.
- Start WebLogic Server Administration Console.For how to start WebLogic Server Administration Console, refer to "Overview of Administration Console" in the WebLogic Server manual.Select Domain Configuration-Domain-Configuration-General. Make sure that Enable Management Port is unchecked.
Select Domain Configuration-Server, and then select the name of the server to be monitored. Set the selected server name as the identifier on the Monitor(special) tab from Properties that can be selected in the config mode of Cluster WebUI.
Regarding the target server, select Configuration-General, and then check the port number though which a management connection is established with Listen Port.
Stop WebLogic Server. For how to stop WebLogic Server, refer to "Starting and stopping WebLogic Server" in the WebLogic Server manual.
Open the script for starting the WebLogic Server managing server (startWebLogic.cmd).
Write the following instructions in the script.
When the target is the WebLogic Server managing server:
set JAVA_OPTIONS=%JAVA_OPTIONS%
-Dcom.sun.management.jmxremote.port=n
-Dcom.sun.management.jmxremote.ssl=false
-Dcom.sun.management.jmxremote.authenticate=false
-Djavax.management.builder.initial=weblogic.management.jmx.mbeanserver.WLSMBeanServerBuilder
*Write each line of coding on one line.
Note
For n, specify the number of the port used for monitoring. The specified port number must be different from that of the listen port for the target Java VM. If there are other target WebLogic Server entities on the same machine, specify a port number different from those for the listening port and application ports of the other entities.
When the target is a WebLogic Server managed server:
if "%SERVER_NAME%" == "SERVER_NAME"(
set JAVA_OPTIONS=%JAVA_OPTIONS%
-Dcom.sun.management.jmxremote.port=n
-Dcom.sun.management.jmxremote.ssl=false
-Dcom.sun.management.jmxremote.authenticate=false
-Djavax.management.builder.initial=weblogic.management.jmx.mbeanserver.WLSMBeanServerBuilder
)
*Write all the if statement lines on one line.
Note
For SERVER_NAME, specify the name of the target server confirmed by Select Target Server. If more than one server is targeted, change the server name on the settings (line 1 to 6) for each server.
Note
Place the above addition prior to the following coding:
%JAVA_HOME%\bin\java %JAVA_VM% %MEM_ARGS%
-Dweblogic.Name=%SERVER_NAME%
-Djava.security.policy=%WL_HOME%\server\lib\weblogic.policy %JAVA_OPTIONS
% %PROXY_SETTINGS% %SERVER_CLASS%
*Write the above coding on one line.
* The contents of the above arguments may differ depending on the WebLogic version. In such a case, write JAVA_OPTIONS in the script before executing java.
- If monitoring a request of work manager and thread pool, configure the following settings:Start WLST (wlst.cmd) of the target WebLogic Server.To do this, select Start menu-Oracle WebLogic-WebLogic Server <version number>-Tools-WebLogic Scripting Tool.On the prompt window displayed, execute the following commands.
>connect('USERNAME','PASSWORD','t3://SERVER_ADDRESS:SERVER_PORT')
> edit()
> startEdit()
> cd('JMX/DOMAIN_NAME')
> set('PlatformMBeanServerUsed','true')
> activate()
> exit()
Replace the USERNAME, PASSWORD, SERVER_ADDRESS, SERVER_PORT, and DOMAIN_NAME with those for the domain environment.
Restart the target WebLogic Server.
4.37.12. Monitoring WebOTX
This section describes how to configure a target WebOTX to enable monitoring by the JVM monitor resource.
Start the WebOTX Administration Console. For how to start the WebOTX Administration Console, refer to "Starting the console" in the WebOTX Operation (Web Administration Console).
The settings differ depending on whether a Java process of the JMX agent running on WebOTX or the Java process of a process group is to be monitored. Configure the settings according to the target of monitoring.
4.37.13. Monitoring a Java process of the WebOTX domain agent
There is no need to specify any settings.
4.37.14. Monitoring a Java process of a WebOTX process group
Connect to the domain by using the administration console.
In the tree view, select <domain_name>-TP System-Application Group-<application_group_name>-Process Group-<process_group_name>.
For the Other Arguments attributes on the JVM Options tab on the right, specify the following Java options on one line. For n, specify the port number. If there is more than one Java VM to be monitored on the same machine, specify a unique port number. The port number specified for the settings is specified with Cluster WebUI (Monitor Resource Properties - Monitor(special) tab - Connection Port).
-Dcom.sun.management.jmxremote.port=n
-Dcom.sun.management.jmxremote.ssl=false
-Dcom.sun.management.jmxremote.authenticate=false
-Djavax.management.builder.initial=com.nec.webotx.jmx.mbeanserver.JmxMBeanServerBuilder
* In the case of WebOTX V9.2 or later, it is unnecessary to specify -Djavax.management.builder.initial.
Then, click Update. After the configuration is completed, restart the process group.
These settings can be made by using Java System Properties, accessible from the Java System Properties tab of the WebOTX administration console. When making these settings by using the console, do not designate "-D" and set the strings prior to "=" in "name" and set the strings subsequent to "=" in "value".
Note
If restart upon a process failure is configured as a function of the WebOTX process group, and when the process group is restarted as the recovery processing by EXPRESSCLUSTER, the WebOTX process group may fail to function correctly. For this reason, when monitoring the WebOTX process group, make the following settings for the JVM monitor resource by using the Cluster WebUI.
Tab name for setting
Item name
Setting value
Monitor(common)
Monitor Timing
Always
Recovery Action
Recovery Action
Execute only the final action
Recovery Action
Final Action
No operation
4.37.15. Receiving WebOTX notifications
By registering a specific listener class, notification is issued when WebOTX detects a failure. The JVM monitor resource receives the notification and outputs the following message to the JVM operation log.
%1$s:Notification received. %2$s.
%1$s and %2$s each indicates the following:
%1$s: Monitored Java VM
%2$s: Message in the notification (ObjectName=**,type=**,message=**)
At present, the following is the detailed information on MBean on the monitorable resource.
ObjectName |
[domainname]:j2eeType=J2EEDomain,name=[domainname],category=runtime |
|---|---|
notification type |
nec.webotx.monitor.alivecheck.not-alive |
Message |
failed |
4.37.16. Monitoring Tomcat
This section describes how to configure a target Tomcat to be monitored by the JVM monitor resource.
Stop Tomcat, and then open Start - (Tomcat_Program_folder) - Configure Tomcat.
In the Java Options of Java of the open window, specify the following settings. For n, specify the port number. If there is more than one Java VM to be monitored on the same machine, specify a unique port number. The port number specified for the settings is specified with Cluster WebUI (Monitor Resource Properties - Monitor(special) tab - Connection Port).
-Dcom.sun.management.jmxremote.port=n
-Dcom.sun.management.jmxremote.ssl=false
-Dcom.sun.management.jmxremote.authenticate=false
Save the settings, and then start Tomcat.
With Cluster WebUI (JVM Monitor Resource Name - Property - Monitor(special) tab - Identifier), specify a unique string that is different from those for the other monitor targets (e.g., tomcat).
4.37.17. Monitoring SVF
This section describes how to configure a target SVF to be monitored by the JVM monitor resource.
Select a monitor target from the following, and then use an editor to open the file.
Monitor target
File to be edited
UCX Server Service (for 9.x or later)
Report Director EnterpriseServer
Report Director Svf Server
Report Director Spool Balancer
Tomcat
%FIT_PRODUCTS_BASE%\SetupUtils\setup_tomcat.bat
SVF Print Spooler services
Before the change:
--JvmOptions=...After the change:
--JvmOptions=...;-Dcom.sun.management.jmxremote.port=n;-Dcom.sun.management.jmxremote.ssl=false;-Dcom.sun.management.jmxremote.authenticate=false
4.37.18. Monitoring a Java application that you created
This section describes the procedure to configure Java application which is monitored by JVM monitor resource. Specify the following Java option in one row to the option for Java application startup while Java application (the monitor target) is stopped. For n, specify the port number. If there is more than one Java VM to be monitored on the same machine, specify a unique port number. The port number specified here is also specified with the Cluster WebUI (Monitor Resource Properties - Monitor(special) tab - Connection Port).
-Dcom.sun.management.jmxremote.port=n
-Dcom.sun.management.jmxremote.ssl=false
-Dcom.sun.management.jmxremote.authenticate=false
Some Java applications require the following to be additionally specified.
-Djavax.management.builder.initial=<Class name of MBeanServerBuilder>
4.37.19. Monitor (special) tab
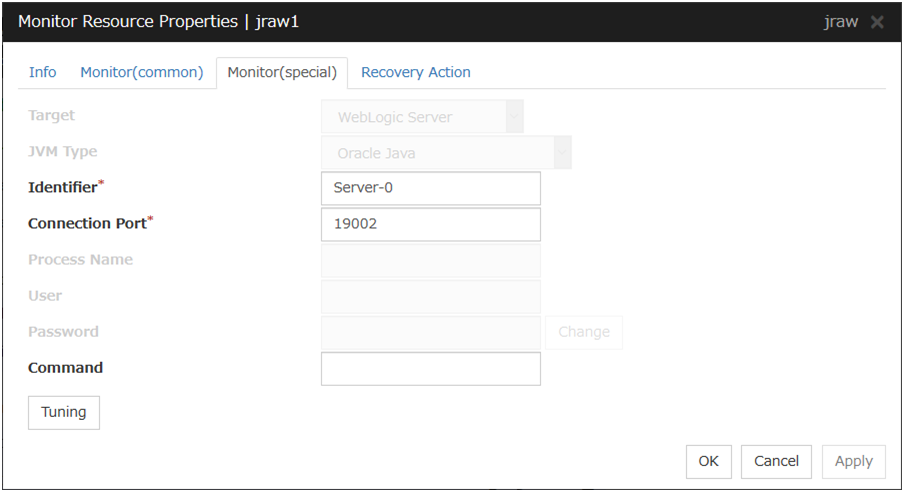
Target
Select the target to be monitored from the list. When monitoring WebSAM SVF for PDF, WebSAM Report Director Enterprise, or WebSAM Universal Connect/X, select WebSAM SVF. When monitoring a Java application that you created, select Java Application.
Default: None
JVM Type
Select the Java VM on which the target application to be monitored is running.
For Java 8 or later, select Oracle Java(usage monitoring). For Java 8, the following specification changes have been made.
It has become impossible to acquire the maximum value of each memory in a non-heap area.
Perm Gen has been changed to Metaspace.
Compressed Class Space was added.
For Java 8, therefore, the monitor items on the Memory tab have been changed as below.
Monitoring for the use rate has been changed to monitoring for the amount used.
Perm Gen, Perm Gen[shared-ro], and Perm Gen[shared-rw] cannot be monitored. Clear the check box.
Metaspace and Compressed Class Space can be monitored.
For Java 9, the following specification changes have been made.
Code Cache has been divided.
For Java9, therefore, the monitor items on the Memory tab have been changed as below.
Code Cache cannot be monitored. Clear the check box.
CodeHeap non-nmethods, CodeHeap profiled and CodeHeap non-profiled can be monitored.
Default: None
Identifier (Within 255 bytes)
The identifier is set to differentiate the relevant JVM monitor resource from another JVM monitor resource when the information on the application to be monitored is output to the JVM operation log of the relevant JVM monitor resource. For this purpose, set a unique character string between JVM monitor resources. You must specify the identifier.
Default: None
Connection Port (1024 to 65535)
Set the port number used by the JVM monitor resource when it establishes a JMX connection to the target Java VM. The JVM monitor resource obtains information by establishing a JMX connection to the target Java VM. Therefore, to register the JVM monitor resource, it is necessary to specify the setting by which the JMX connection port is opened for the target Java VM. You must specify the connection port. This is common to all the servers in the cluster. A value between 42424 and 61000 is not recommended.
Default: None
Process Name (Within 255 bytes)
This does not need to be configured because the monitor target Java VM can be identified by Connection Port. The internal version 11.35 or earlier required the process name to be specified since this parameter was used for the identification when the data of virtual memory usage amount was obtained or when the data of the monitor target was output to the JVM operation log. However, in and after the internal version 12.00, Monitor Virtual Memory Usage was deleted. Therefore, it cannot be specified.
Default: None
User (Within 255 bytes)
Specify the name of the administrator who will be making a connection with the target Java VM. When WebOTX Domain Agent is selected as the target, specify the "domain.admin.user" value of "(WebOTX_installation_path)\<domain_name>.properties".
Default: None
Password (Within 255 bytes)
Specify the password for the administrator who will be making a connection with the target Java VM. When WebOTX Domain Agent is selected as the target, specify the "domain.admin.passwd" value of "(WebOTX_installation_path)\<domain_name>.properties". Click Change and enter the password in the dialog box. The letters of the password are not displayed.
Default: None
Command (Within 255 bytes)
Specify the command to execute if an error is detected in the target Java VM. It is possible to specify the command to execute for each error cause, as well as arguments. Specify a full path. Enclose an executable file name with double quotes ("").Example) "\Program Files\bin\command.bat" arg1 arg2Here, specify the commands to execute if it is impossible to connect to the target Java VM and if an error is detected in acquiring the resource amount used.Default: None
When you click Tuning, the following information is displayed in the pop-up dialog box. Make detailed settings according to the descriptions below.
4.37.20. Memory tab(when Oracle Java is selected for JVM Type)
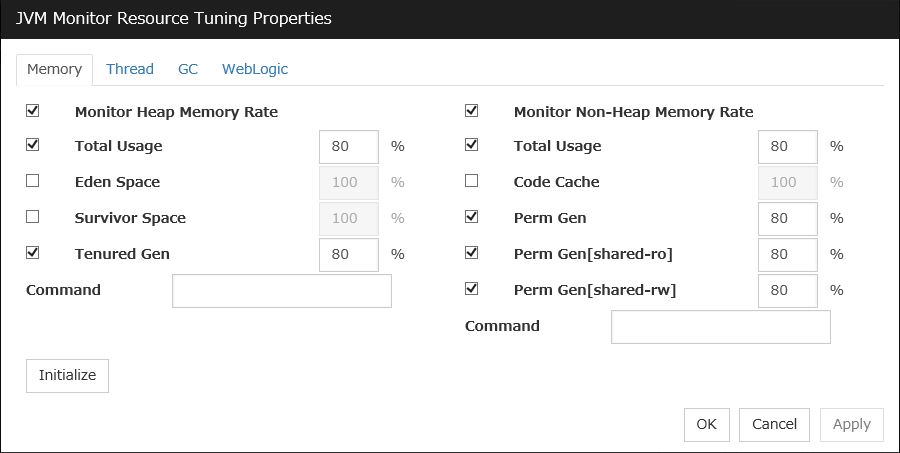
Monitor Heap Memory Rate
Enables the monitoring of the usage rates of the Java heap areas used by the target Java VM.
Total Usage (1 to 100)
Specify the threshold for the usage rate of the Java heap areas used by the target Java VM.
Default: 80[%]
Eden Space (1 to 100)
Specify the threshold for the usage rate of the Java Eden Space used by the target Java VM. If G1 GC is specified as the GC method of the target Java VM, read it as G1 Eden Space.
Default: 100[%]
Survivor Space (1 to 100)
Specify the threshold for the usage rate of the Java Survivor Space used by the target Java VM. If G1 GC is specified as the GC method of the target Java VM, read it as G1 Survivor Space.
Default: 100[%]
Tenured Gen (1 to 100)
Specify the threshold for the usage rate of the Java Tenured(Old) Gen area used by the target Java VM. If G1 GC is specified as the GC method of the target Java VM, read it as G1 Old Gen.
Default: 80[%]
Monitor Non-Heap Memory Rate
Enables the monitoring of the usage rates of the Java non-heap areas used by the target Java VM.
Total Usage (1 to 100)
Specify the threshold for the usage rate of the Java non-heap areas used by the target Java VM.
Default: 80[%]
Code Cache (1 to 100)
Specify the threshold for the usage rate of the Java Code Cache area used by the target Java VM.
Default: 100[%]
Perm Gen (1 to 100)
Specify the threshold for the usage rate of the Java Perm Gen area used by the target Java VM.
Default: 80[%]
Perm Gen[shared-ro] (1 to 100)
Specify the threshold for the usage rate of the Java Perm Gen [shared-ro] area used by the target Java VM.The Java Perm Gen [shared-ro] area is used when -client -Xshare:on -XX:+UseSerialGC is specified as the startup option of the target Java VM.Default: 80[%]
Perm Gen[shared-rw] (1 to 100)
Specify the threshold for the usage rate of the Java Perm Gen [shared-rw] area used by the target Java VM.The Java Perm Gen [shared-rw] area is used when -client -Xshare:on -XX:+UseSerialGC is specified as the startup option of the target Java VM.Default: 80[%]
Command (Within 255 bytes)
Specify the command to execute if an error is detected in the target Java VM. It is possible to specify the command to execute for each error cause, as well as arguments. Specify a full path. Enclose an executable file name with double quotes ("").Example) "\Program Files\bin\command.bat" arg1 arg2Here, specify the commands to execute if an error is detected in the Java heap area, and Java non-heap area of the target Java VM.Default: None
Initialize
Click the Initialize button to set all the items to their default values.
4.37.21. Memory tab(when Oracle Java(usage monitoring) is selected for JVM Type)
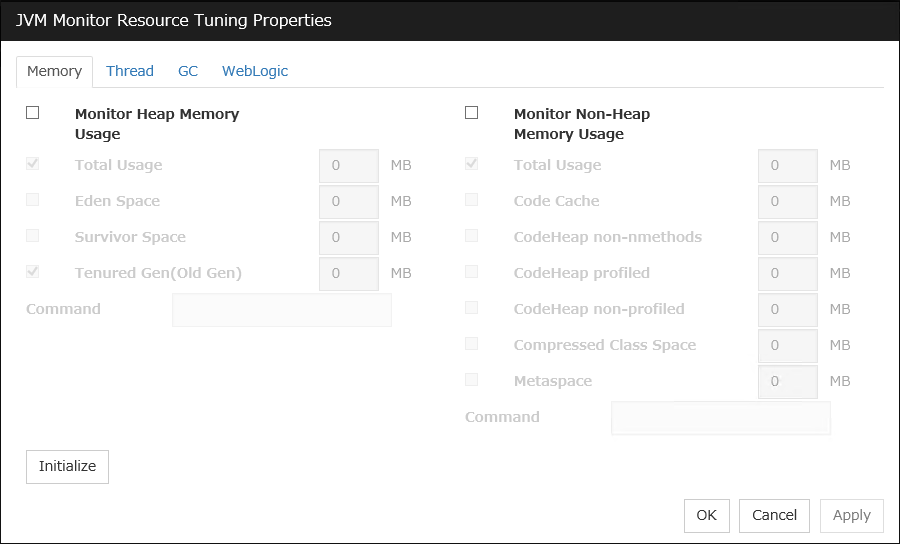
Monitor Heap Memory Usage
Enables the monitoring of the amount of the Java heap areas used by the target Java VM.
Total Usage (0 to 102400)
Specify the threshold for the usage rate of the Java heap areas used by the target Java VM. If zero is specified, this item is not monitored.
Default: 0[MB]
Eden Space (0 to 102400)
Specify the threshold for the usage rate of the Java Eden Space used by the target Java VM. If zero is specified, this item is not monitored. If G1 GC is specified as the GC method of the target Java VM, read it as G1 Eden Space.
Default: 0[MB]
Survivor Space (0 to 102400)
Specify the threshold for the usage rate of the Java Survivor Space used by the target Java VM. If zero is specified, this item is not monitored. If G1 GC is specified as the GC method of the target Java VM, read it as G1 Survivor Space.
Default: 0[MB]
Tenured Gen (0 to 102400)
Specify the threshold for the usage rate of the Java Tenured(Old) Gen area used by the target Java VM. If zero is specified, this item is not monitored. If G1 GC is specified as the GC method of the target Java VM, read it as G1 Old Gen.
Default: 0[MB]
Monitor Non-Heap Memory Usage
Enables the monitoring of the usage rate of the Java non-heap areas used by the target Java VM.
Total Usage (0 to 102400)
Specify the threshold for the usage rate of the Java non-heap areas used by the target Java VM. If zero is specified, this item is not monitored.
Default: 0[MB]
Code Cache (0 to 102400)
Specify the threshold for the usage rate of the Java Java Code Cache used by the target Java VM. If zero is specified, this item is not monitored.
Default: 0[MB]
CodeHeap non-nmethods (0 to 102400)
Specify the threshold for the usage rate of the Java CodeHeap non-nmethods areas used by the target Java VM. If zero is specified, this item is not monitored.
Default: 0[MB]
CodeHeap profiled (0 to 102400)
Specify the threshold for the usage rate of the Java CodeHeap profiled nmethods areas used by the target Java VM. If zero is specified, this item is not monitored.
Default: 0[MB]
CodeHeap non-profiled (0 to 102400)
Specify the threshold for the usage rate of the Java CodeHeap non-profiled nmethods areas used by the target Java VM. If zero is specified, this item is not monitored.
Default: 0[MB]
Compressed Class Space (0 to 102400)
Specify the threshold for the usage rate of the Compressed Class Space areas used by the target Java VM. If zero is specified, this item is not monitored.
Default: 0[MB]
Metaspace (0 to 102400)
Specify the threshold for the usage rate of the Metaspace area used by the target Java VM.
Default: 0[MB]
Command (Within 255 bytes)
Specify the command to execute if an error is detected in the target Java VM. It is possible to specify the command to execute for each error cause, as well as arguments. Specify a full path. Enclose an executable file name with double quotes ("").Example) "\Program Files\bin\command.bat" arg1 arg2Here, specify the commands to execute if an error is detected in the Java heap area, and Java non-heap area of the target Java VM.Default: None
Initialize
Click Initialize to set all the items to their default values.
4.37.22. Thread tab
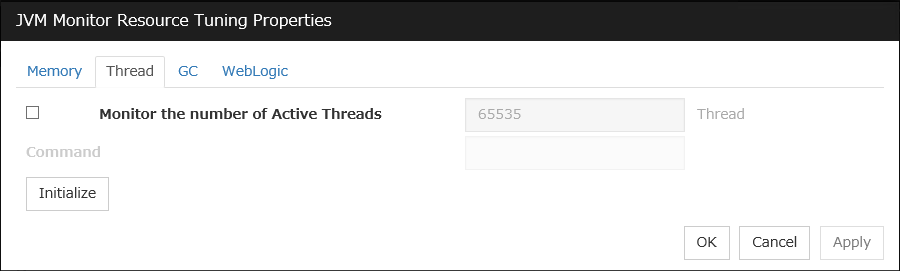
Monitor the number of Active Threads (1 to 65535)
Specify the upper limit threshold for the number of threads running on the monitor target Java VM.
Default: 65535 [threads]
Command (Within 255 bytes)
Specify the command to execute if an error is detected in the target Java VM. It is possible to specify the command to execute for each error cause, as well as arguments. Specify a full path. Enclose an executable file name with double quotes ("").Example) "\Program Files\bin\command.bat" arg1 arg2Here, specify the command to execute if an error is detected in the number of threads currently running in the target Java VM.Default: None
Initialize
Click Initialize to set all the items to their default values.
4.37.23. GC tab
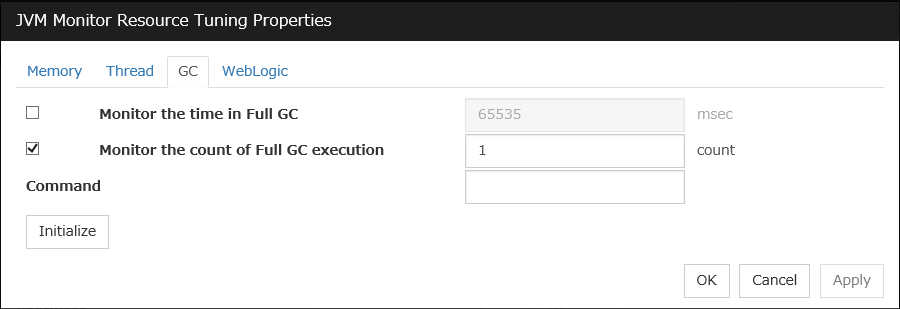
Monitor the time in Full GC (1 to 65535)
Specify the threshold for the Full GC execution time since previous measurement on the target Java VM. The threshold for the Full GC execution time is the average obtained by dividing the Full GC execution time by the number of times Full GC occurs since the previous measurement.
To determine the case in which the Full GC execution time since the previous measurement is 3000 milliseconds and Full GC occurs three times as an error, specify 1000 milliseconds or less.
Default: 65535 [milliseconds]
Monitor the count of Full GC execution (1 to 65535)
Specify the threshold for the number of times Full GC occurs since previous measurement on the target Java VM.
Default: 1 (time)
Command (Within 255 bytes)
Specify the command to execute if an error is detected in the target Java VM. It is possible to specify the command to execute for each error cause, as well as arguments. Specify a full path. Enclose an executable file name with double quotes ("").Example) "\Program Files\bin\command.bat" arg1 arg2Here, specify the commands to execute if an error is detected in the Full GC execution time and Full GC execution count of the target Java VM.Default: None
Initialize
Click Initialize to set all the items to their default values.
4.37.24. WebLogic tab
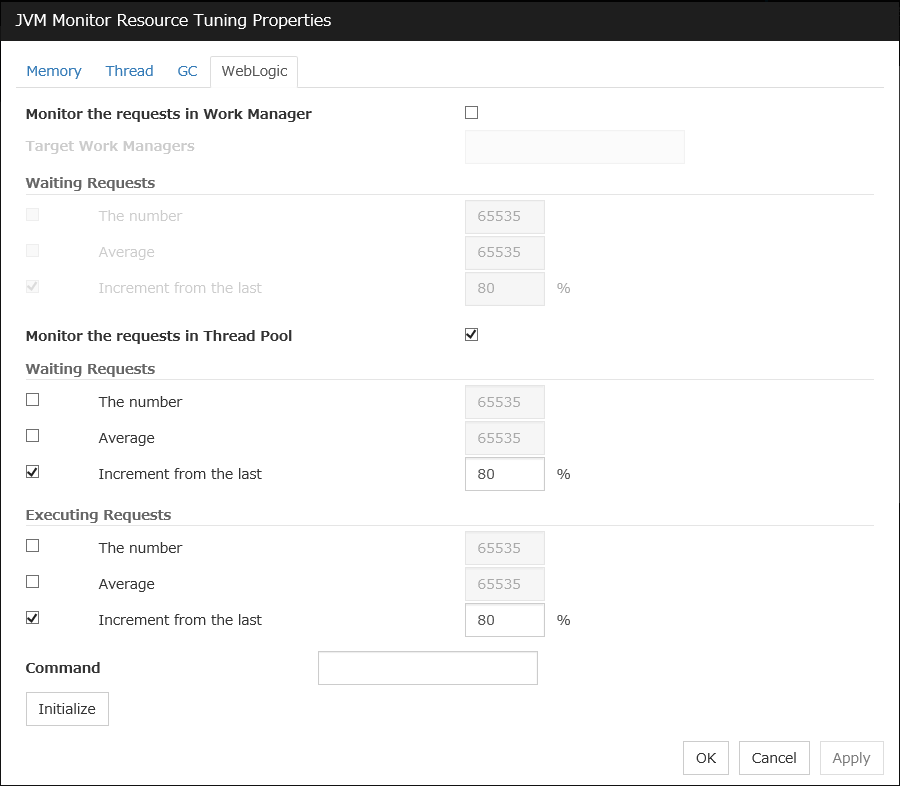
Monitor the requests in Work Manager
Enables the monitoring of the wait requests by Work Managers on the WebLogic Server.
Target Work Managers (Within 255 bytes)
Specify the names of the Work Managers for the applications to be monitored on the target WebLogic Server. To monitor Work Managers, you must specify this setting.
App1[WM1,WM2,...];App2[WM1,WM2,...];...
For App and WM, only ASCII characters are valid (except Shift_JIS codes 0x005C and 0x00A1 to 0x00DF).
To specify an application that has an application archive version, specify "application_name#version" in App.
When the name of the application contains "[" and/or "]", prefix it with " \\ ".
(Ex.) When the application name is app[2], enter app\\[2\\].
Default: None
The number (1 to 65535)
Specify the threshold for the wait request count for the target WebLogic Server Work Manager(s).
Default: 65535
Average (1 to 65535)
Specify the threshold for the wait request count average for the target WebLogic Server Work Manager(s).
Default: 65535
Increment from the last (1 to 1024)
Specify the threshold for the wait request count increment since the previous measurement for the target WebLogic Server Work Manager(s).
Default: 80[%]
Monitor the requests in Thread Pool
Enables the monitoring of the number of wait requests (number of HTTP requests queued in the WebLogic Server) and the number of executing requests (number of HTTP requests queued in the WebLogic Server) in the target WebLogic Server thread pool.
Waiting Requests The number (1 to 65535)
Specify the threshold for the wait request count.
Default: 65535
Waiting Requests Average (1 to 65535)
Specify the threshold for the wait request count average.
Default: 65535
Waiting Requests Increment from the last (1 to 1024)
Specify the threshold for the wait request count increment since the previous measurement.
Default: 80[%]
Executing Requests The number (1 to 65535)
Specify the threshold for the number of requests executed per unit of time.
Default: 65535
Executing Requests Average (1 to 65535)
Specify the threshold for the average count of requests executed per unit of time.
Default: 65535
Executing Requests Increment from the last (1 to 1024)
Specify the threshold for the increment of the number of requests executed per unit of time since the previous measurement.
Default: 80[%]
Command (Within 255 bytes)
Specify the command to execute if an error is detected in the target Java VM. It is possible to specify the command to execute for each error cause, as well as arguments. Specify a full path. Enclose an executable file name with double quotes ("").Example) "\Program Files\bin\command.bat"Here, specify the commands to execute if an error is detected in the requests in the thread pool or in the work manager of the WebLogic Server.Default: None
Initialize
Click Initialize to set all the items to their default values.
4.38. Understanding system monitor resources
System monitor resources monitor the system resources. The resources periodically collect statistical information about system resources and analyze the information according to given knowledge data. System monitor resources serve to detect the exhaustion of resources early according to the results of analysis.
4.38.1. Notes on system monitor resource
For the recovery target, specify the resource to which fail-over is performed upon the detection of an error in resource monitoring by System Resource Agent.
The use of the default System Resource Agent settings is recommended.
Errors in resource monitoring may be undetectable when:
A system resource value repeatedly exceeds and then falls below a threshold.
In a case like where the system is high loaded, it may take a long time to collect statistical information and the interval of statistical information collection may be unapplied.
If date or time of OS has been changed during System Resource Agent's operation, resource monitoring may operate wrongly as follows since the timing of analyze which is normally done at 10 minute intervals may be changed at first time after changing date or time. In such case, suspend and resume cluster.
Error is not detected after passing specified duration to detect error.
Error is detected before passing specified duration to detect error.
Once the cluster has been suspended and resumed, the collection of information is started from that point of time.
The amount of system resources used is analyzed at 10-minute intervals. Thus, an error may be detected up to 10 minutes after the monitoring session.
The amount of disk resources used is analyzed at 60-minute intervals. Thus, an error may be detected up to 60 minutes after the monitoring session.
Specify a smaller value than the actual disk size when specifying the disk size for free space monitoring of disk resources. If a larger value specified, a lack-of-free-space error will be detected.
If the monitored disk is exchanged, the following information analyzed up to then will be cleared if it differs from the information in the previous disk:
Total disk capacity
File system
For servers in which no swap areas are allocated, uncheck monitoring the total usage of virtual memory.
When monitoring disk resources, only hard disks can be monitored.
Up to 26 disk units can be simultaneously monitored by the disk resource monitoring function.
If System monitor is not displayed in the Type column on the monitor resource definition screen, select Get License Info and then acquire the license information.
The status of the system monitor resource is Warning from when start of monitoring is enabled to when the monitoring processing is actually performed.
Monitor sraw has detected an error. (99 : monitor was timeout)
4.38.2. Monitoring by system monitor resources
System monitor resources monitor the following:
Periodically collect the amounts of system resources and disk resources used and then analyze the amounts.
An error is recognized if the amount of a resource used exceeds a pre-set threshold.
When an error detected state persists for the monitoring duration, it is posted as an error detected during resource monitoring.
System resource monitoring with the default values reports an error found in resource monitoring 60 minutes later if the resource usage does not fall below 90%.
The following shows an example of error detection for the total memory usage in system resource monitoring with the default values.
The total memory usage remains at the total memory usage threshold or higher as time passes, for at least a certain duration of time.
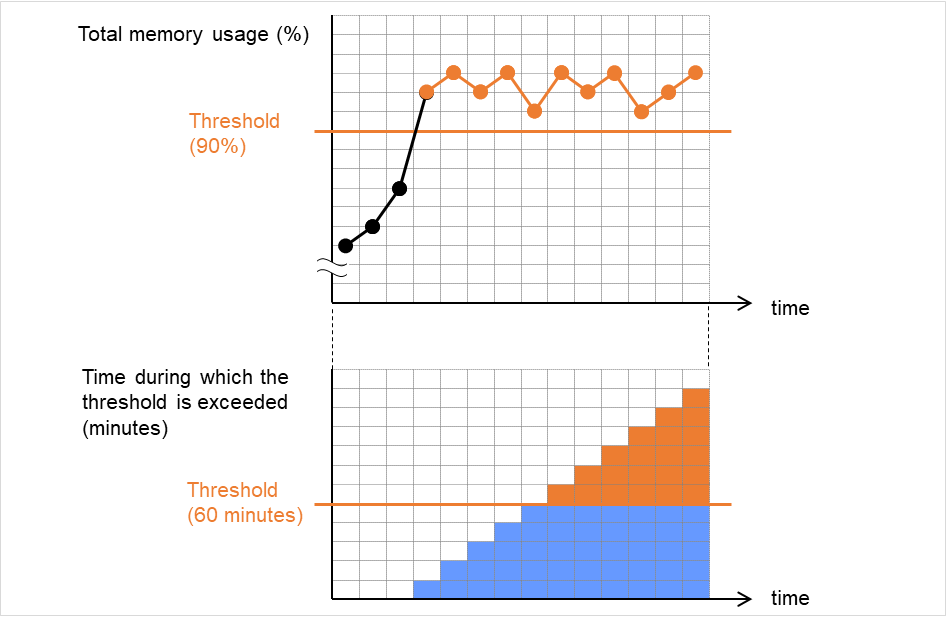
Fig. 4.68 Total memory usage at its threshold or higher for a certain time, which leads to error detection
The total memory usage rises and falls in the vicinity of the total memory usage threshold as time passes, but always remains under that threshold.
In the following figure, the total memory usage temporarily reaches its threshold (90%) or higher. However, this situation does not last for the monitoring duration (60 minutes), and therefore does not lead to detecting an error in the total memory usage.
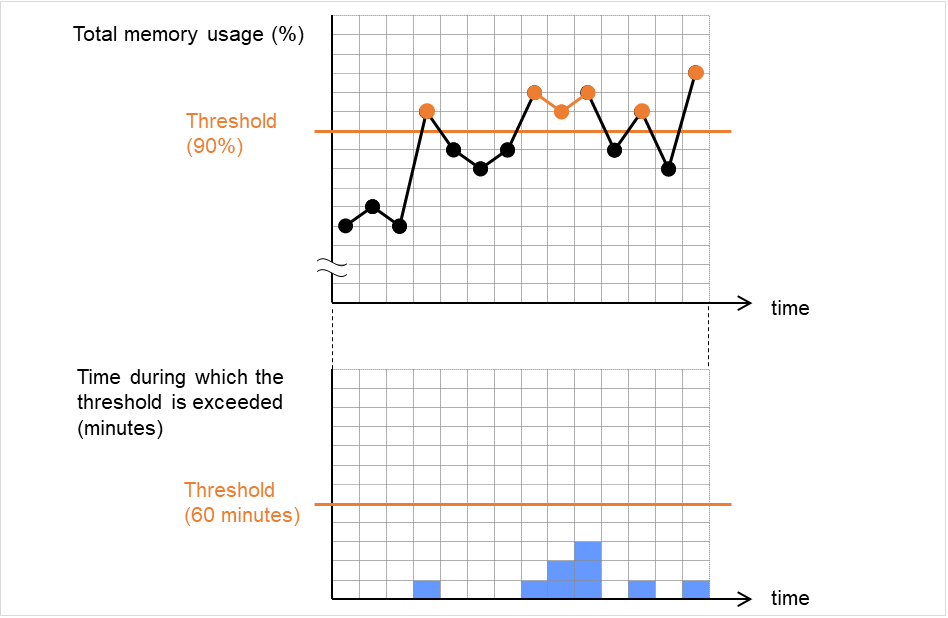
Fig. 4.69 Total memory usage at its threshold or higher for less than a certain time, which does not lead to error detection
If disk resource monitoring operated under the default settings, it will report a notice level error after 24 hours.
The following chart describes how disk resource monitoring detects disk usage errors when operating under the default settings.
Monitoring disk usage by warning level
In the following example, disk usage exceeds the threshold which is specified as the warning level upper limit.
This excess causes an error to be considered to occur in monitoring the disk usage.
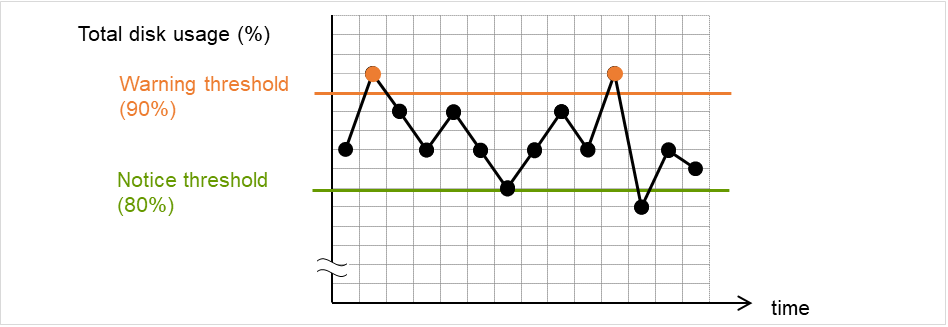
Fig. 4.70 Disk usage exceeding the upper limit of the warning level, which leads to error detection
In the following example, disk usage increases and decreases within certain range, and does not exceed the threshold which is specified as the warning level upper limit.
Since the disk usage changes within the upper limit of the warning level, no error is considered to occur in monitoring the disk usage.
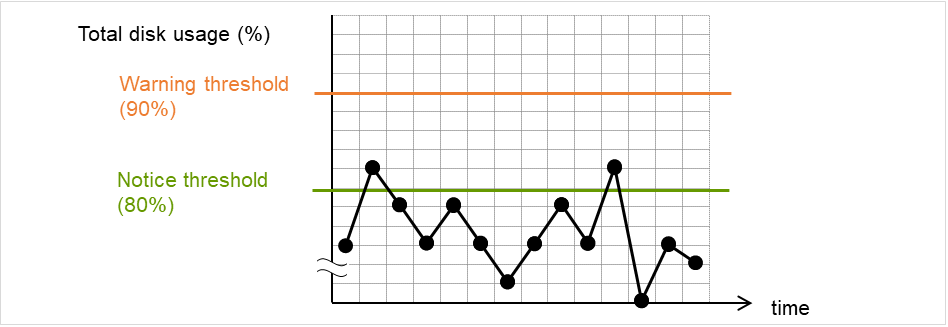
Fig. 4.71 Disk usage not exceeding the upper limit of the warning level, which does not lead to error detection
Monitoring disk usage by notice level
In the following example, disk usage continuously exceeds the threshold specified as the notification level upper limit, and the duration exceeds the set length.
The excess of disk usage causes an error to be considered to occur in monitoring the disk usage.
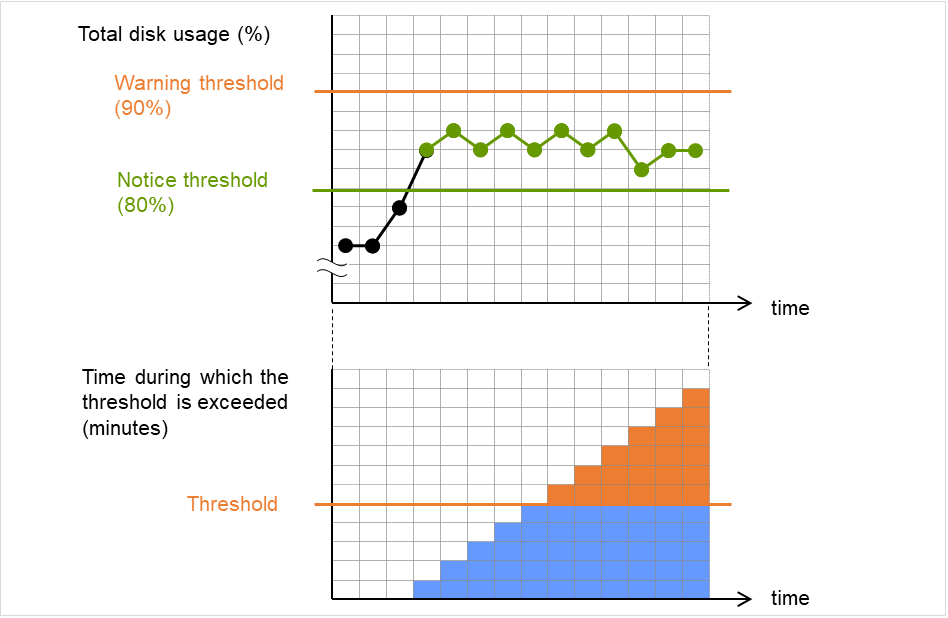
Fig. 4.72 Disk usage exceeding the upper limit of the notification level for a certain time, which leads to error detection
In the following example, disk usage increases and decreases within a certain range, and does not exceed the threshold specified as the notification level upper limit.
Since the excess of disk usage does not last for a certain time, no error is considered to occur in monitoring the disk usage.
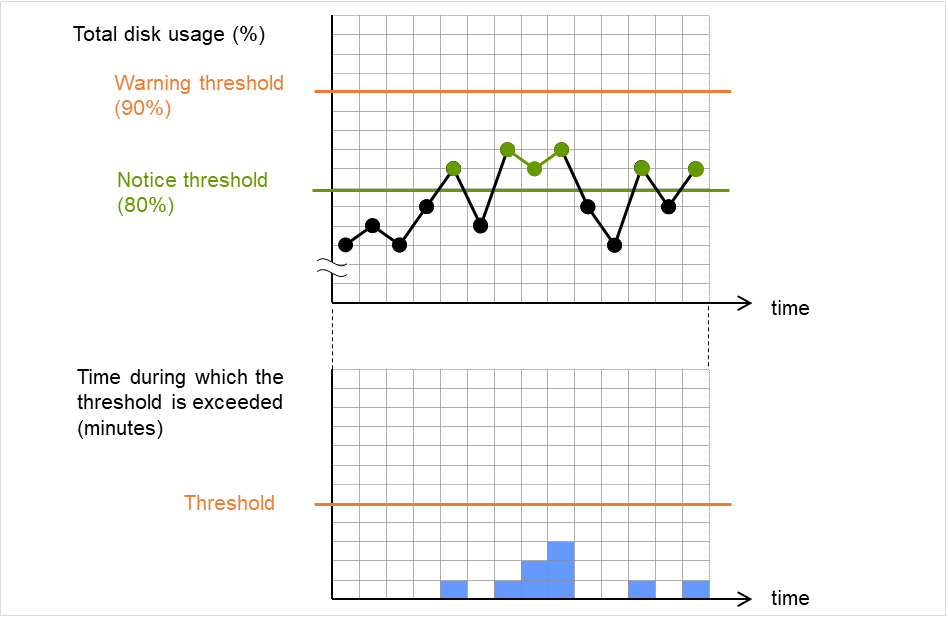
Fig. 4.73 Disk usage exceeding the upper limit of the notification level for less than a certain time, which does not lead to error detection
4.38.3. Monitor (special) tab
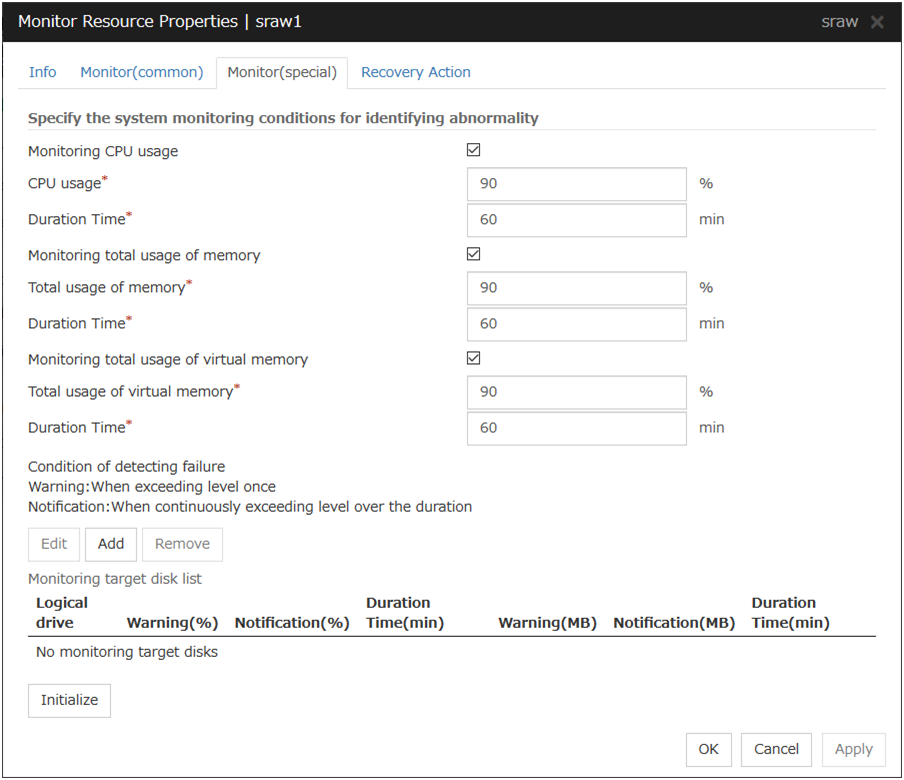
Monitoring CPU usage
Enables CPU usage monitoring.
CPU usage (1 to 100)
Specify the threshold for the detection of the CPU usage.
Duration Time (1 to 1440)
Specify the duration for detecting the CPU usage.
If the threshold is continuously exceeded over the specified duration, the detection of an error is recognized.
Monitoring total usage of memory
Enables the monitoring of the total usage of memory.
Total usage of memory (1 to 100)
Specify the threshold for the detection of a memory use amount error (percentage of the memory size implemented on the system).
Duration Time (1 to 1440)
Specify the duration for detecting a total memory usage error.
If the threshold is continuously exceeded over the specified duration, the detection of an error is recognized.
Monitoring total usage of virtual memory
Enables the monitoring of the total usage of virtual memory.
Total usage of virtual memory (1 to 100)
Specify the threshold for the detection of a virtual memory usage error.
Duration Time (1 to 1440)
Specify the duration for detecting a total virtual memory usage error.
If the threshold is continuously exceeded over the specified duration, the detection of an error is recognized.
Add
Click this to add disks to be monitored. The Input of watch condition dialog box appears.
Configure the detailed monitoring conditions for error determination, according to the descriptions given in the Input of watch condition dialog box.
Remove
Click this to remove a disk selected in Disk List so that it will no longer be monitored.
Edit
Click this to display the Input of watch condition dialog box. The dialog box shows the monitoring conditions for the disk selected in Disk List. Edit the conditions and click OK.
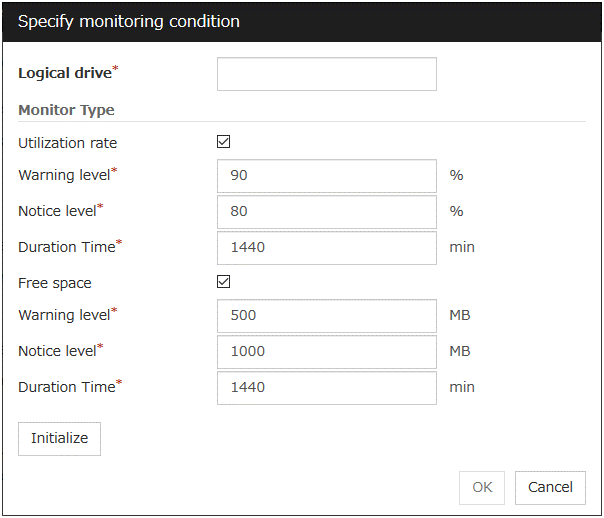
Logical drive
Set the logical drive to be monitored.
Utilization rate
Enables the monitoring of the disk usage.
Warning level (1 to 100)
Specify the threshold for warning level error detection for disk usage.
Notice level (1 to 100)
Specify the threshold for notice level error detection for disk usage.
Duration Time (1 to 43200)
Specify the duration for detecting a notice level error of the disk usage rate.
If the threshold is continuously exceeded over the specified duration, the detection of an error is recognized.
Free space
Enables the monitoring of the free disk space.
Warning level (1 to 4294967295)
Specify the amount of disk space (in megabytes) for which the detection of an free disk space error at the warning level is recognized.
Notice level (1 to 4294967295)
Specify the amount of disk space (in megabytes) for which the detection of an free disk space error at the notice level is recognized.
Duration Time (1 to 43200)
Specify the duration for detecting a notice level error related to the free disk space.
If the threshold is continuously exceeded over the specified duration, the detection of an error is recognized.
4.39. Understanding process resource monitor resources
Process resource monitor resources monitor the resources used by processes. The resources periodically collect statistical information about resources used by processes and analyze the information according to given knowledge data. Process resource monitor resources serve to detect the exhaustion of resources early according to the results of analysis.
4.39.1. Notes on process resource monitor resource
For the recovery target, specify the resource to which fail-over is performed upon the detection of an error in resource monitoring by process resource monitor resources.
The use of the default process resource monitor resources settings is recommended.
In a case like where the system is high loaded, it may take a long time to collect statistical information and the interval of statistical information collection may be unapplied.
If date or time of OS has been changed during System Resource Agent's operation, resource monitoring may operate wrongly as follows since the timing of analyze which is normally done at 10 minute intervals may be changed at first time after changing date or time. In such case, suspend and resume cluster.
Error is not detected after passing specified duration to detect error.
Error is detected before passing specified duration to detect error.
Once the cluster has been suspended and resumed, the collection of information is started from that point of time.
The amount of process resources used is analyzed at 10-minute intervals. Thus, an error may be detected up to 10 minutes after the monitoring session.
The status of the process resource monitor resource is Warning from when start of monitoring is enabled to when the monitoring processing is actually performed.
To return the status of the process resource monitor resource from error to normal, perform either of the following:
Suspending and resuming the cluster
Stopping and starting the cluster
Use the following command to check the name of a process that is actually running and specify the name for the monitor target process name.
EXPRESSCLUSTER installation path\bin\GetProcess.vbs
When the above command is executed, GetProcess_Result.txt is output to the folder in which the command is executed. Open GetProcess_Result.txt and specify the CommandLine section of the process being displayed. If the output information includes double quotations (""), specify the section including the double quotations.
Example of output file
20XX/07/26 12:03:13
Caption         CommandLine
services.exe    C:\WINDOWS\system32\services.exe
svchost.exe     C:\WINDOWS\system32\svchost -k rpcss
explorer.exe    C:\WINDOWS\Explorer.EXE
Monitor psrw has detected an error. (99 : monitor was timeout)
4.39.2. Monitoring by process resource monitor resources
Process resource monitor resources monitor the following:
Periodically collect the amounts of process resources used and then analyze the amounts.
An error is recognized if the amount of a resource used exceeds a pre-set threshold.
When an error detected state persists for the monitoring duration, it is posted as an error detected during resource monitoring.
If process resource monitoring (of the CPU, memory, or number of threads) operated by using the default values, a resource error is reported after 24 hours.
The following chart describes how process resource monitoring detects memory usage errors.
In the following example, as time progresses, memory usage increases and decreases, the maximum value is updated more times than specified, and increases by more than 10% from its initial value.
The specified update count of the maximum value is exceeded, the increasing rate exceeds its initial value (10%), and then the default period (24 hours) elapses. This causes a memory leak to be considered to occur.
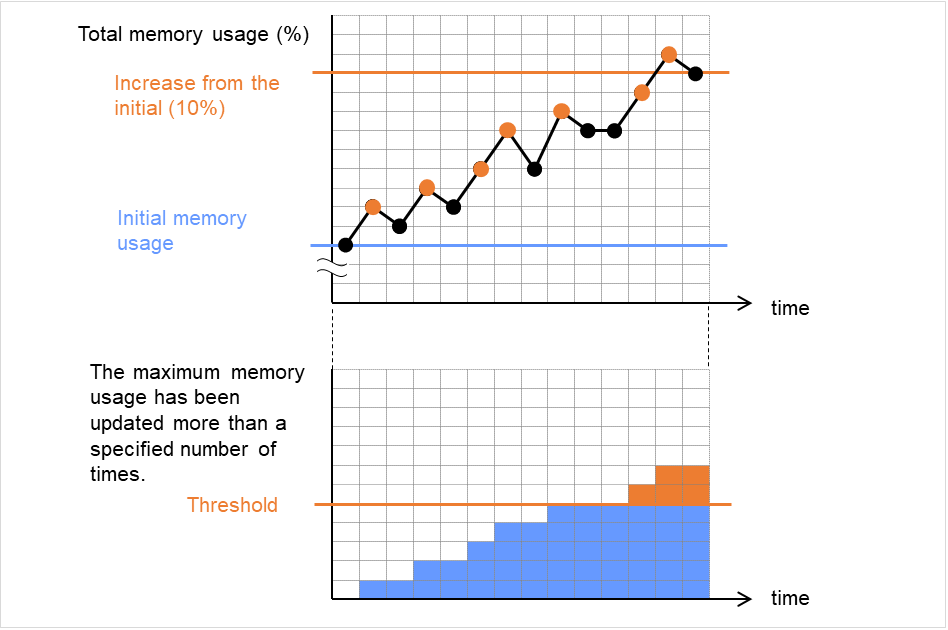
Fig. 4.74 Regarding memory usage, the maximum value is updated more times than specified, and the increasing rate exceeds its initial value (10%), which leads to error detection
In the following example, memory usage increases and decreases, but remains within a set range.
Since the memory usage changes below the specified level, no memory leak is considered to occur.
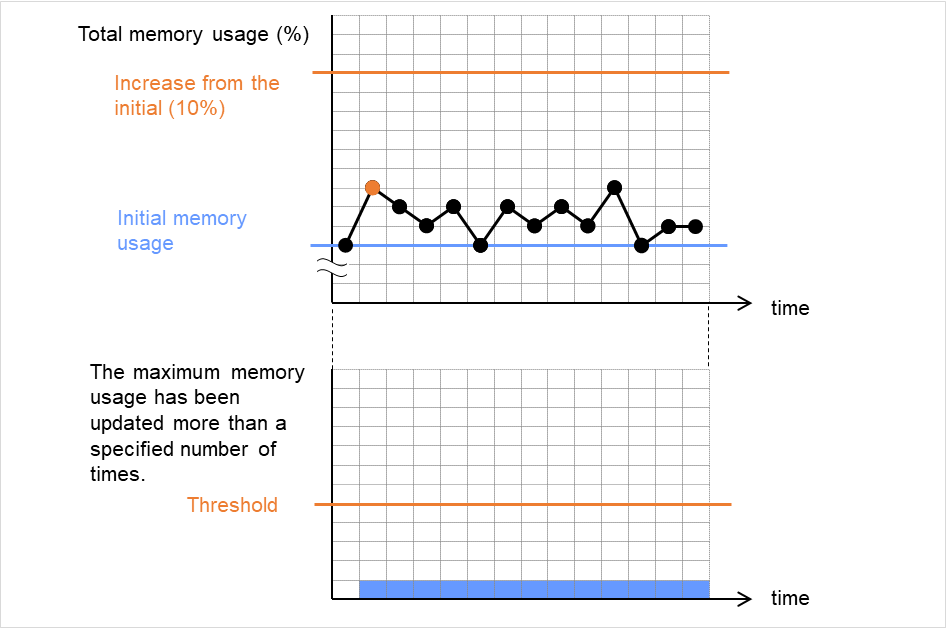
Fig. 4.75 Memory usage increasing/decreasing within a set range, which does not lead to error detection
4.39.3. Monitor (special) tab
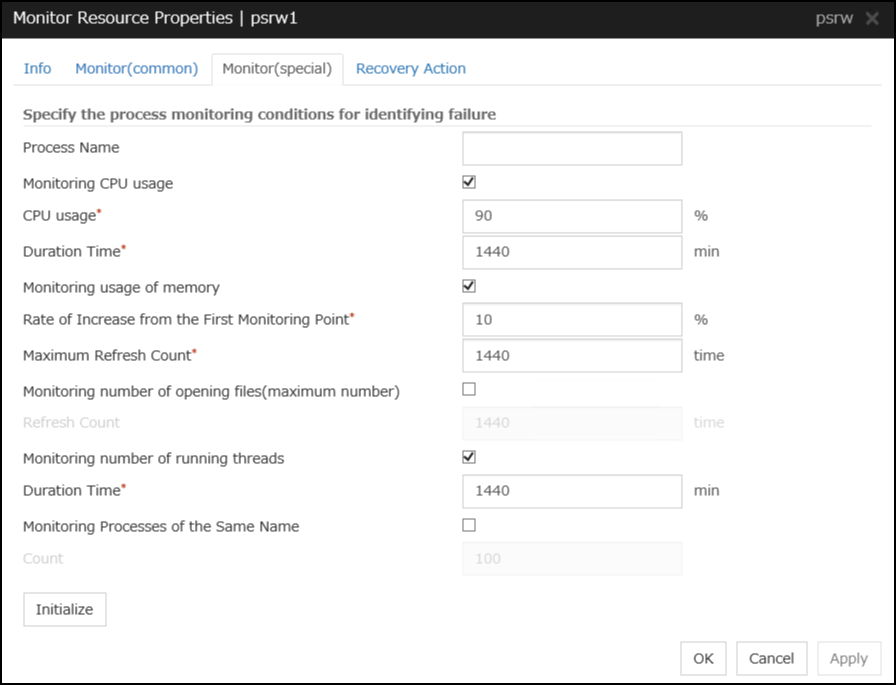
Process Name (within 1023 bytes)
Set the name of the target process. Without setting it, all started processes are monitored.
Wild cards can be used to specify process names in the three patterns described below. Patterns other than these cannot be used.
prefix search : <character string included in process name>*
suffix search : *<character string included in process name>
partial search : *<character string included in process name>*
Monitoring CPU usage
Enables CPU usage monitoring.
CPU usage (1 to 100)
Specify the threshold for the detection of the CPU usage.
Duration Time (1 to 4320)
Specify the duration for detecting the CPU usage.
If the threshold is continuously exceeded over the specified duration, the detection of an error is recognized.
Monitoring usage of memory
Enables the monitoring of the usage of memory.
Rate of Increase from the First Monitoring Point (1 to 1000)
Specify the threshold for the detection of a memory use amount error.
Maximum Update Count (1 to 4320)
Specify the maximum update count for the detection of a memory use amount error.Exceeding the threshold consecutively by the specified count leads to the error detection.
Monitoring number of opening files (maximum number)
Enables the monitoring of the number of opening files (maximum number).
Refresh Count (1 to 4320)
Specify the refresh count for the detection of the number of opening files error.If the number of opening files maximum value is updated more count than specified, the detection of an error is recognized.
Monitoring number of running threads
Enables the monitoring of the number of running threads.
Duration Time (1 to 4320)
Specify the duration for detecting an error with the number of running threads.If the processes for which the number of running threads is passed more than specified times, the detection of an error is recognized.
Monitoring Processes of the Same Name
Enables the monitoring of the processes of the same name
Count (1 to 10000)
Specify the count for detecting an error with the processes of the same name.If the processes of the same name has been exists more than specified numbers, the detection of an error is recognized.
4.40. Understanding user mode monitor resources
The user mode monitor resources monitor any user space stalls.
4.40.1. Monitoring by user mode monitor resources
The user mode monitor resources monitor the following:
After the start of monitoring, a user space monitor resource starts the keepalive timer and then updates the keepalive timer at monitoring intervals. It detects an error if the timer is not updated during a set duration as a result of a user space stall.
A user space monitor resource has a setting for extending the monitoring by creating a dummy thread. If this setting is enabled, it creates a dummy thread at monitoring intervals. If it fails to create a dummy thread, it does not update the keepalive timer.
The processing logic of the user mode monitor resources is as follows:
Overview of processing
The following steps 2 and 3 are repeated.
Set the keepalive timer
Create a dummy thread
Update the keepalive timer
Step 2 is a process for advanced monitor setting. If this is not set, the process is not started.
- Behavior when a timeout does not occur (steps 2 and 3,above, are processed properly)Recovery processing such as reset is not executed.
- Behavior when a timeout occurs (Either of steps 2 or 3, above, is stopped or delayed)According to the action settings, a reset or panic is generated by the clphb driver.
4.40.2. Monitor (special) tab
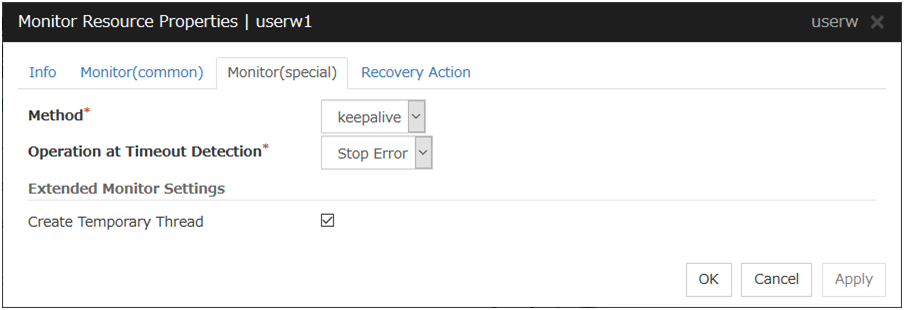
Method
Specify how the user space is monitored.
Operation at Timeout Detection
Specify the action to take when a timeout occurs.
Note
A dummy failure cannot be triggered by an action when a timeout occurs.
Create Temporary Thread
Specify whether or not to create a dummy thread when monitoring.
4.41. Understanding AWS elastic ip monitor resources
For EIP control, AWS elastic ip monitor resources confirm the existence of EIPs by using the AWS CLI command.
4.41.1. Notes on AWS elastic ip monitor resources
AWS elastic ip monitor resources are automatically created when AWS elastic ip resources are added. A single AWS elastic ip monitor resource is automatically created for a single AWS elastic ip resource.
See "Setting up AWS elastic ip resources" in "Notes when creating the cluster configuration data" in "Notes and Restrictions" of the "Getting Started Guide".
For information on the settings of IAM, see "Getting Started Guide" -> "Notes and Restrictions" -> "Before installing EXPRESSCLUSTER" -> "IAM settings in the AWS environment".
4.41.2. Applying command line options to AWS CLI run from AWS Elastic IP monitor resource
4.41.3. Applying environment variables to AWS CLI run from the AWS elastic ip monitor resource
4.41.4. Monitor (special) tab
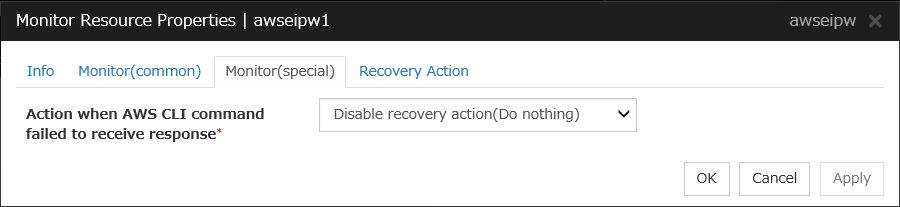
Action when AWS CLI command failed to receive response
Specify the action to be taken when acquiring the AWS CLI command response fails. This failure occurs, for example, when a region endpoint is down due to maintenance, when AWS CLI timeout occurs because of route troubles, heavy load or delay for connecting to a region endpoint, or when a credential error occurs. Refer to the following instructions:
Select Enable recovery action if you want to perform failover when AWS CLI command fails.
Select Disable recovery action(Display warning) if you want to show a warning message without failover when AWS CLI command fails.
Select Disable recovery action(Do nothing) if you think this error is CLI command failure (a monitoring target itself is in normal status) and no action needs to be taken. This option is recommended as still error detection can find EIP error (e.g. no EIP is found).
4.42. Understanding AWS virtual ip monitor resources
For virtual IP (VIP) control, AWS Virtual IP monitor resources check the existence of VIP addresses and the soundness of VPC routing.
AWS CLI command is executed for AWS virtual ip monitor resources while monitoring to check the route table information.
4.42.1. Notes on AWS virtual ip monitor resources
AWS virtual ip monitor resources are automatically created when AWS virtual ip resources are added. A single AWS virtual ip monitor resource is automatically created for a single AWS virtual ip resource.
See "Setting up AWS virtual ip resources" in "Notes when creating the cluster configuration data" in "Notes and Restrictions" of the "Getting Started Guide".
For information on the settings of IAM, see "Getting Started Guide" -> "Notes and Restrictions" -> "Before installing EXPRESSCLUSTER" -> "IAM settings in the AWS environment".
4.42.2. Applying command line options to AWS CLI run from AWS Virtual IP monitor resource
4.42.3. Applying environment variables to AWS CLI run from the AWS virtual ip monitor resource
4.42.4. Monitor (special) tab

Action when AWS CLI command failed to receive response
Specify the action to be taken when acquiring the AWS CLI command response fails. This failure occurs, for example, when a region endpoint is down due to maintenance, when AWS CLI timeout occurs because of route troubles, heavy load or delay for connecting to a region endpoint, or when a credential error occurs. Refer to the following instructions:
Select Enable recovery action if you want to perform failover when AWS CLI command fails.
Select Disable recovery action(Display warning) if you want to show a warning message without failover when AWS CLI command fails.
Select Disable recovery action(Do nothing) if you think this error is CLI command failure (a monitoring target itself is in normal status) and no action needs to be taken. This option is recommended as still error detection can find errors, for example when troubles are found in VPC routing condition or no VIP is found.
4.43. Understanding AWS secondary ip monitor resources
AWS Secondary IP monitor resources check if secondary IP addresses exist.
4.43.1. Notes on AWS secondary ip monitor resources
See "Setting up AWS secondary ip resources" in "Notes when creating the cluster configuration data" in "Notes and Restrictions" of the "Getting Started Guide".
For information on the settings of IAM, see "Getting Started Guide" -> "Notes and Restrictions" -> "Before installing EXPRESSCLUSTER" -> "IAM settings in the AWS environment".
4.43.2. Applying command line options to AWS CLI run from AWS Secondary IP monitor resource
4.43.3. Applying environment variables to AWS CLI run from the AWS secondary ip monitor resource
4.43.4. Monitor (special) tab
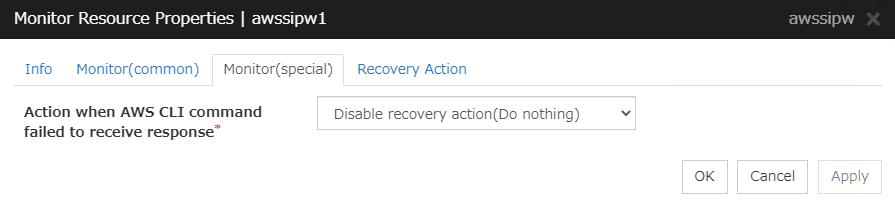
Action when AWS CLI command failed to receive response
Specify the action to be taken when acquiring the AWS CLI command response fails. This failure occurs, for example, when a region endpoint is down due to maintenance, when AWS CLI timeout occurs because of route troubles, heavy load or delay for connecting to a region endpoint, or when a credential error occurs. Refer to the following instructions:
Select Enable recovery action if you want to perform failover when AWS CLI command fails.
Select Disable recovery action(Display warning) if you want to show a warning message without failover when AWS CLI command fails.
If no actions are to be taken, because the failure of the AWS CLI command does not mean an error in the monitoring target, it is recommended to select Disable recovery action(Do nothing). Even in this case, you can detect an error in failing to check the health of a registered IP address.
4.44. Understanding AWS AZ monitor resources
AWS AZ monitor resources monitor the soundness of the AZ to which each server belongs, by using the AWS CLI command.
When the command result is available, AZ is in normal status. When information or impaired, AZ is in warning status. When unavailable, AZ is in error status. If you use internal version earlier than 12.20, only available represents the normal status (other results are categorized in error status).
4.44.1. Notes on AWS AZ monitor resources
When monitoring an AZ, create a single AWS AZ monitor resource.
See "Setting up AWS elastic ip resources" and "Setting up AWS virtual ip resources" in "Notes when creating the cluster configuration data" in "Notes and Restrictions" of the "Getting Started Guide".
For information on the settings of IAM, see "Getting Started Guide" -> "Notes and Restrictions" -> "Before installing EXPRESSCLUSTER" -> "IAM settings in the AWS environment".
4.44.2. Applying command line options to AWS CLI run from AWS AZ monitor resource
4.44.3. Applying environment variables to AWS CLI run from the AWS AZ monitor resource
4.44.4. Monitor (special) tab
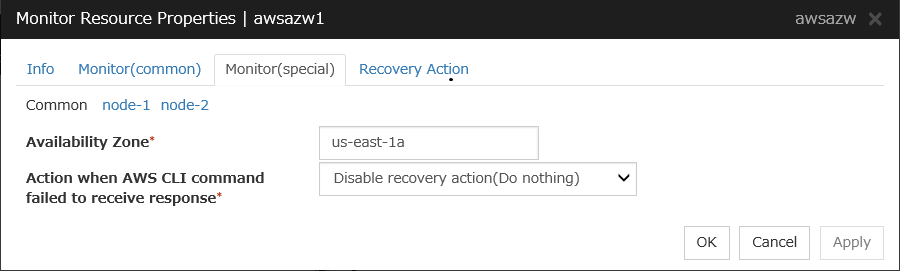
Availability Zone (Within 45 bytes)
Specify the availability zone in which to perform monitoring.
Action when AWS CLI command failed to receive response
Specify the action to be taken when acquiring the AWS CLI command response fails. This failure occurs, for example, when a region endpoint is down due to maintenance, when AWS CLI timeout occurs because of route troubles, heavy load or delay for connecting to a region endpoint, or when a credential error occurs. Refer to the following instructions:
Select Enable recovery action if you want to perform failover when AWS CLI command fails.
Select Disable recovery action(Display warning) if you want to show a warning message without failover when AWS CLI command fails.
Select Disable recovery action(Do nothing) if you think this error is CLI command failure (a monitoring target itself is in normal status) and no action needs to be taken. This option is recommended as still error detection can find errors, for example when troubles are found in AZ condition.
4.45. Understanding AWS DNS monitor resources
AWS DNS monitor resources confirm the soundness of the registered IP address by using the OS API and AWS CLI commands.
Errors are detected when:
The resource record set does not exist.
The registered IP Address cannot obtained by name resolution of the virtual host name (DNS name).
4.45.1. Notes on AWS DNS monitor resources
AWS DNS monitor resources are automatically created when AWS DNS resources are added. A single AWS DNS monitor resource is automatically created for a single AWS DNS resource.
See "Setting up AWS DNS resources" in "Notes when creating the cluster configuration data" in "Notes and Restrictions" of the "Getting Started Guide".
For information on the settings of IAM, see "Getting Started Guide" -> "Notes and Restrictions" -> "Before installing EXPRESSCLUSTER" -> "IAM settings in the AWS environment".
4.45.2. Applying command line options to AWS CLI run from AWS DNS monitor resource
4.45.3. Applying environment variables to AWS CLI run from the AWS DNS monitor resource
4.45.4. Monitor (special) tab
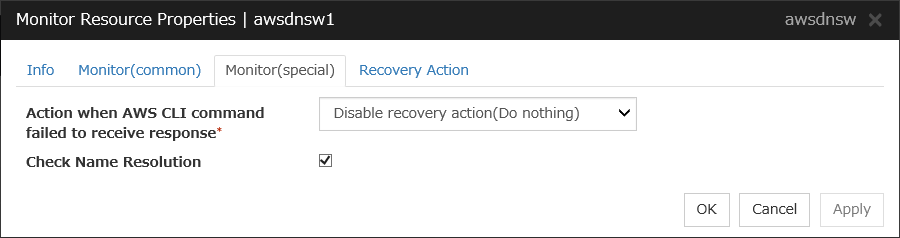
Monitor Resource Record Set
Action when AWS CLI command failed to receive response
Specify the action to be taken when acquiring the AWS CLI command response fails. This failure occurs, for example, when a region endpoint is down due to maintenance, when AWS CLI timeout occurs because of route troubles, heavy load or delay for connecting to a region endpoint, or when a credential error occurs. Refer to the following instructions:
Select Enable recovery action if you want to perform failover when AWS CLI command fails.
Select Disable recovery action(Display warning) if you want to show a warning message without failover when AWS CLI command fails.
Select Disable recovery action(Do nothing) if you think this error is CLI command failure (a monitoring target itself is in normal status) and no action needs to be taken. This option is recommended as still error detection can find errors, for example when troubles are found in IP addresses.
Check Name Resolution
4.46. Understanding Azure probe port monitor resources
Azure probe port monitor resources perform alive monitoring on a probe port control process that starts when Azure probe port resources are active on the node on which the Azure probe port resources are active. If the process does not start normally, a monitoring error occurs.
4.46.1. Notes on Azure probe port monitor resources
Azure probe port resources are automatically created when Azure probe port resources are added. One Azure probe port monitor resource is automatically created per Azure probe port resource.
In Azure probe port monitor resources, I will monitor the occurrence of probe standby timeout on the Azure probe port resources. Therefore, Interval of Azure probe port monitor resource, than the value of the set in the Azure probe port resources monitored Probe Wait Timeout, you need to set a large value.
See "Setting up Azure probe port resources"in "Notes when creating the cluster configuration data" in "Notes and Restrictions" of the "Getting Started Guide".
4.46.2. Monitor (special) tab
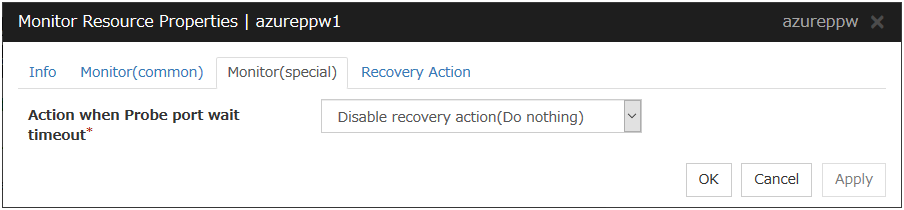
Action when Probe port wait timeout
Specify the recovery action to be taken when a probe port wait timeout occurs in Azure probe port resources.
4.47. Understanding Azure load balance monitor resources
Azure load balance monitor resources monitor to see if a port with the same port number as that of the probe port has been open on the node on which the Azure probe port resources are not active.
4.47.1. Notes on Azure load balance monitor resources
Azure load balance monitor resources are automatically created when Azure probe port resources are added. One Azure load balance monitor resource is automatically created per Azure probe port resource.
See "Setting up Azure probe port resources" in "Notes when creating the cluster configuration data" in "Notes and Restrictions" of the "Getting Started Guide".
See "Setting up Azure load balance monitor resources" in "Notes when creating the cluster configuration data" in "Notes and Restrictions" of the "Getting Started Guide".
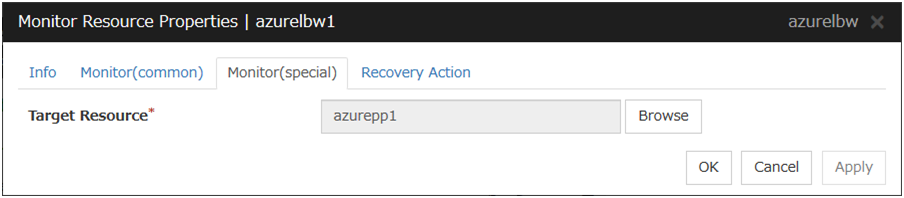
4.48. Understanding Azure DNS monitor resources
Azure DNS monitor resources issue a query to the authoritative DNS server and confirm the soundness of the registered IP address.
Errors are detected when:
The registered IP Address cannot obtained by name resolution of the virtual host name (DNS name).
Failed to acquire the list of DNS servers.
4.48.1. Notes on Azure DNS monitor resources
Azure DNS monitor resources are automatically created when Azure DNS resources are added. A single Azure DNS monitor resource is automatically created for a single Azure DNS resource.
When using public DNS zone, charge occurs for registering the zone and query. Therefore, when Check Name Resolution is set to on, the charge occurs per Interval.
See "Setting up Azure DNS resources" in "Notes when creating the cluster configuration data" in "Notes and Restrictions" of the "Getting Started Guide".
4.48.2. Monitor (special) tab
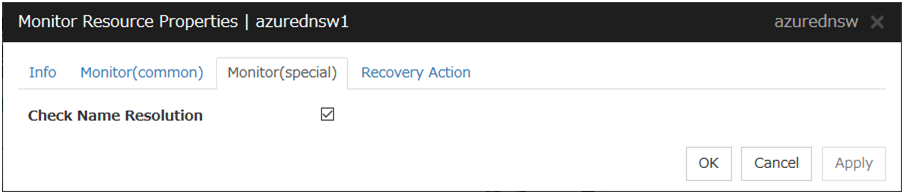
Check Name Resolution
4.49. Understanding Google Cloud Virtual IP monitor resources
Google Cloud Virtual IP monitor resources perform alive monitoring of nodes running Google Cloud Virtual IP resources about control processes which start to run when Google Cloud Virtual IP resources become active. If the process does not start properly, the system takes it as an error. Also, timeout on health check wait time may become an error depending on Action when Health check wait timeout settings.
4.49.1. Notes on Google Cloud Virtual IP monitor resources
Google Cloud Virtual IP monitor resources are added automatically when you add Google Cloud Virtual IP resources. One Google Cloud Virtual IP monitor resource is created automatically for one Google Cloud Virtual IP resource.
Google Cloud Virtual IP monitor resources check if timeout occurs or not on health check wait time in Google Cloud Virtual IP resources. Therefore the monitor interval values of Google Cloud Virtual IP monitor resources must be larger than the Health check timeout values set in the target Google Cloud Virtual IP resources.
Refer to "Google Cloud Virtual IP resource settings" on "Notes when creating the cluster configuration data" in "Notes and Restrictions" of the "Getting Started Guide".
4.49.2. Monitor (special) tab
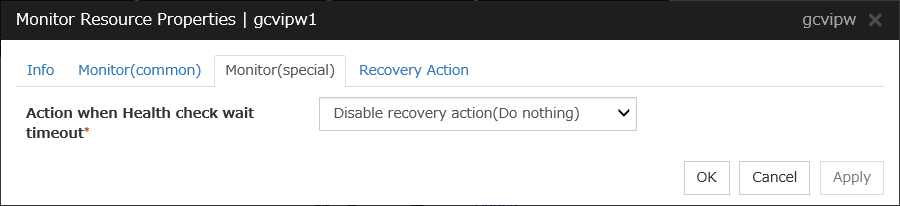
Action when Health check wait timeout
Specifies actions when timeout of health check wait time occurs in Google Cloud Virtual IP resources
4.50. Understanding Google Cloud load balance monitor resources
Google Cloud load balance monitor resources perform monitoring of nodes not running Google Cloud Virtual IP resources and check if the same port number of the health check port number opens.
4.50.1. Notes on Google Cloud load balance monitor resources
Google Cloud load balance monitor resources are added automatically when you add Google Cloud Virtual IP resources. One Google Cloud load balance monitor resource is created automatically for one Google Cloud Virtual IP resource.
Refer to "Setting up Google Cloud Virtual IP resources" on "Notes when creating the cluster configuration data" in "Notes and Restrictions" of the "Getting Started Guide".
Refer to "Setting up Google Cloud load balance monitor resources" on "Notes when creating the cluster configuration data" in "Notes and Restrictions" of the "Getting Started Guide".
4.50.2. Monitor (special) tab
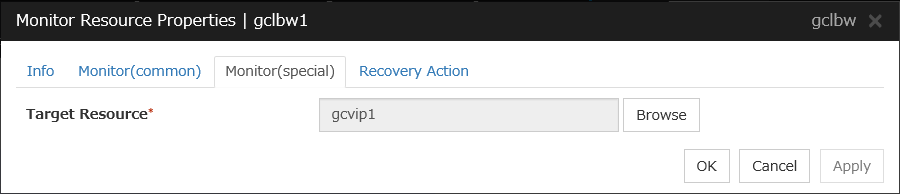
Target Resource
Specifies a name of the target Google Cloud Virtual IP resource.
4.51. Understanding Google Cloud DNS monitor resources
Google Cloud DNS monitor resources checks that Google Cloud DNS has the A records and record sets controlled by Google Cloud DNS resources specified as target resources for monitoring at activation.
4.51.1. Notes on Google Cloud DNS monitor resources
4.51.2. Monitor (special) tab
This tab is not available for Google Cloud DNS monitor resources.
4.52. Understanding Oracle Cloud Virtual IP monitor resources
Oracle Cloud Virtual IP monitor resources perform alive monitoring of nodes running Google Cloud Virtual IP resources about control processes which start to run when Google Cloud Virtual IP resources become active. If the process does not start properly, the system takes it as an error. Also, timeout on health check wait time may become an error depending on Action when Health check wait timeout settings.
4.52.1. Notes on Oracle Cloud Virtual IP monitor resource
Oracle Cloud Virtual IP monitor resources are added automatically when you add Oracle Cloud Virtual IP resources. One Oracle Cloud Virtual IP monitor resource is created automatically for one Oracle Cloud Virtual IP resource.
Oracle Cloud Virtual IP monitor resources check if timeout occurs or not on health check wait time in Oracle Cloud Virtual IP resources. Therefore the monitor interval values of Oracle Cloud Virtual IP monitor resources must be larger than the Health check timeout values set in the target Oracle Cloud Virtual IP resources.
Refer to "Oracle Cloud Virtual IP resource settings" on "Notes when creating the cluster configuration data" in "Notes and Restrictions" of the "Getting Started Guide".
4.52.2. Monitor (special) tab
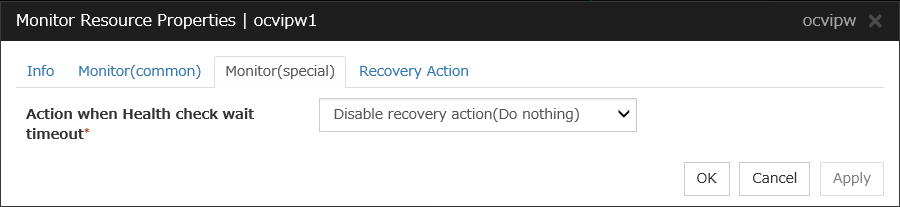
Action when Health check wait timeout
Specifies actions when timeout of health check wait time occurs in Oracle Cloud Virtual IP resources.
4.53. Understanding Oracle Cloud load balance monitor resources
Oracle Cloud load balance monitor resources perform monitoring of nodes not running Oracle Cloud Virtual IP resources and check if the same port number of the health check port number opens.
4.53.1. Notes on Oracle Cloud load balance monitor resources
Oracle Cloud load balance monitor resources are added automatically when you add Oracle Cloud Virtual IP resources. One Oracle Cloud load balance monitor resource is created automatically for one Oracle Cloud Virtual IP resource.
Refer to "Setting up Oracle Cloud Virtual IP resources" on "Notes when creating the cluster configuration data" in "Notes and Restrictions" of the "Getting Started Guide".
Refer to "Setting up Oracle Cloud load balance monitor resources" on "Notes when creating the cluster configuration data" in "Notes and Restrictions" of the "Getting Started Guide".
4.53.2. Monitor (special) tab
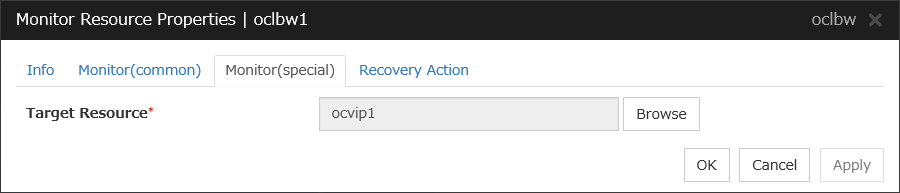
Target Resource
Specifies a name of the target Oracle Cloud Virtual IP resource.