4. Monitor resource details
This chapter provides detailed information on monitor resources. Monitor resource is a unit to perform monitoring.
This chapter covers:
4.31. Understanding Oracle Clusterware Synchronization Management monitor resources
4.52. Understanding Google Cloud Virtual IP monitor resources
4.53. Understanding Google Cloud load balance monitor resources
4.54. Understanding Oracle Cloud Virtual IP monitor resources
4.55. Understanding Oracle Cloud load balance monitor resources
4.1. Monitor resource
A monitor resource refers to a resource that monitors a specified target to be monitored. When detecting an error in a target to be monitored, a monitor resource restarts a group resource and/or executes failover.
Currently supported monitor resources:
Monitor resource name |
Abbreviation |
Functional overview |
Supported version |
|---|---|---|---|
Disk Monitor Resrource |
diskw |
4.0.0-1 or later |
|
IP Monitor Resource |
ipw |
4.0.0-1 or later |
|
Floating IP Monitor Resource |
fipw |
4.0.0-1 or later |
|
NIC Link Up/Down Monitor Resource |
miiw |
4.0.0-1 or later |
|
Mirror Disk Connect Monitor Resource |
mdnw |
See " Understanding mirror disk connect monitor resources ". |
4.0.0-1 or later |
Mirror Disk Monitor Resource |
mdw |
4.0.0-1 or later |
|
Hybrid Disk Connect Monitor Resource |
hdnw |
4.0.0-1 or later |
|
Hybrid Disk Monitor Resource |
hdw |
4.0.0-1 or later |
|
PID Monitor Resource |
pidw |
4.0.0-1 or later |
|
User-Mode Monitor Resource |
userw |
4.0.0-1 or later |
|
Multi Target Monitor Resource |
mtw |
4.0.0-1 or later |
|
Virtual IP Monitor Resource |
vipw |
4.0.0-1 or later |
|
ARP Monitor Resource |
arpw |
4.0.0-1 or later |
|
Custom Monitor Resource |
genw |
4.0.0-1 or later |
|
Volume Manager Monitor Resource |
volmgrw |
4.0.0-1 or later |
|
Message Receive Monitor Resource |
mrw |
4.0.0-1 or later |
|
VM Monitor Resource |
vmw |
4.0.0-1 or later |
|
Dynamic DNS Monitor Resource |
ddns |
4.0.0-1 or later |
|
Process Name Monitor Resource |
psw |
4.0.0-1 or later |
|
BMC Monitor Resource |
bmcw |
4.0.0-1 or later |
|
DB2 Monitor Resource 1 |
db2w |
4.0.0-1 or later |
|
FTP Monitor Resource 1 |
ftpw |
4.0.0-1 or later |
|
HTTP Monitor Resource 1 |
httpw |
4.0.0-1 or later |
|
IMAP4 Monitor Resource 1 |
imap4w |
4.0.0-1 or later |
|
MySQL Monitor Resource 1 |
mysqlw |
4.0.0-1 or later |
|
NFS Monitor Resource 1 |
nfsw |
4.0.0-1 or later |
|
ODBC Monitor Resource 1 |
odbcw |
4.0.0-1 or later |
|
Oracle Monitor Resource |
oraclew |
4.0.0-1 or later |
|
Oracle Clusterware Synchronization Management Monitor Resource |
osmw |
See "Understanding Oracle Clusterware Synchronization Management monitor resources". |
4.0.0-1 or later |
POP3 Monitor Resource 1 |
pop3w |
4.0.0-1 or later |
|
PostgreSQL Monitor Resource 1 |
psqlw |
4.0.0-1 or later |
|
Samba Monitor Resource 1 |
sambaw |
4.0.0-1 or later |
|
SMTP Monitor Resource 1 |
smtpw |
4.0.0-1 or later |
|
SQL Server Monitor Resource 1 |
sqlserverw |
4.0.0-1 or later |
|
Sybase Monitor Resource 1 |
sybasew |
4.0.0-1 or later |
|
Tuxedo Monitor Resource 1 |
tuxw |
4.0.0-1 or later |
|
Weblogic Monitor Resource 1 |
wlsw |
4.0.0-1 or later |
|
Websphere Monitor Resource 1 |
wasw |
4.0.0-1 or later |
|
WebOTX Monitor Resource 1 |
otxw |
4.0.0-1 or later |
|
JVM Monitor Resource 1 |
jraw |
4.0.0-1 or later |
|
System Monitor Resource 1 |
sraw |
4.0.0-1 or later |
|
Process Resource Monitor Resource 1 |
psrw |
4.1.0-1 or later |
|
AWS Elastic IP Monitor Resource |
awseipw |
4.0.0-1 or later |
|
AWS Virtual IP Monitor Resource |
awsvipw |
4.0.0-1 or later |
|
AWS AZ Monitor Resource |
awsazw |
4.0.0-1 or later |
|
AWS DNS Monitor Resource |
awsdnsw |
4.0.0-1 or later |
|
Azure Probe Port Monitor Resource |
azureppw |
4.0.0-1 or later |
|
Azure Load Balance Monitor Resource |
azurelbw |
4.0.0-1 or later |
|
Azure DNS Monitor Resource |
azurednsw |
4.0.0-1 or later |
|
Google Cloud Virtual IP Monitor Resource |
gcvipw |
See "Understanding Google Cloud Virtual IP monitor resources". |
4.2.0-1~ |
Google Cloud Load Balance Monitor Resource |
gclbw |
See "Understanding Google Cloud load balance monitor resources". |
4.2.0-1~ |
Oracle Cloud Virtual IP Monitor Resource |
ocvipw |
See "Understanding Oracle Cloud Virtual IP monitor resources". |
4.2.0-1~ |
Oracle Cloud Load Balance Monitor Resource |
oclbw |
See "Understanding Oracle Cloud load balance monitor resources". |
4.2.0-1~ |
- 1(1,2,3,4,5,6,7,8,9,10,11,12,13,14,15,16,17,18,19,20)
To use this monitor resource, you need to register a license. For details on how to register a license, see the "Installation and Configuration Guide".
4.1.1. Status of monitor resources after monitoring starts
The status of some monitor resources might be "Caution" if there is a period of time following the start of monitoring in which monitoring of that resource is not yet ready.
Caution status is possible for the following monitor resources.
Dynamic DNS Monitor ResourceMessage Receive Monitor ResourceCustom Monitor Resource (whose monitor type is Asynchronous)Virtual IP Monitor ResourceDB2 Monitor ResourceBMC Monitor ResourceSystem Monitor ResourceProcess Resource Monitor ResourceJVM Monitor ResourceMySQL Monitor ResourceODBC Monitor ResourceOracle Monitor ResourceOracle Clusterware Synchronization Management Monitor ResourcePostgresSQL Monitor ResourceProcess Name Monitor ResourceSQL Server Monitor ResourceSybase Monitor Resource
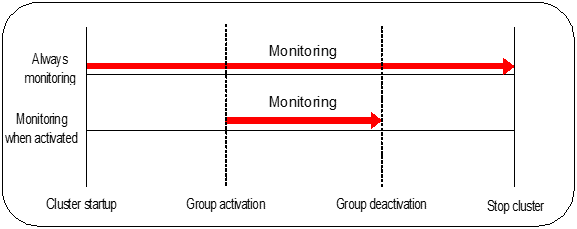
4.1.2. Monitor timing of monitor resource
There are two types of monitoring by monitor resources; Always and Active.
The monitoring timing differs depending on monitor resources:
- Always:Monitoring is performed by monitor resource all the time.
- Active:Monitoring is performed by monitor recourse while specified group resource is active. Monitor resource does not monitor while group resource is not activated.
Monitor resource |
Monitor timing |
Target resource |
|---|---|---|
Disk Monitor Resource |
Always or when activated |
All |
IP Monitor Resource |
Always or when activated |
All |
User-Mode Monitor Resource |
Always (Fixed) |
- |
Mirror Disk Monitor Resource |
Always (Fixed) |
- |
Mirror Disk Connect Monitor Resource |
Always (Fixed) |
- |
Hybrid Disk Monitor Resource |
Always (Fixed) |
- |
Hybrid Disk Connect Monitor Resource |
Always (Fixed) |
- |
NIC Link Up/Down Monitor resource |
Always or when activated |
All |
PID Monitor resource |
Fixed to while activating |
exec |
Multi Target Monitor Resource |
Always or when activated |
All |
Virtual IP Monitor Resource |
When activated (Fixed) |
vip |
ARP Monitor Resource |
When activated (Fixed) |
fip, vip |
Custom Monitor resource |
Always or when activated |
All |
VM Monitor Resource |
Always (Fixed) |
vm |
Message Receive Monitor Resource |
Always or when activated |
mrw |
Volume Manager Monitor Resource |
Always or when activated |
volmgr |
Dynamic DNS Monitor Resource |
Always (Fixed) |
ddns |
Process Name Monitor Resource |
Always or when activated |
All |
BMC Monitor Resource |
Always (Fixed) |
- |
DB2 Monitor Resource |
When activated (Fixed) |
exec |
FTP Monitor Resource |
Always or when activated |
exec |
HTTP Monitor Resource |
Always or when activated |
exec |
IMAP4 Monitor Resource |
Always or when activated |
exec |
MySQL Monitor Resource |
When activated (Fixed) |
exec |
NFS Monitor Resource |
Always or when activated |
exec |
ODBC Monitor Resource |
When activated (Fixed) |
exec |
Oracle Monitor Resource |
When activated (Fixed) |
exec |
Oracle Clusterware Synchronization Management Monitor Resource |
Always (Fixed) |
- |
POP3 Monitor Resource |
When activated (Fixed) |
exec |
PostgreSQL Monitor Resource |
When activated (Fixed) |
exec |
Samba Monitor Resource |
Always or when activated |
exec |
SMTP Monitor Resource |
Always or when activated |
exec |
SQL Server Monitor Resource |
When activated (Fixed) |
exec |
Sybase Monitor Resource |
When activated (Fixed) |
exec |
Tuxedo Monitor Resource |
Always or when activated |
exec |
Weblogic Monitor Resource |
Always or when activated |
exec |
Websphere Monitor Resource |
Always or when activated |
exec |
WebOTX Monitor Resource |
Always or when activated |
exec |
JVM Monitor Resource |
Always or when activated |
exec |
System Monitor Resource |
Always (Fixed) |
All |
Process Resource Monitor Resource |
Always (Fixed) |
All |
Floating IP Monitor Resource |
When activated (Fixed) |
fip |
AWS Elastic IP Monitor resource |
When activated (Fixed) |
awseip |
AWS Virtual IP Monitor resource |
When activated (Fixed) |
awsvip |
AWS AZ Monitor resource |
Always (Fixed) |
- |
AWS DNS Monitor resource |
When activated (Fixed) |
awsdns |
Azure probe port monitor resource |
When activated (Fixed) |
azurepp |
Azure load balance monitor resource |
Always (Fixed) |
azurepp |
Azure DNS Monitor resource |
When activated (Fixed) |
azuredns |
Google Cloud Virtual IP monitor resource |
When activated (Fixed) |
gcvip |
Google Cloud load balance monitor resource |
Always (Fixed) |
gcvip |
Oracle Cloud Virtual IP monitor resource |
When activated (Fixed) |
ocvip |
Oracle Cloud load balance monitor resource |
Always (Fixed) |
ocvip |
4.1.3. Suspending and resuming monitoring on monitor resources
Operation on the Cluster WebUI
- Operation by the clpmonctrl commandThe clpmonctrl command can control monitor resources on a server where the command is run or on a specified server.
Some monitor resources can suspend and resume monitoring and others cannot. For details, see the list below.
Monitor Resource |
Control |
|---|---|
Disk Monitor Resource |
Possible |
IP Monitor Resource |
Possible |
User-mode Monitor Resource |
Possible |
Mirror Disk Monitor Resource |
Possible |
Mirror Disk Connect Monitor Resource |
Possible |
Hybrid Disk Monitor Resource |
Possible |
Hybrid Disk Connect Monitor Resource |
Possible |
NIC Link Up/Down Monitor Resource |
Possible |
PID Monitor Resource |
Possible |
Multi Target Monitor Resource |
Possible |
Virtual IP Monitor Resource |
Impossible |
ARP Monitor Resource |
Impossible |
Custom Monitor Resource |
Possible |
VM Monitor Resource |
Possible |
Message Receive Monitor Resource |
Possible |
Volume Manager Monitor Resource |
Possible |
Dynamic DNS Monitor Resource |
Impossible |
Process Name Monitor Resource |
Possible |
BMC Monitor Resource |
Possible |
DB2 Monitor Resource |
Possible |
FTP Monitor Resource |
Possible |
HTTP Monitor Resource |
Possible |
IMAP4 Monitor Resource |
Possible |
MySQL Monitor Resource |
Possible |
NFS Monitor Resource |
Possible |
ODBC Monitor Resource |
Possible |
Oracle Monitor Resource |
Possible |
Oracle Clusterware Synchronization Management Monitor Resource |
Possible |
POP3 Monitor Resource |
Possible |
PostgreSQL Monitor Resource |
Possible |
Samba Monitor Resource |
Possible |
SMTP Monitor Resource |
Possible |
SQl Server Monitor Resource |
Possible |
Sybase Monitor Resource |
Possible |
Tuxedo Monitor Resource |
Possible |
Websphere Monitor Resource |
Possible |
Weblogic Monitor Resource |
Possible |
WebOTX Monitor Resource |
Possible |
JVM Monitor Resource |
Possible |
System Monitor Resource |
Possible |
Process Resource Monitor Resource |
Possible |
Floating IP Monitor Resource |
Possible |
AWS Elastic IP Monitor resource |
Possible |
AWS Virtual IP Monitor resource |
Possible |
AWS AZ Monitor resource |
Possible |
AWS DNS Monitor resource |
Possible |
Azure probe port monitor resource |
Possible |
Azure load balance monitor resource |
Possible |
Azure DNS Monitor resource |
Possible |
Google Cloud Virtual IP monitor resource |
Possible |
Google Cloud load balance monitor resource |
Possible |
Oracle Cloud Virtual IP monitor resource |
Possible |
Oracle Cloud load balance monitor resource |
Possible |
On the Cluster WebUI, shortcut menus of the monitor resources which cannot control monitoring are disabled. The clpmonctrl command only controls the resources which can control monitoring. For monitor resources which cannot control monitoring, a warning message is displayed and controls are not performed.
Suspending monitoring on a monitor resource is disabled if one of the following operations is performed.
Resume operation on Cluster WebUI
Resume operation by using the clpmonctrl command
Stop the cluster
Suspend the cluster
4.1.4. Enabling and disabling dummy failure of monitor resources
You can enable and disable dummy failure of monitor resources. Use one of the following methods to enable or disable dummy failure.
- Operation on Cluster WebUI (verification mode)On the Cluster WebUI (verification mode), shortcut menus of the monitor resources which cannot control monitoring are disabled.
- Operation by using the clpmonctrl commandThe clpmonctrl command can control the server where this command is run or the monitor resources of the specified server. When the clpmonctrl command is executed on monitor resource which cannot be controlled, dummy failure is not enabled even though the command succeeds.
Dummy failure of a monitor resource is disabled if the following operations are performed.
Dummy failure was disabled on Cluster WebUI (verification mode)
"Yes" was selected from the dialog box displayed when the Cluster WebUI mode changes from verification mode to a different mode.
-n was specified to enable dummy failure by using the clpmonctrl command
Stop the cluster
Suspend the cluster
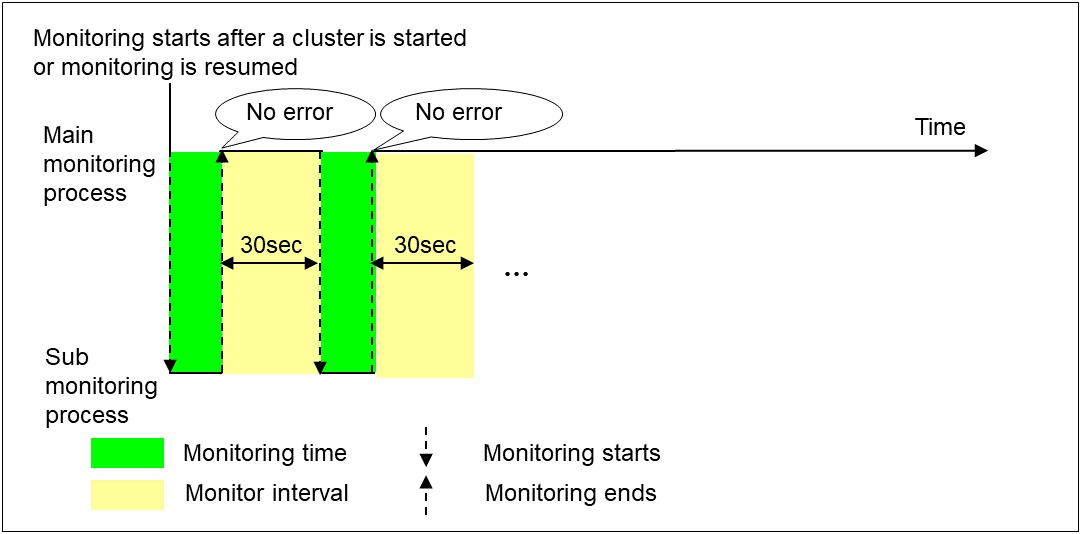
4.1.5. Monitoring interval for monitor resource
All monitor resources except the user-mode monitor resource monitors their targets at every monitor interval.
The following illustrates the timeline of how a monitor resource monitors its target and finds error/no error with the configuration below:
When no error is detected
Examples of behavior when the following values are set.
When an error is detected (without monitor retry setting)
Examples of behavior when the following values are set.
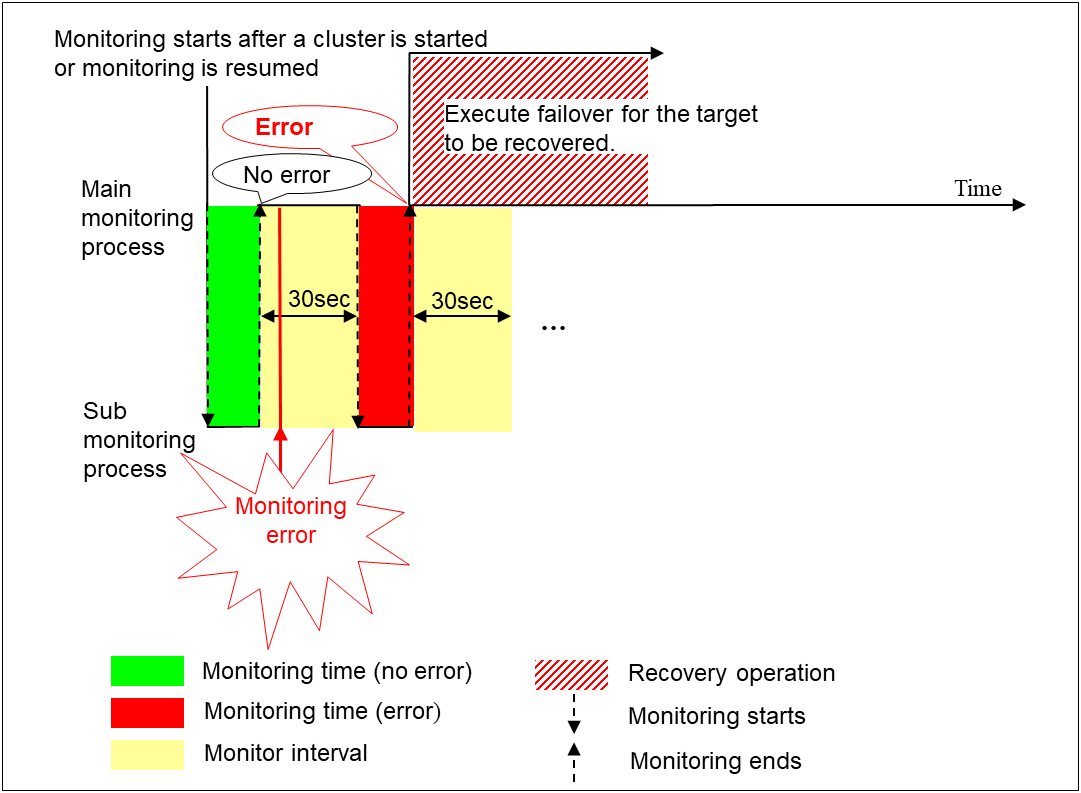
When an error occurs, it is detected at the next monitoring and the recovery operation for the recovery target starts.
When an error is detected (with monitor retry settings)
Examples of behavior when the following values are set.
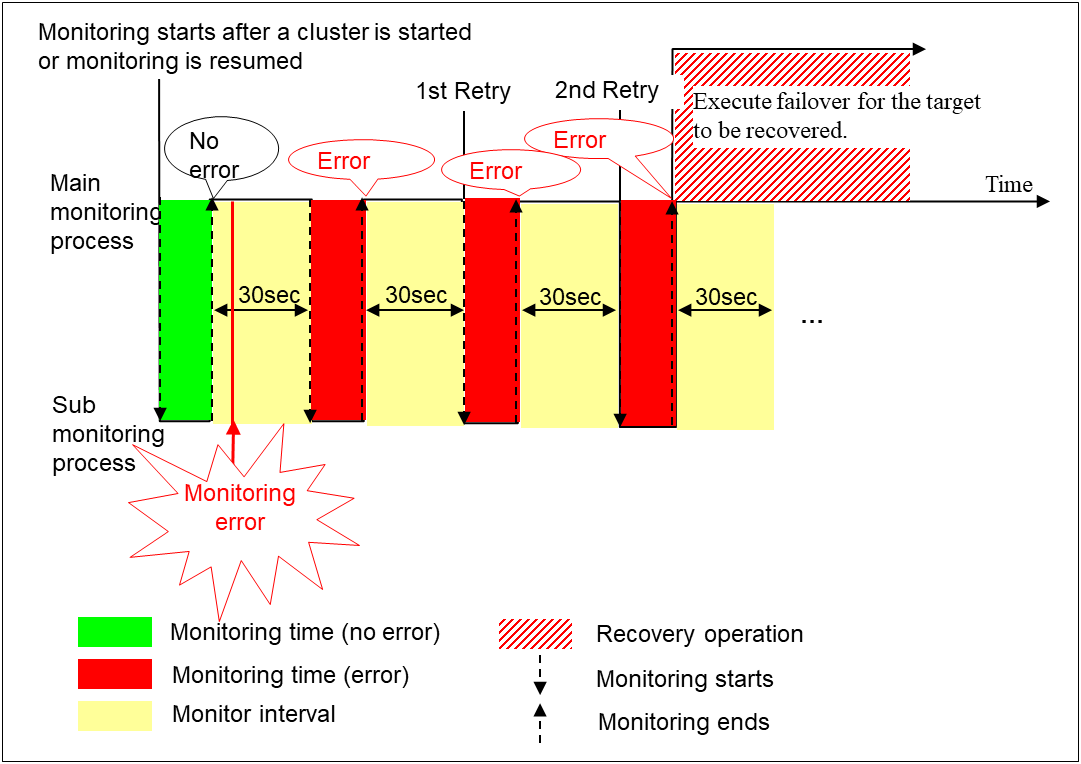
When an error occurs, it is detected at the next monitoring. If recovery cannot be achieved within the monitor retries, the failover is started for the recovery target.
When an error is detected (without monitor retry settings)
Examples of behavior when the following values are set.
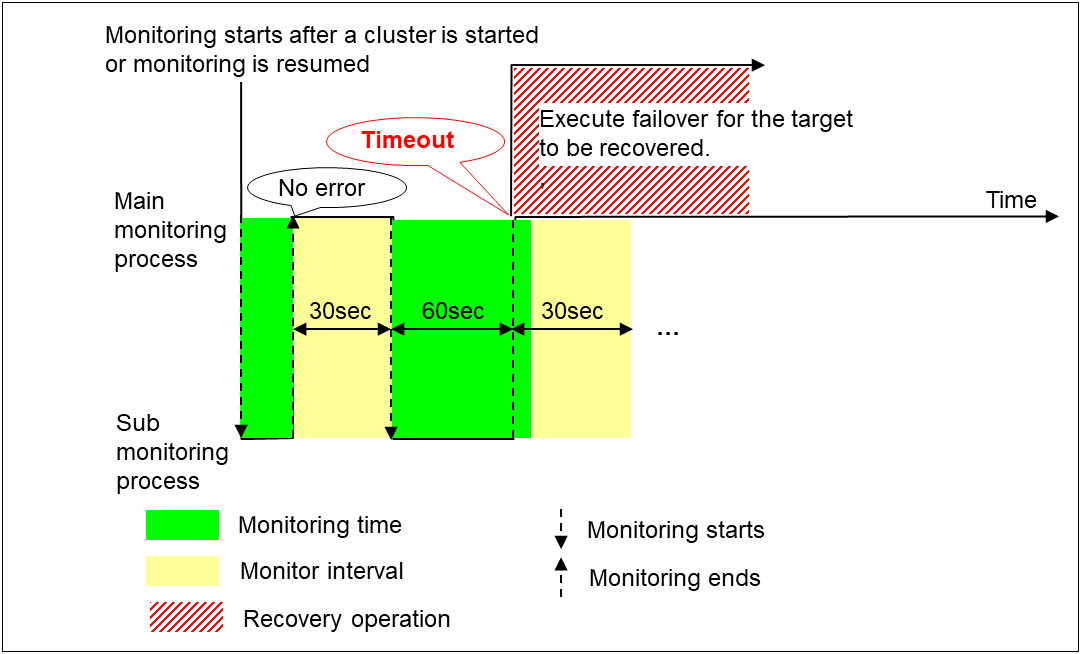
Immediately after an occurrence of a monitoring timeout, the failover for the recovery target starts.
When a monitoring timeout is detected (with monitor retry setting)
Examples of behavior when the following values are set.
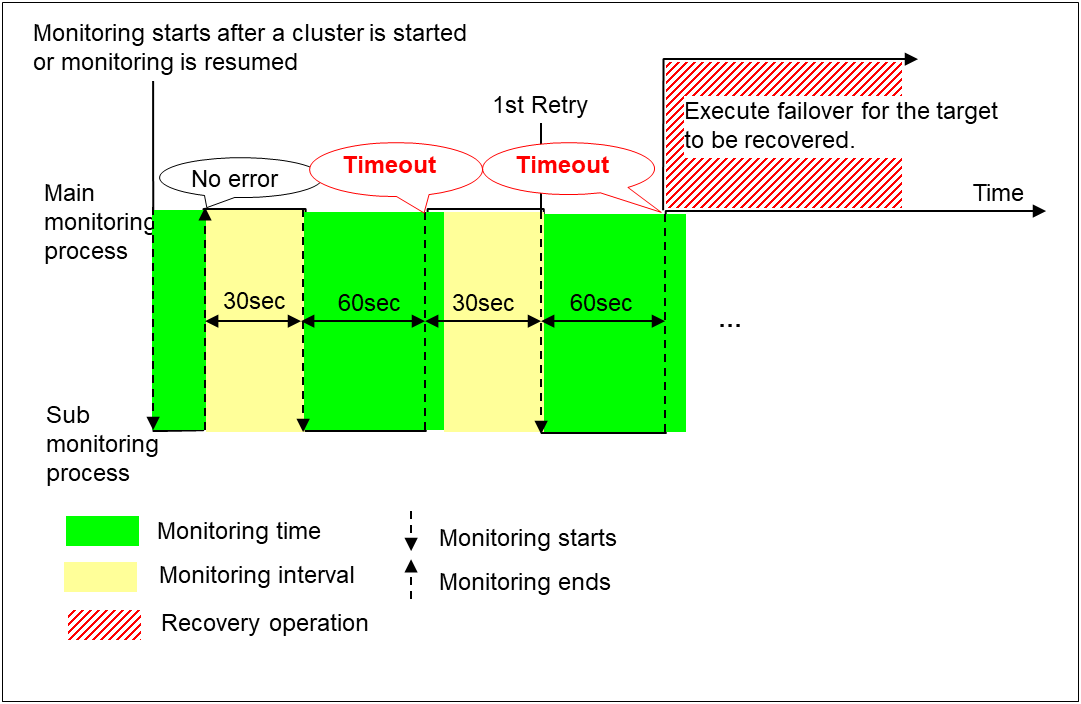
When a monitoring timeout occurs, monitor retry is performed and failover is started for the recovery target.
4.1.6. Action when an error is detected by monitor resource
When an error is detected, the following recovery actions are taken against the recovery target in sequence:
Execution of recovery script: this takes place when an error is detected in a monitor target.
Reactivation of the recovery target: this takes place if the recovery script is executed up to the recovery script execution count. When the execution of a pre-reactivation script is specified, reactivation starts after that script has been executed.
Failover: this takes place when reactivation fails for the number of times set in the reactivation threshold. When the execution of a pre-failover script is specified, failover starts after that script has been executed.
Final action: this takes place when the error is detected even after the failover is executed for the number of times set in the failover threshold. When the execution of a pre-final-action script is specified, the final action starts after that script has been executed.
No recovery action is taken if the status of the recovery target is:
Recovery target |
Status |
Reactivation 2 |
Failover 3 |
Final action 4 |
|---|---|---|---|---|
Group resource/
Failover group
|
Already stopped |
No |
No |
No |
Being activated/stopped |
No |
No |
No |
|
Already activated |
Yes |
Yes |
Yes |
|
Error |
Yes |
Yes |
Yes |
|
Local Server |
- |
- |
- |
Yes |
Yes: Recovery action is taken No: Recovery action is not taken
- 2
Effective only when the value for the reactivation threshold is set to 1 (one) or greater.
- 3
Effective only when the value for the failover threshold is set to 1 (one) or greater.
- 4
Effective only when an option other than No Operation is selected.
Note
Do not work on the following operations by running commands or using the Cluster WebUI when a group resource (e.g. disk resource, EXEC resource) is set as a recovery target in the settings of error detection for the monitor resource, and recovery is in progress (reactivation -> failover -> final action) after detection of an error:
Stop/suspend the cluster
Start/stop/move a group
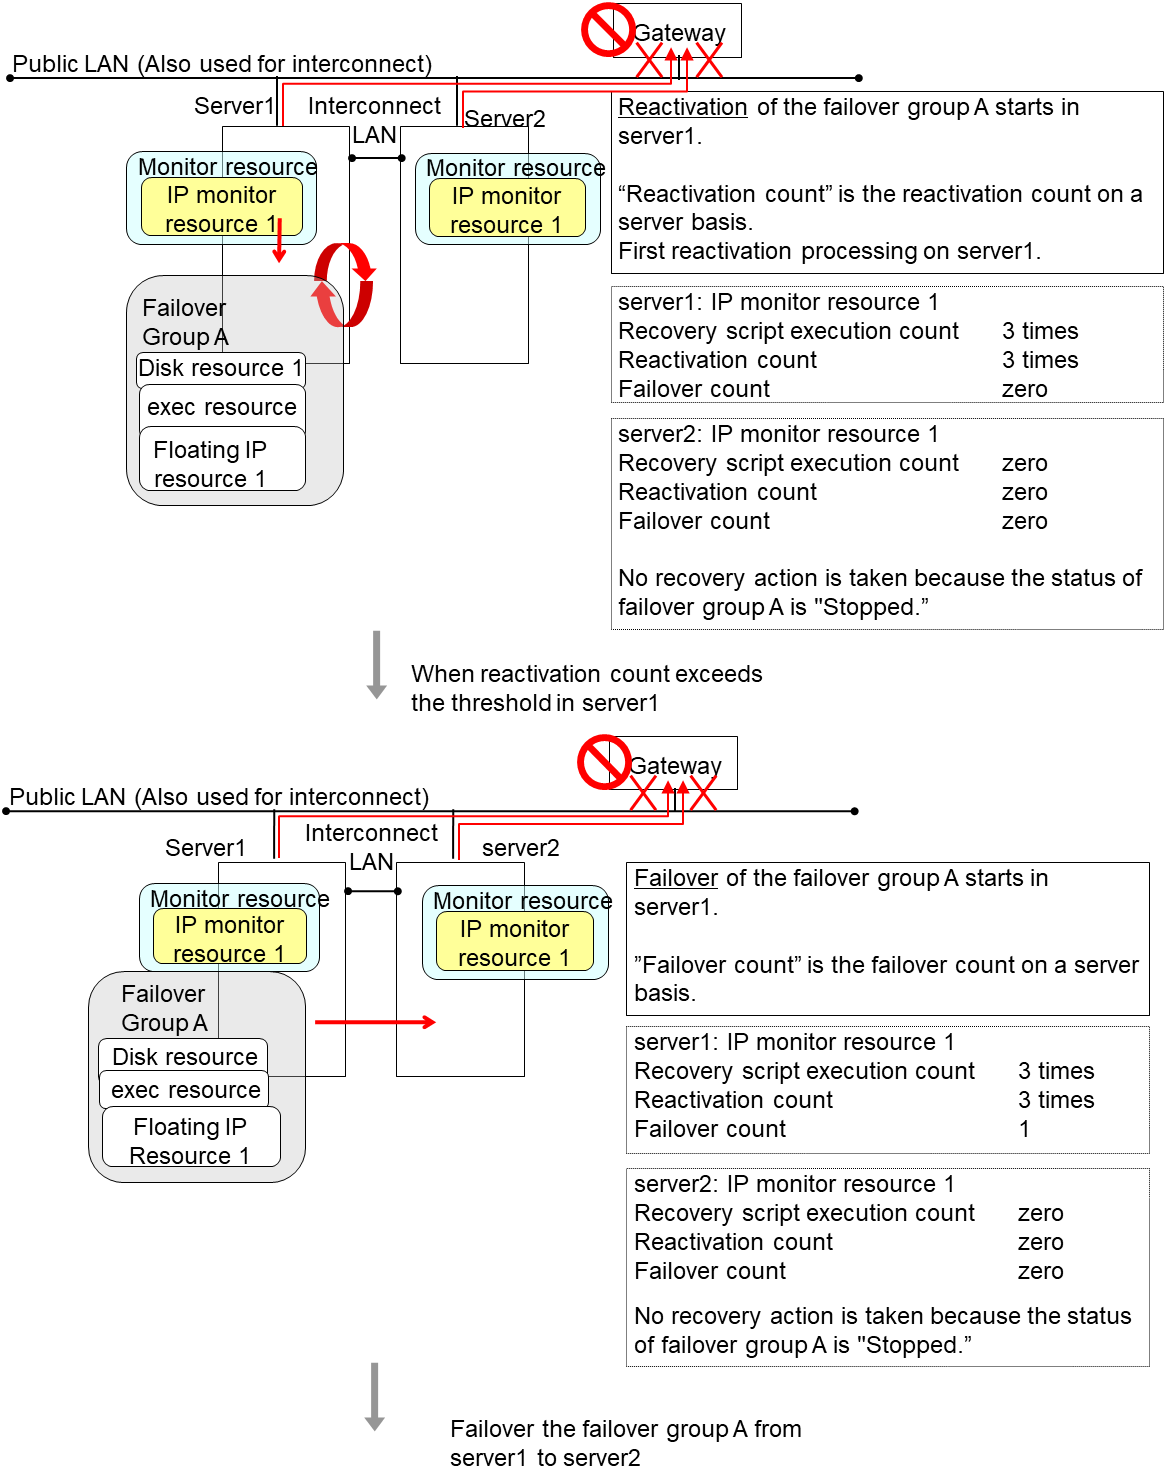
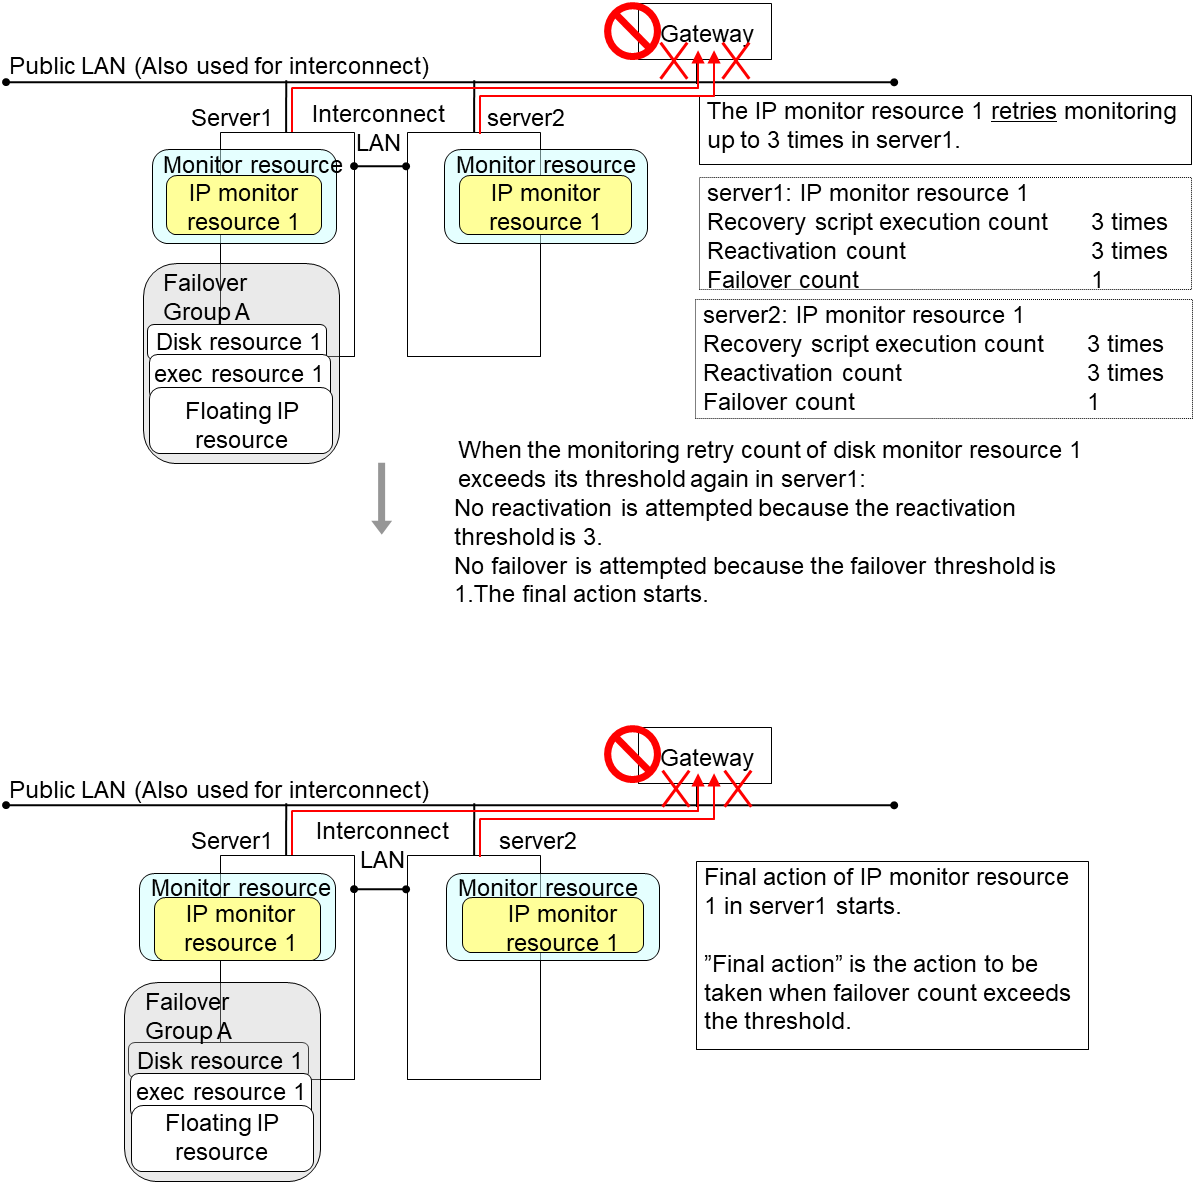
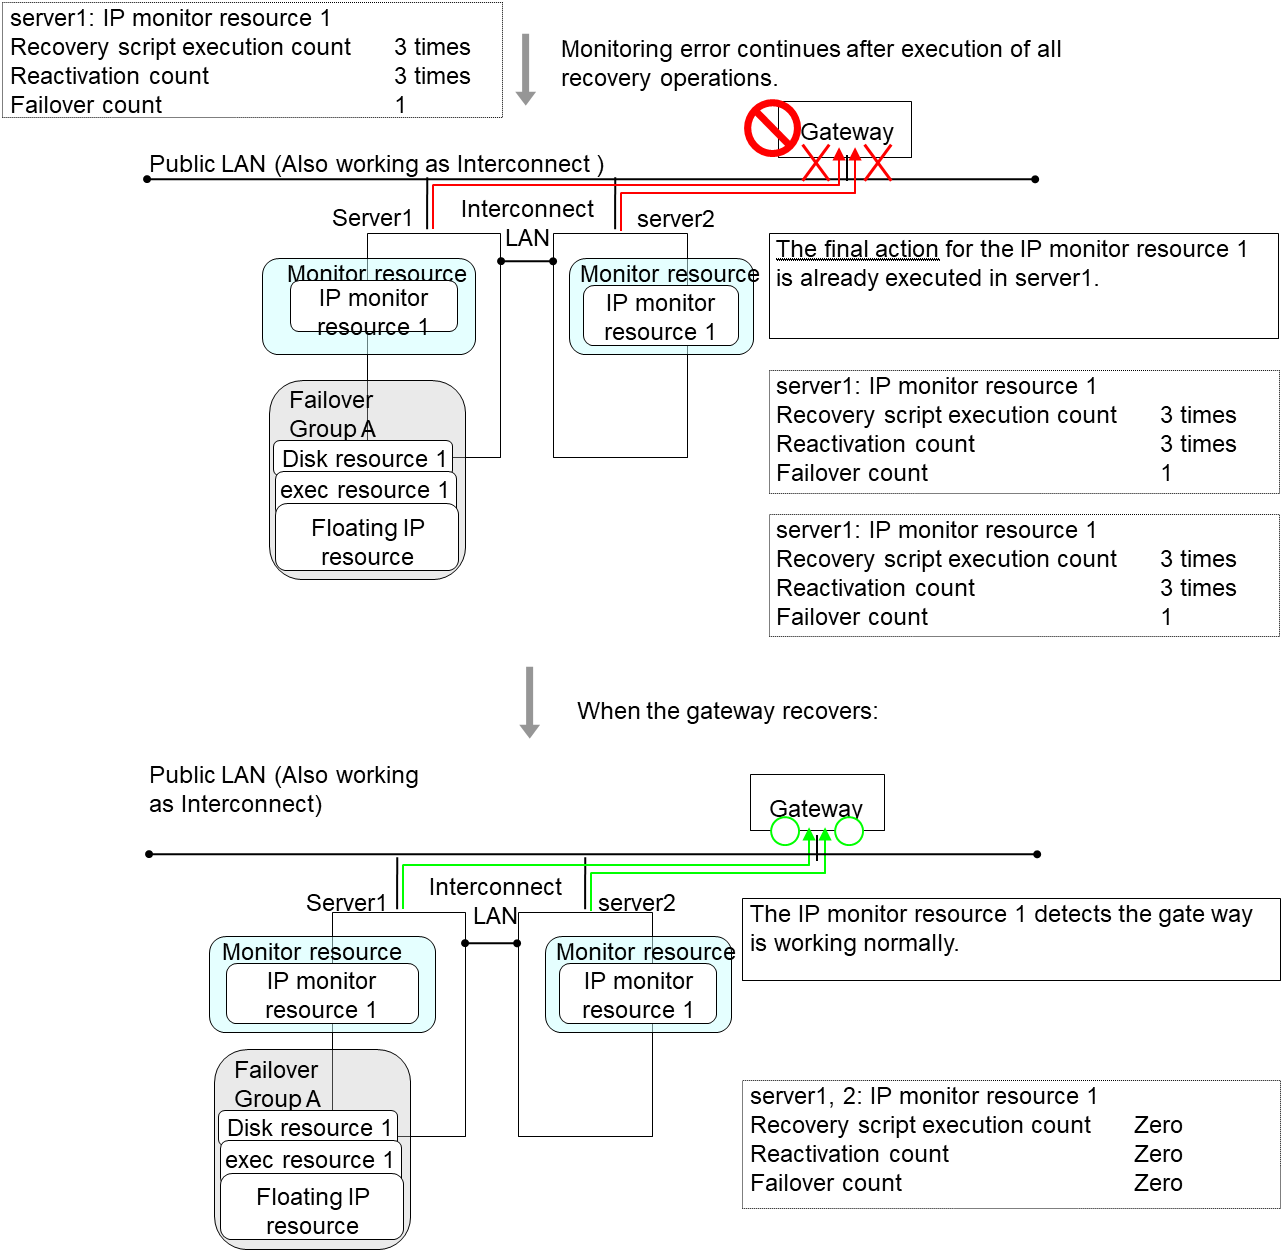
The following is an example of the progress when only one server detects an error while the gateway is specified as an IP resource of the IP monitor resource:
Examples of behavior when the following values are set.
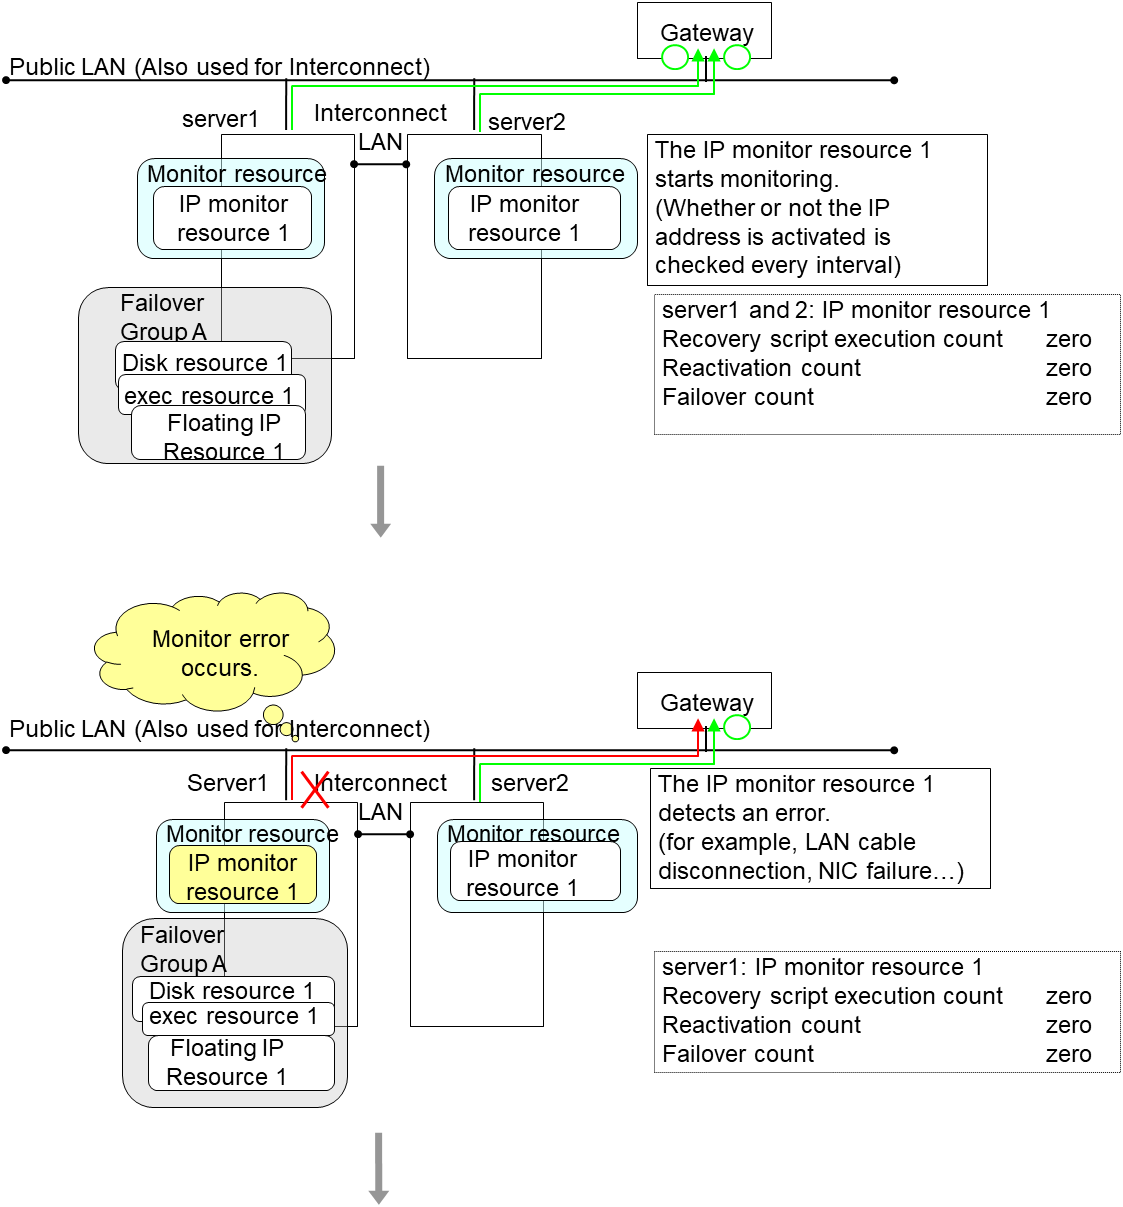
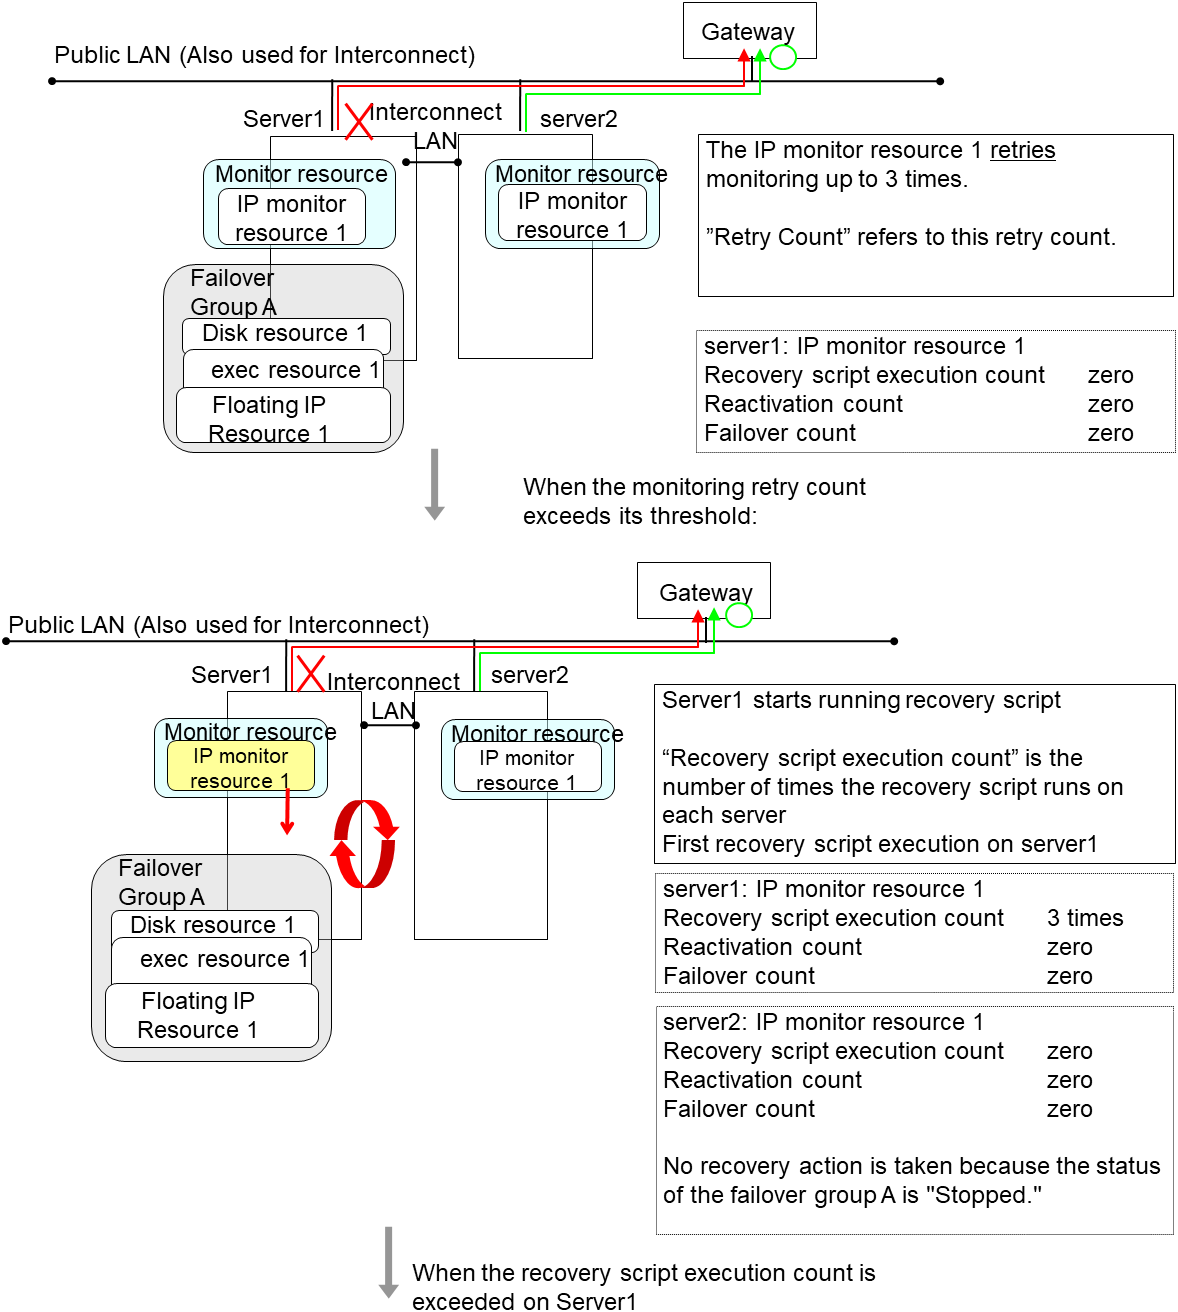
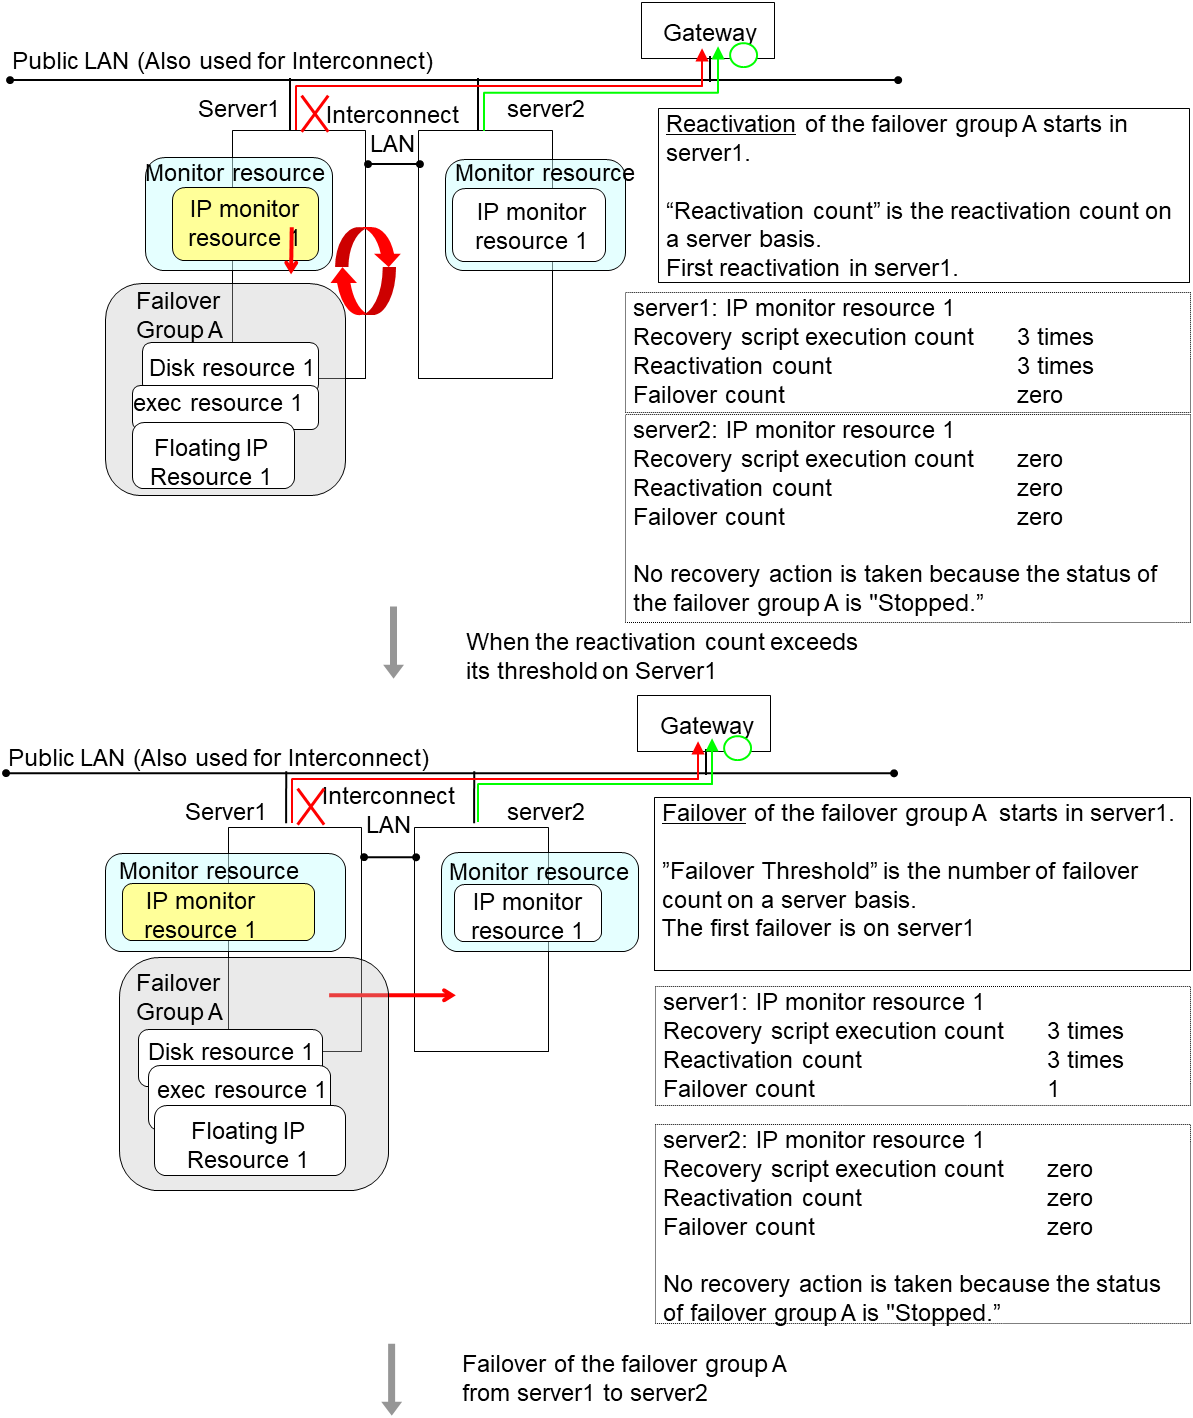
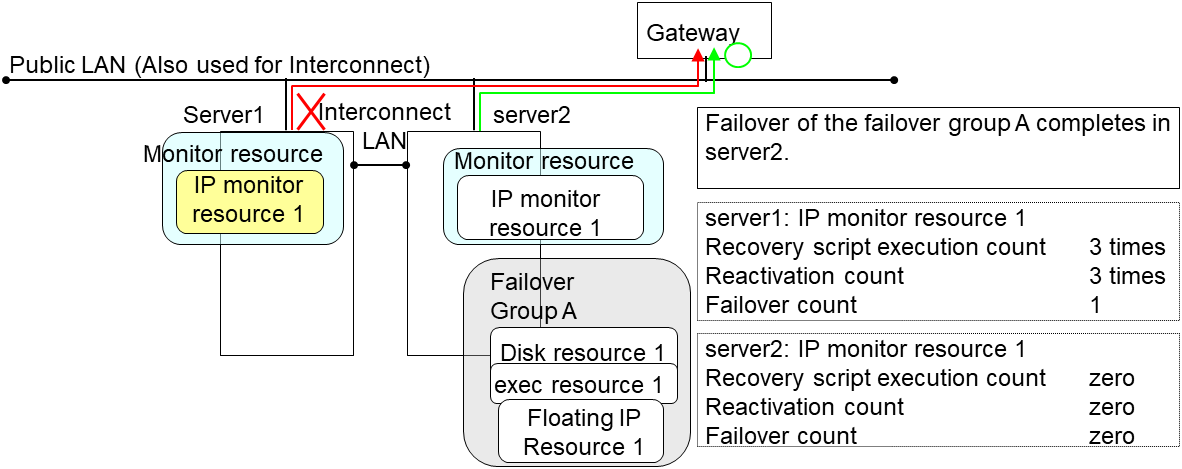
In server2, the operation can continue by failover of the Failover Group A because the IP monitor resource 1 is running properly.
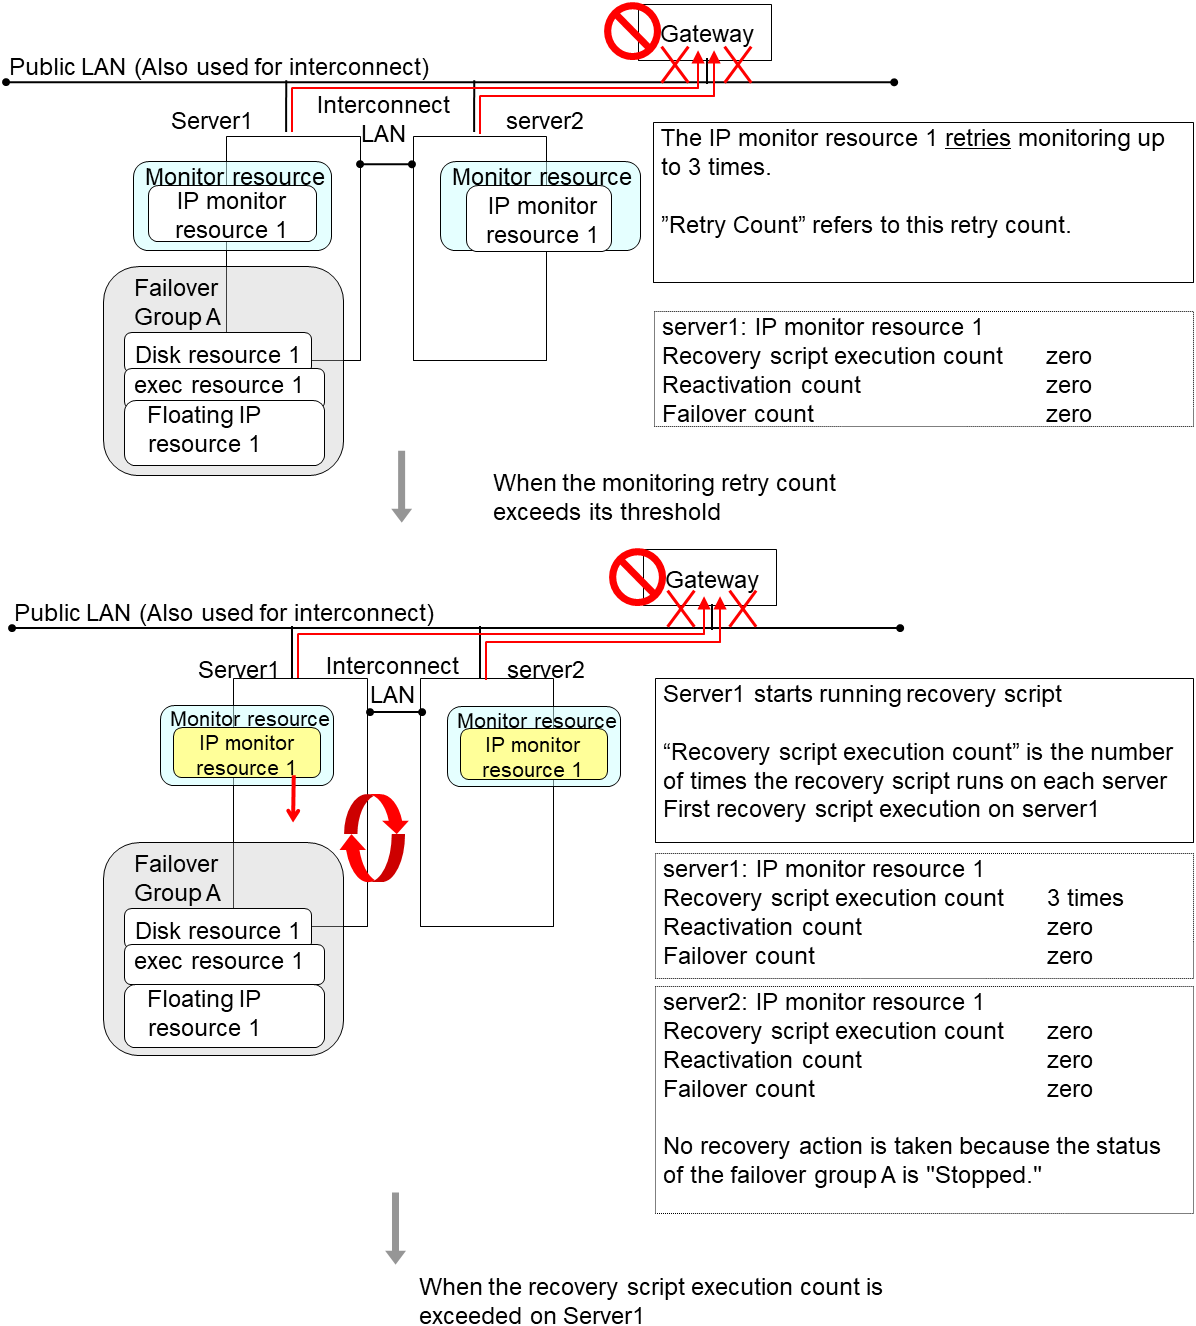
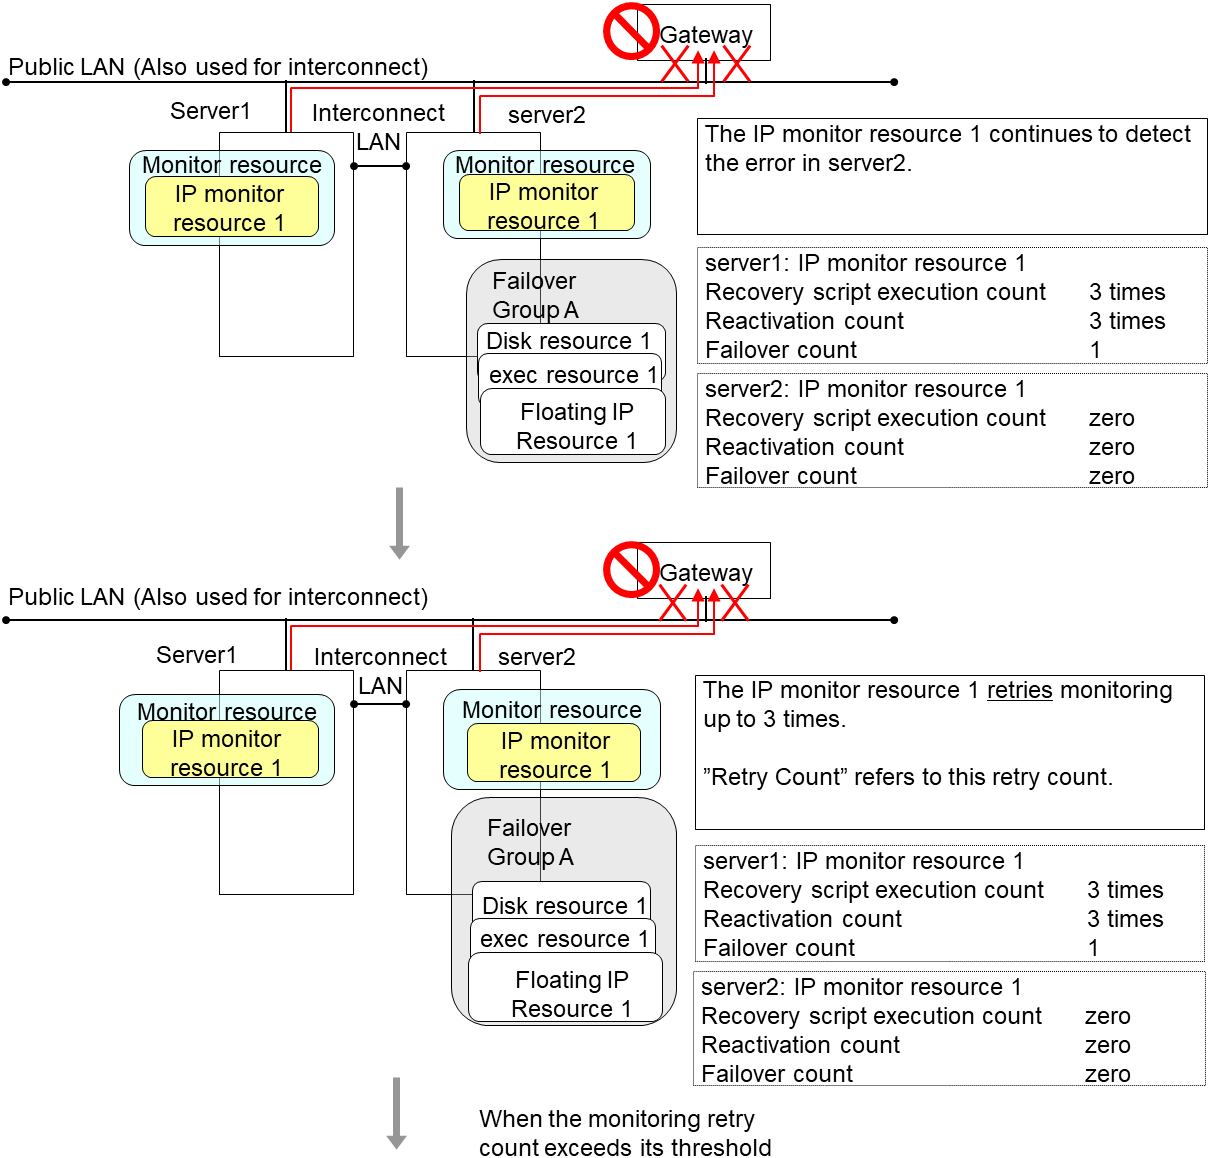
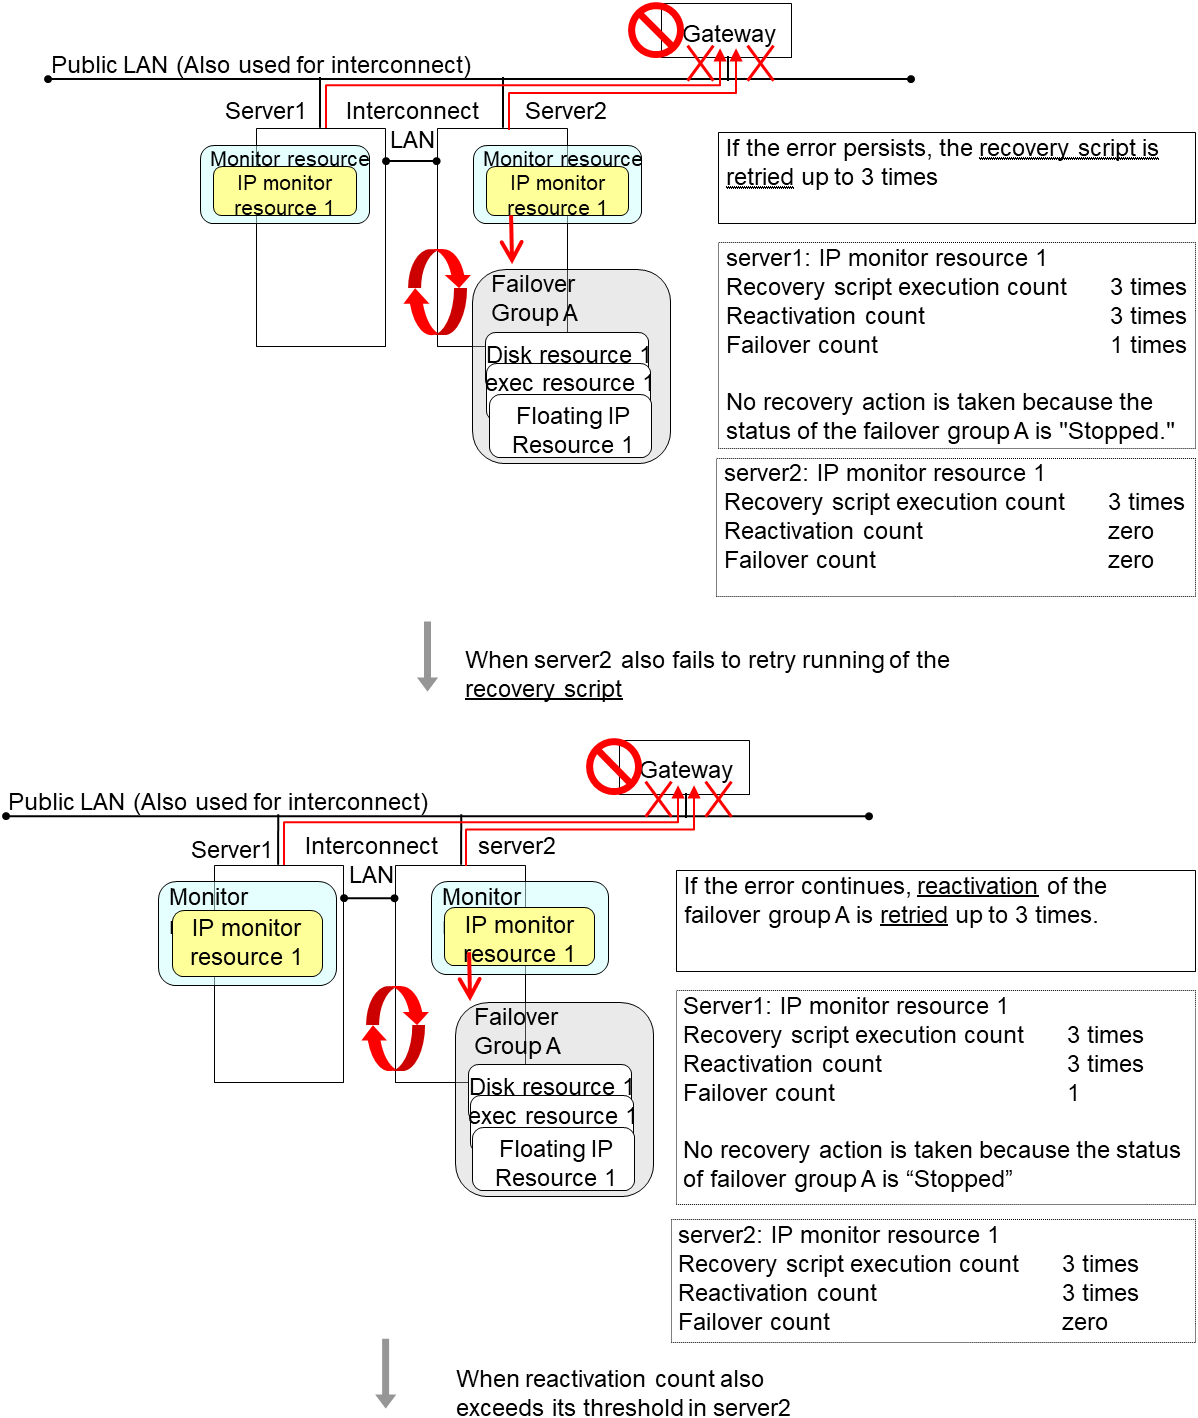
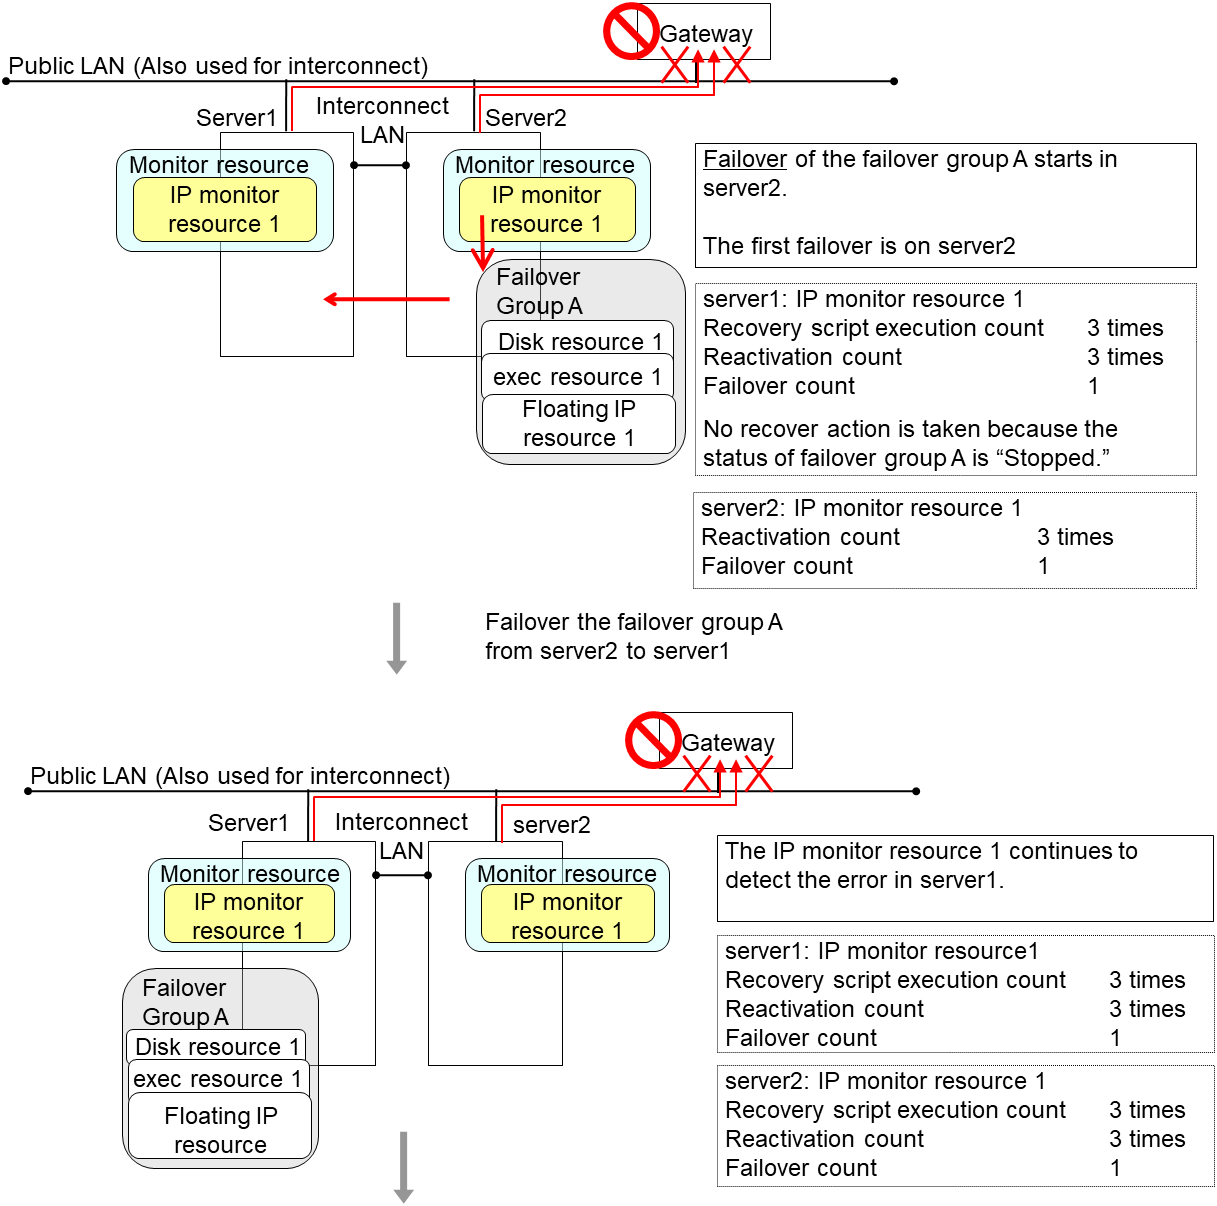
The following is an example of the process when both servers detect an error while the gateway is specified as an IP resource of the IP monitor resource.
Examples of behavior when the following values are set.
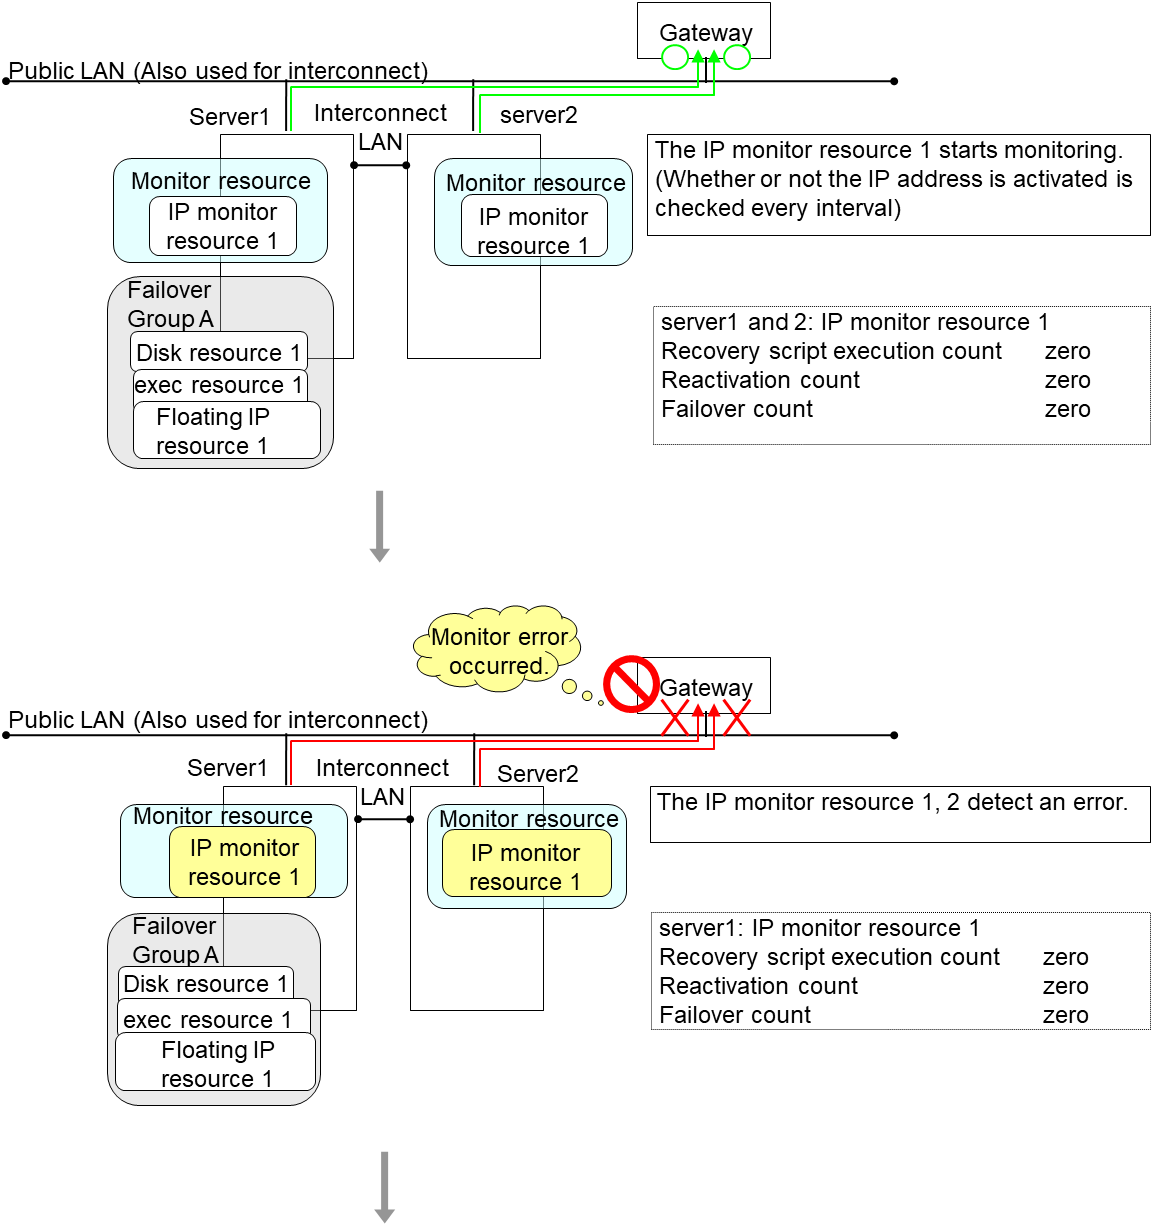
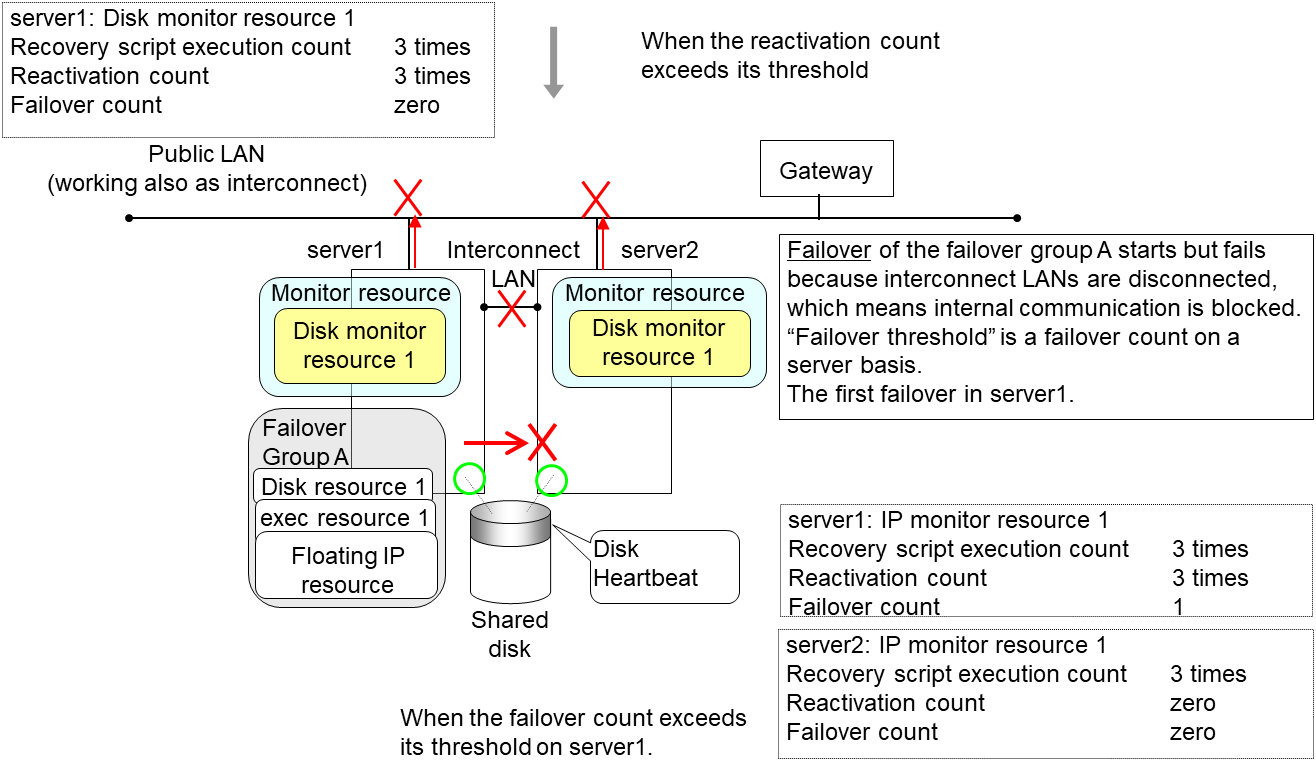
The description up to here assumed the interconnect LANs are working properly.
If all interconnect LANs are disconnected, internal communications with other servers are blocked. As a result, even if an error is detected on a monitor target, failover of groups fails.
To fail over a group when all interconnect LANs are disconnected, you can choose to shut down the server where an error is detected. This will allow other servers to detect the server is shut down and to start failover of the group.
The following is an example of the process when an error is detected while all interconnect LANs are disconnected.
Configuration
Reactivation for the recovery target is same as the situation when the interconnect LANs are working properly. The description begins from the failover on server1, which requires interconnect LANs.
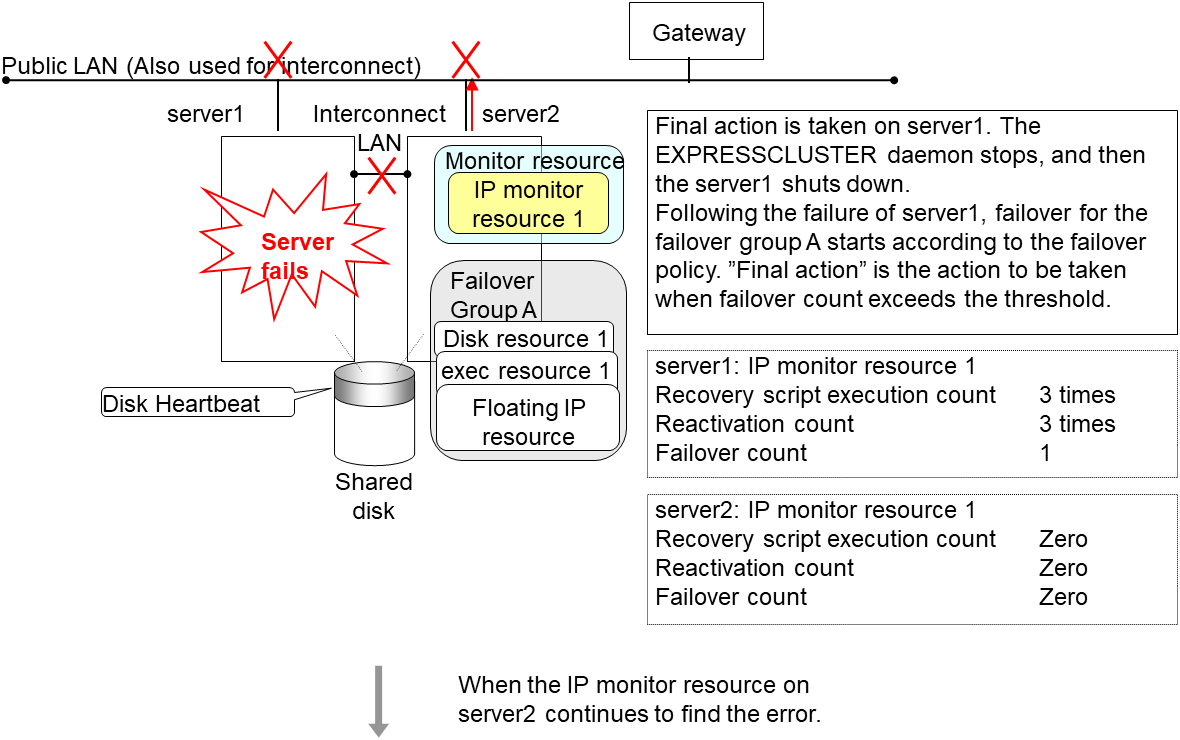
Reactivation of the Failover Group A is executed on server2 in the same way as server1.
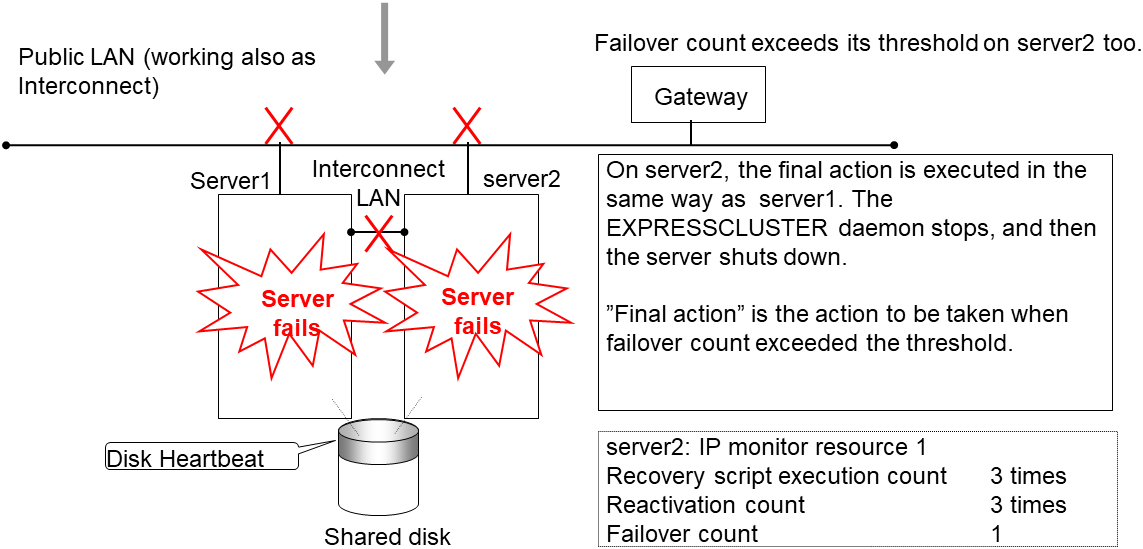
Failover is attempted on server2 as well when reactivation of the group A fails. However, the failover cannot be executed because there is no destination server for the failvoer.
When the failover count exceeds its threthhold, the final action is taken on server2 as is the case on server1.
4.1.7. Returning from monitor error (Normal)
When return of the monitor resource is detected during or after recovery actions following the detection of a monitoring error, counts for the thresholds shown below are reset:
Recovery Script Execution Count
Reactivation Count
Failover Count
Whether or not to execute the final action is reset (execution required).
The following pages describe what will be executed from the point when the final action as described in "Action when an error is detected by monitor resource" executed and another monitoring error occurs after monitoring returns to normal.
Examples of behavior when the following values are set.
Configuration
The number of reactivations and failovers are reset because it has been detected that the status of the monitor target resource became normal.
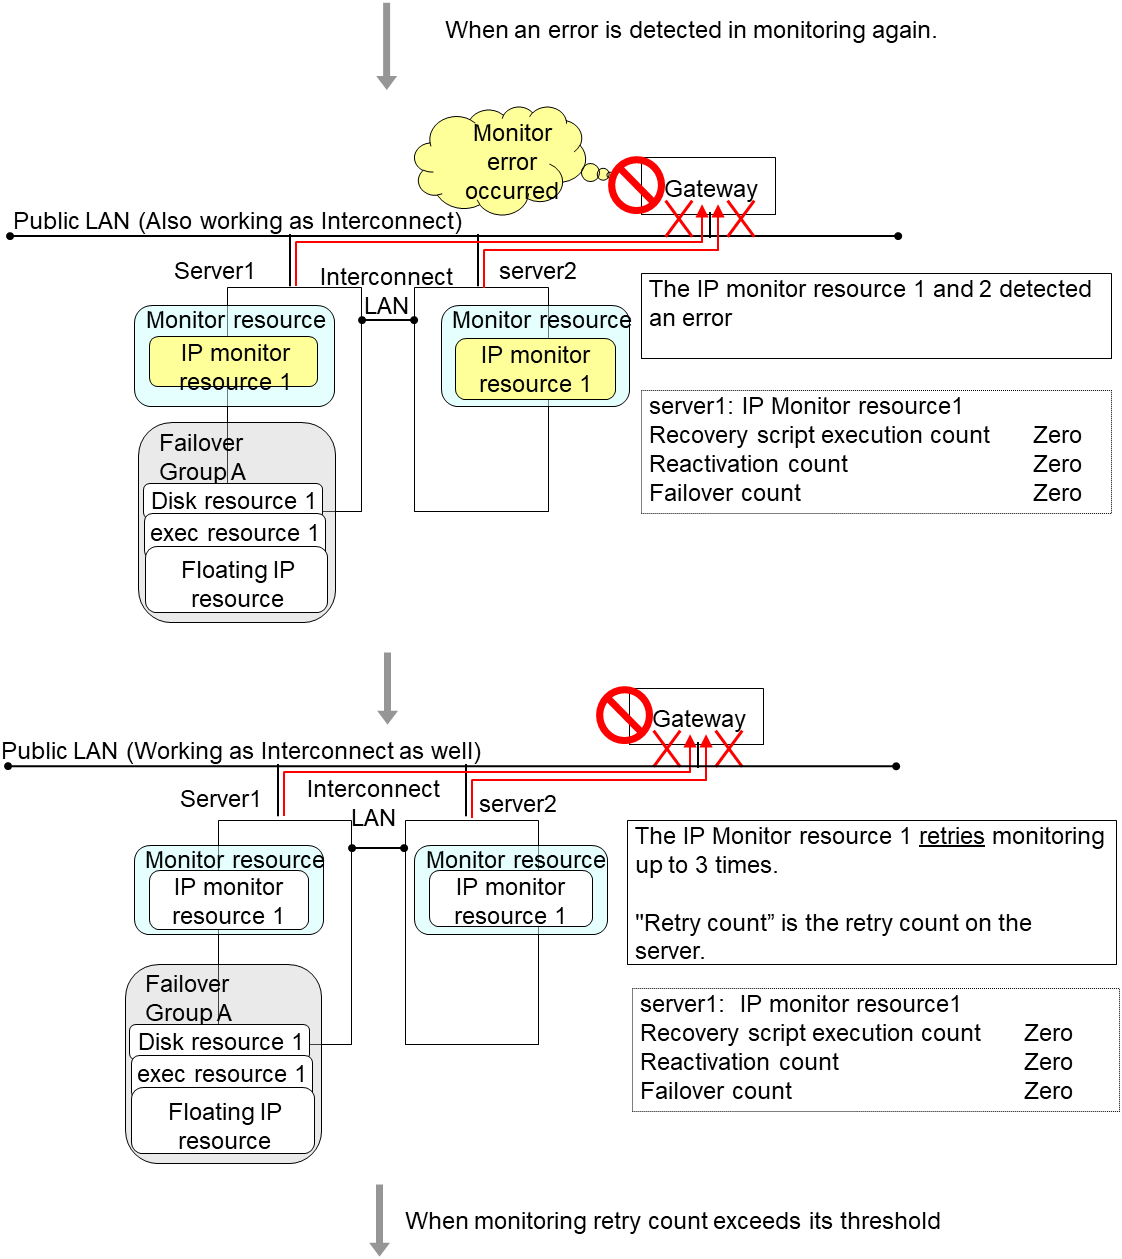
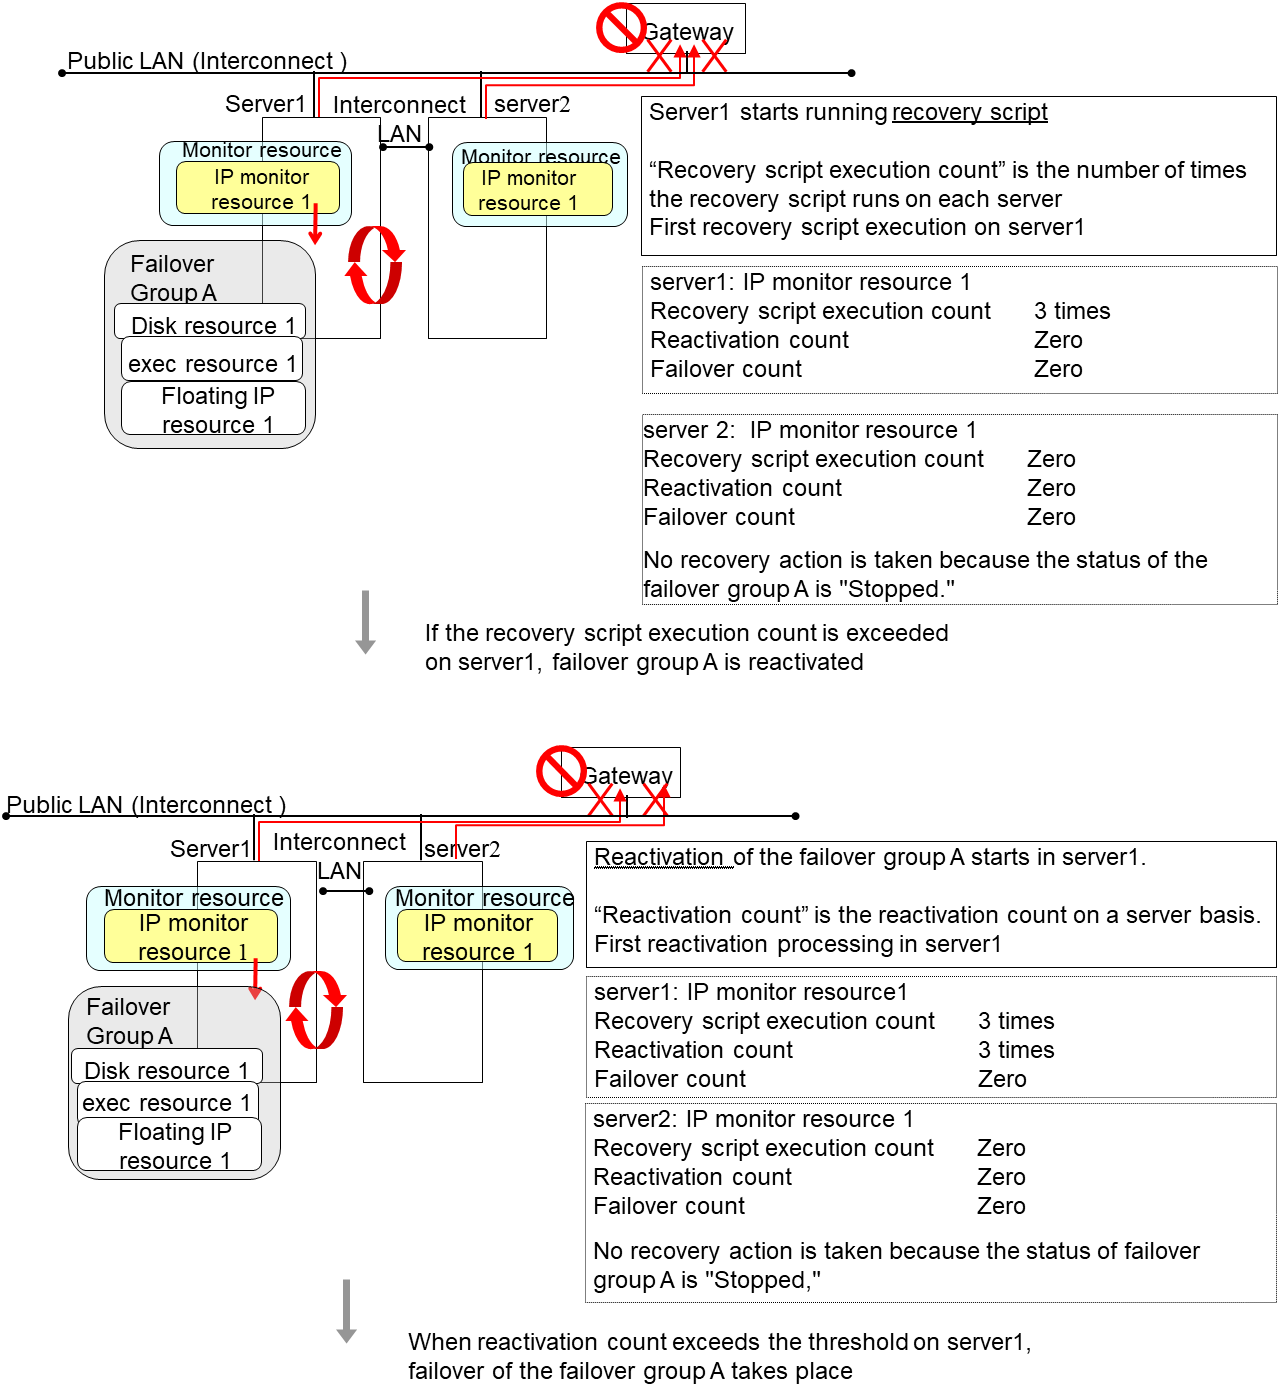
Reactivation is executed again because it has been detected that the status of the monitor target resource became normal and reactivation count has been reset before.
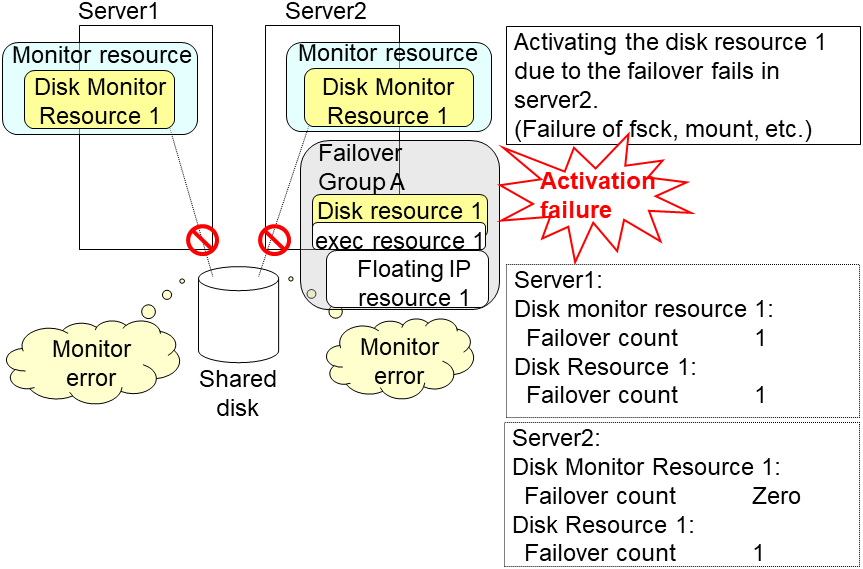
4.1.8. Activation and deactivation error of recovery target when executing recovery operation
When the monitoring target of the monitor resource is the device used for the group resource of the recovery target, an activation/deactivation error of the group resource may be detected during recovery when a monitoring error is detected.
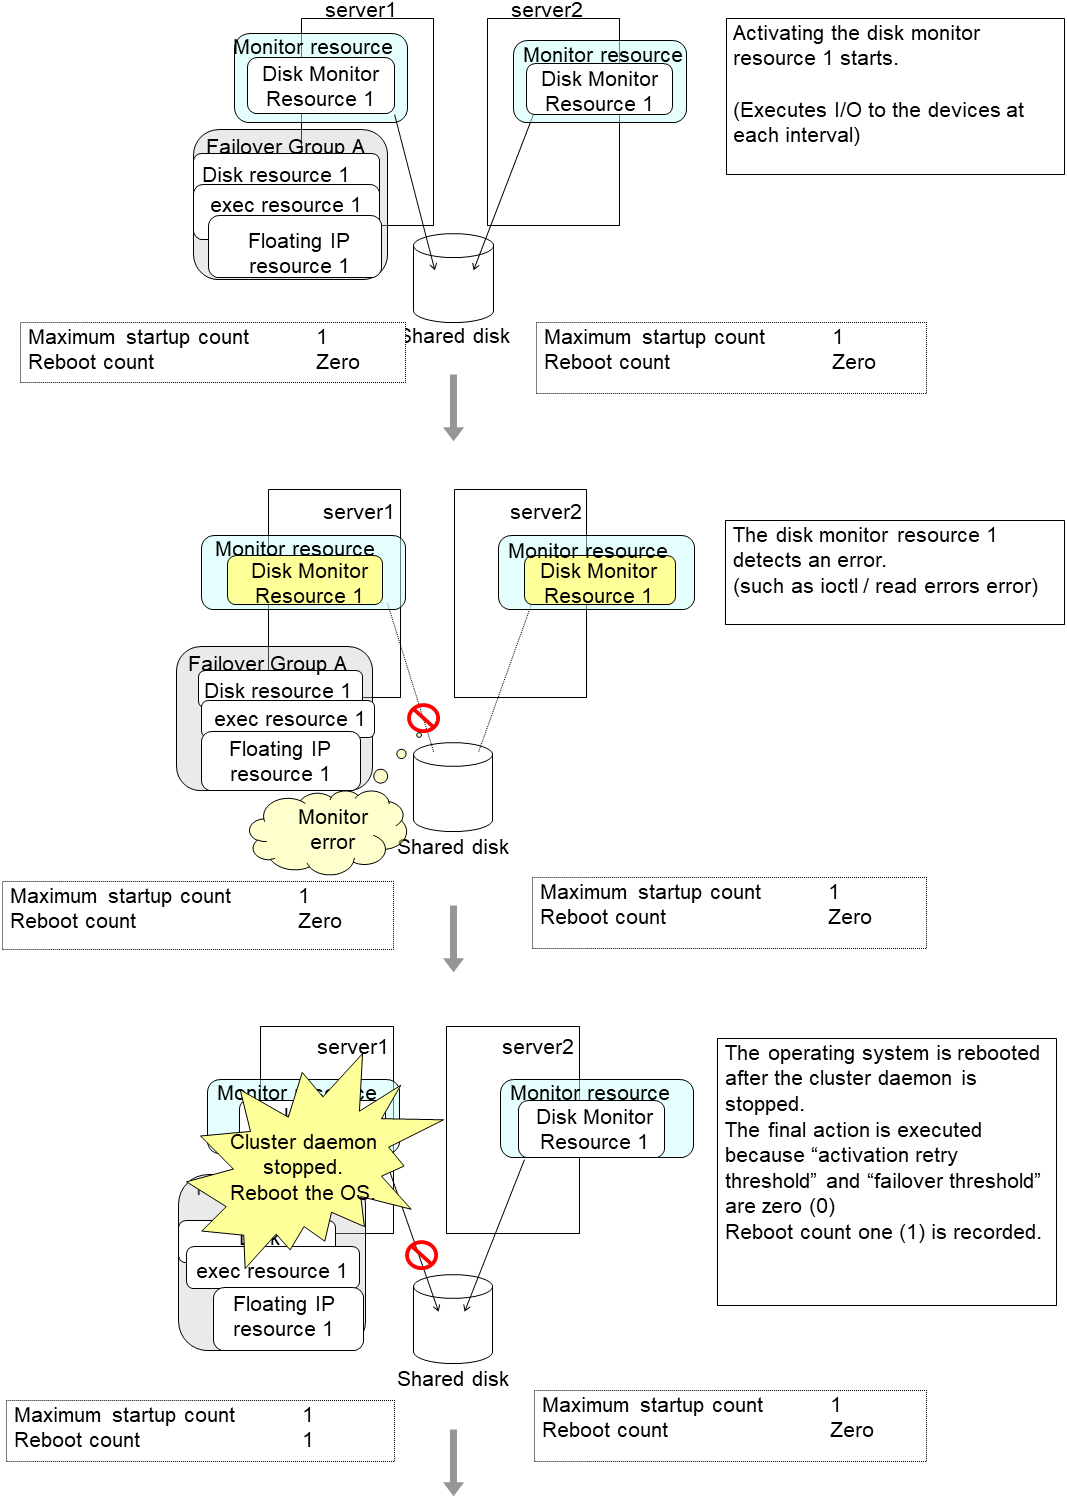
The following is an example of the recovery progress when the same device is specified as the monitor target of the disk monitor resource and the disk resource of the Failover Group A:
Configuration of the disk monitor resource
Configuration of the failover group A: disk resource
The reactivation threshold of the monitor resource and the activation retry threshold of the group resource are not mentioned in the following diagrams because they are set to zero (0).
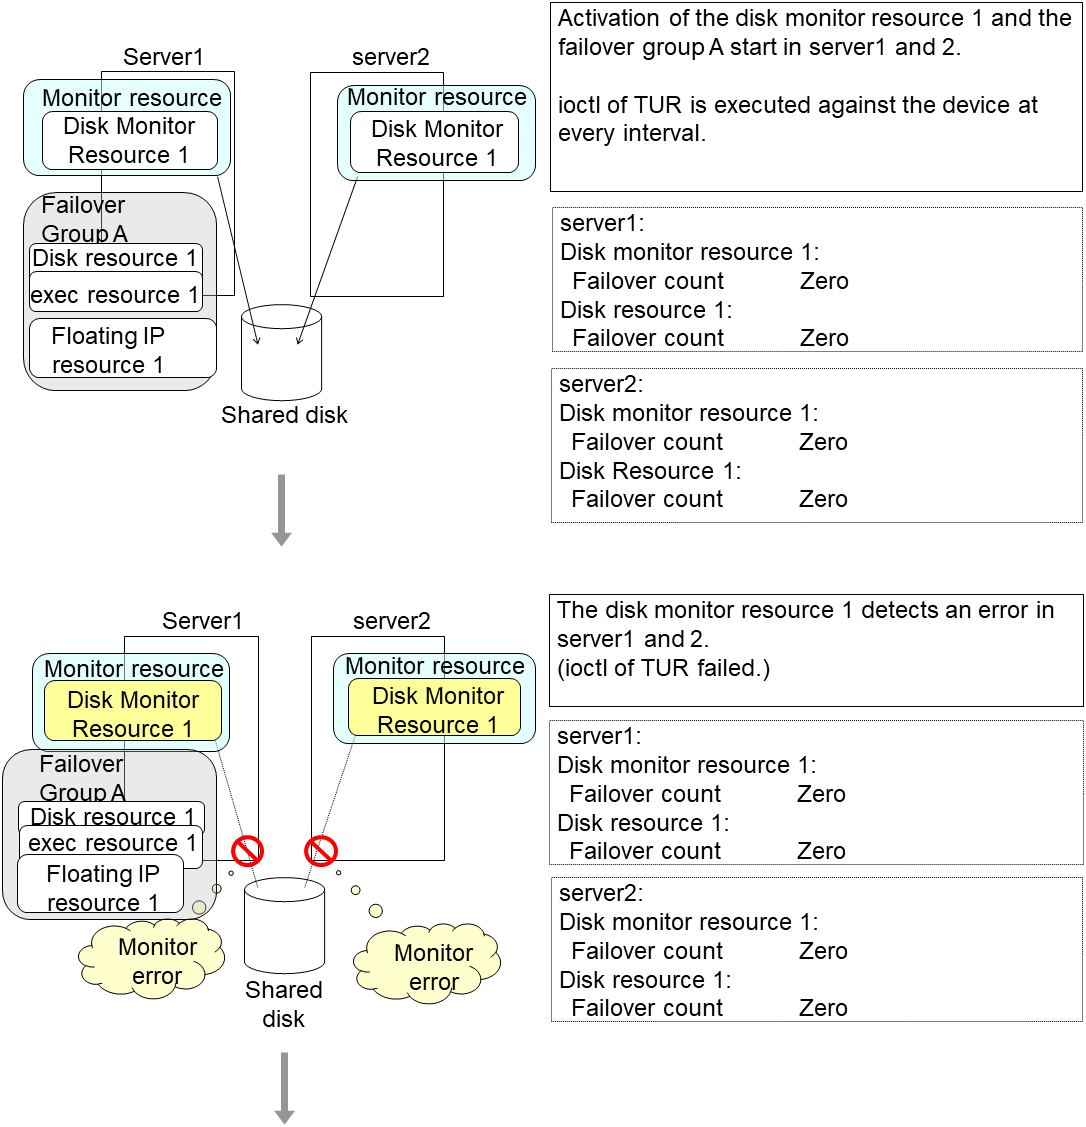
An error can be detected in deactivation of the disk resource depending on the location of the disk device failure.
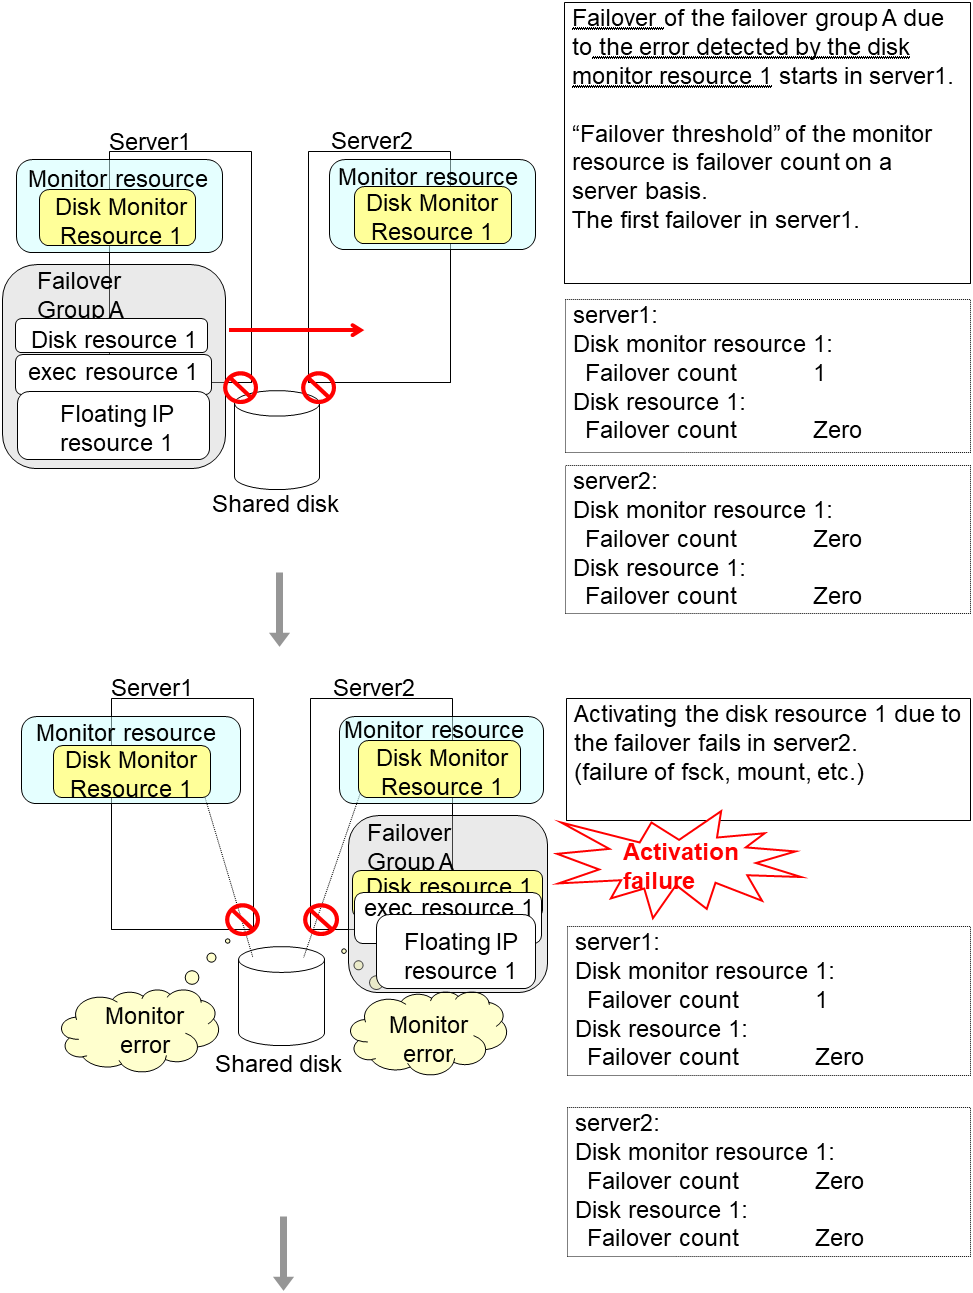
An error can be detected in deactivation of the disk resource depending on the location of the disk device failure.
The disk monitor resource 1 detects an error in server2 as is the case in server1. However, no recovery action is taken because the failover group A, the recovery target, is activated.
For more information on recovery executed by monitor resources against their recovery targets, see "Action when an error is detected by monitor resource".
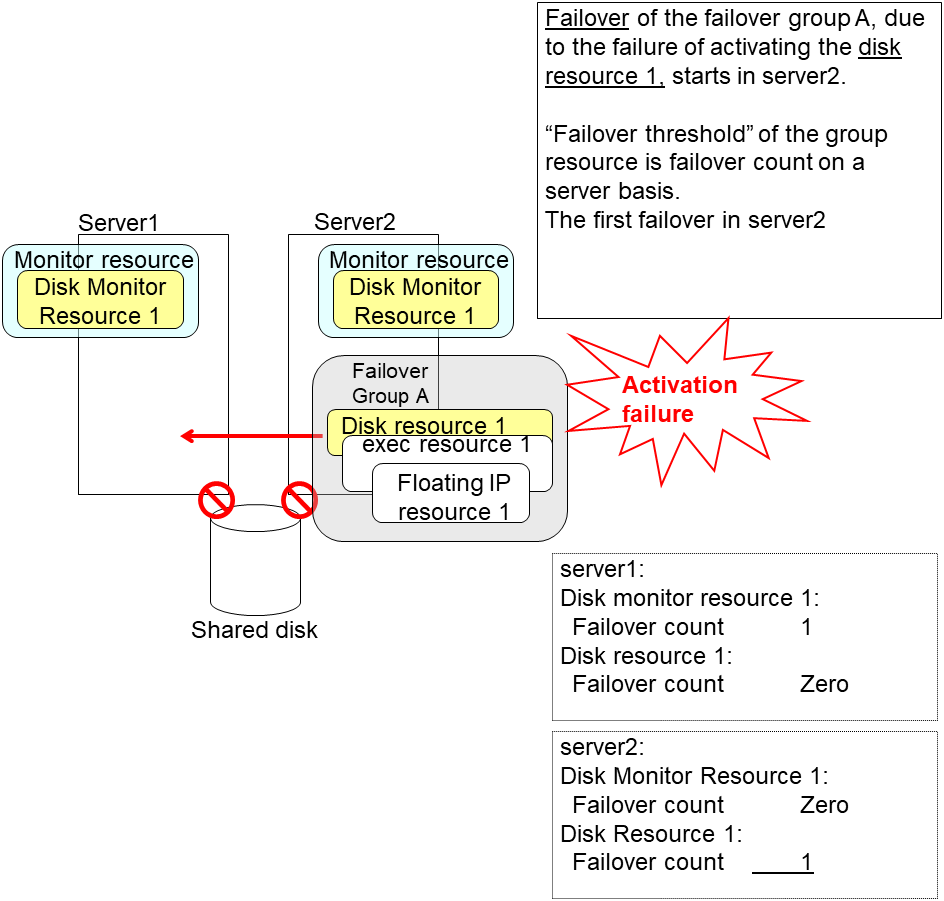
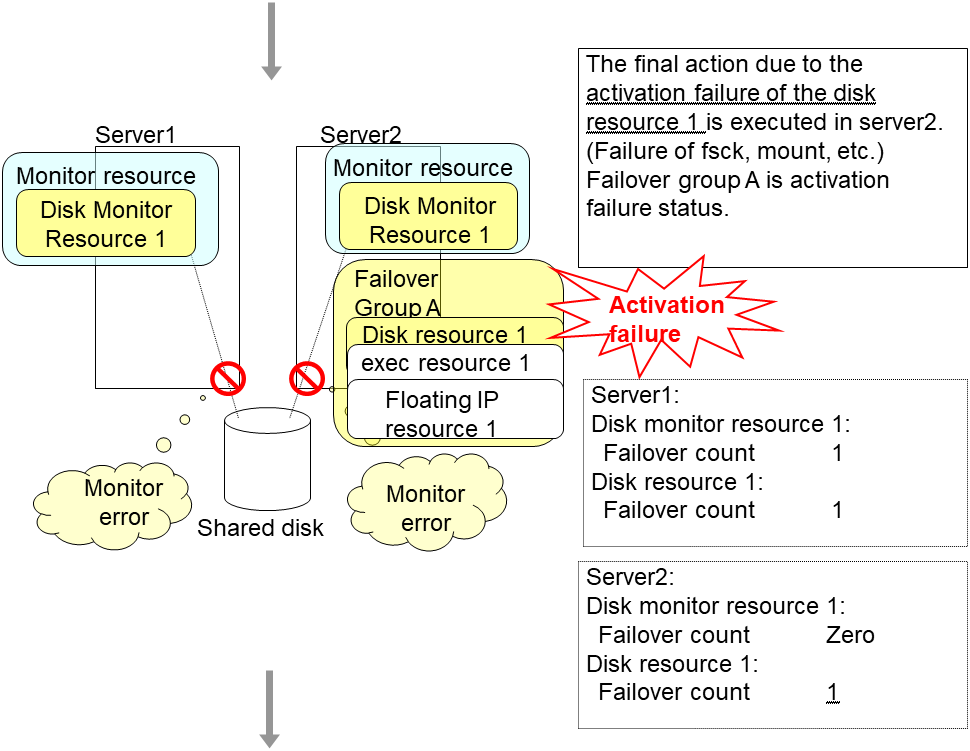
An error can be detected in deactivation of the disk resource depending on the location of the disk device failure.
An error can be detected in deactivation of the disk resource depending on the location of the disk device failure.
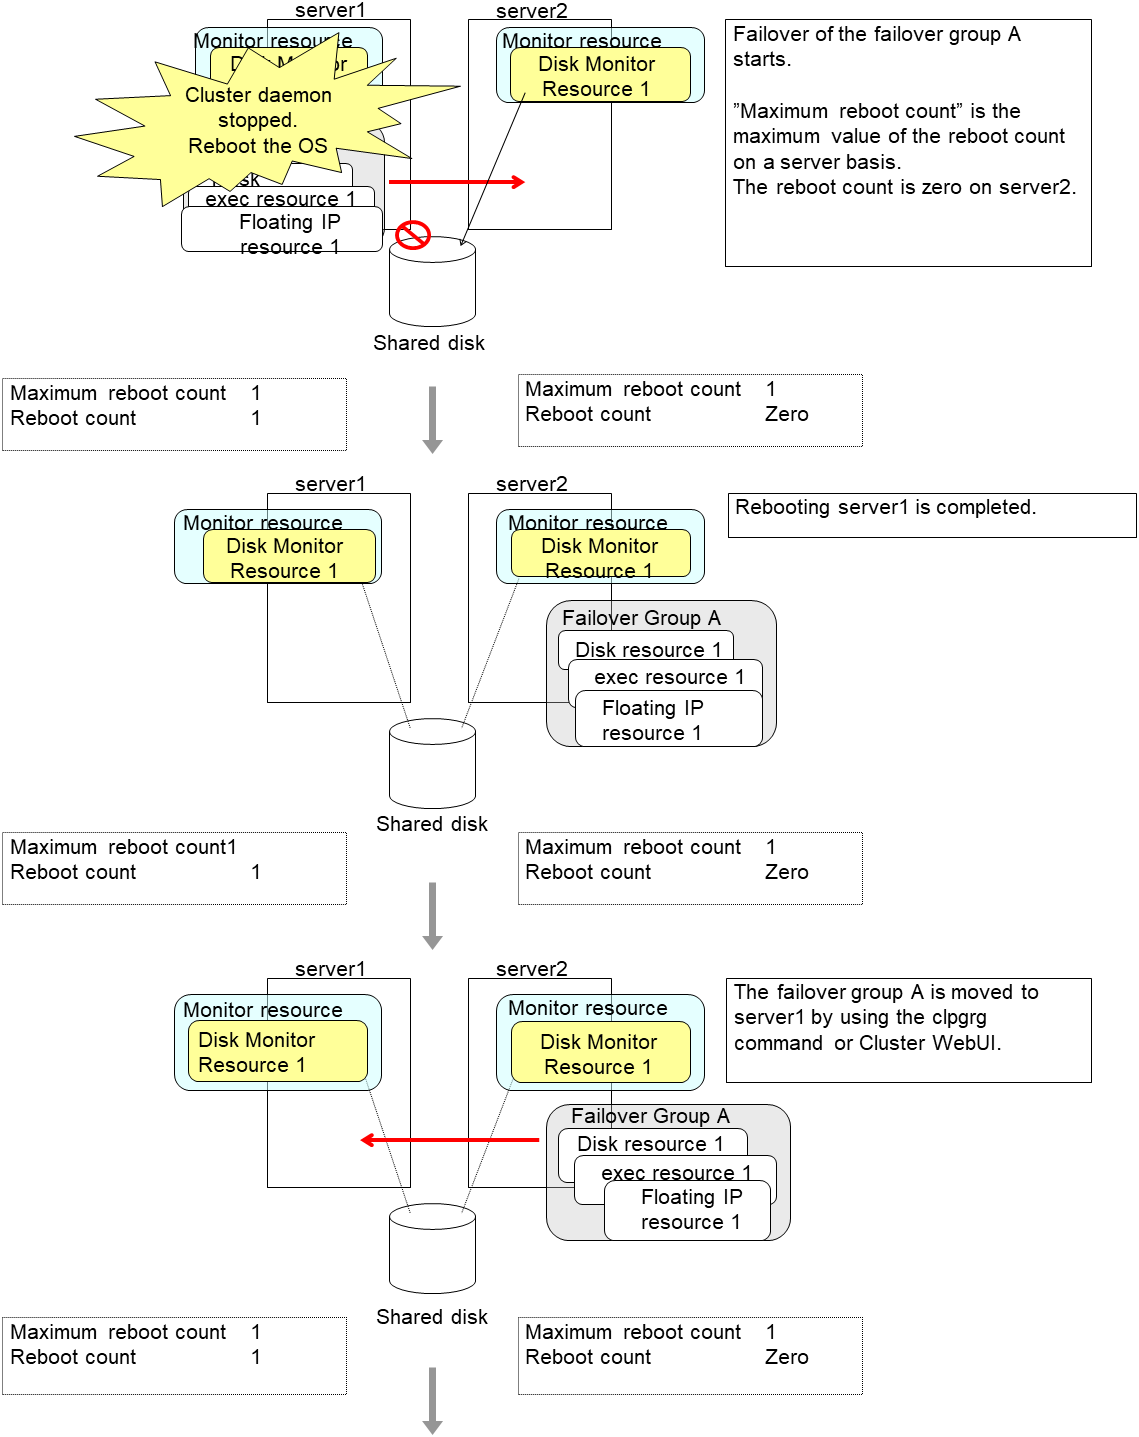
The final action is executed in server2 because the number of failovers due to failure of disk resource activation has exceeded its threshold.
However, note that activation ends abnormally without activating the rest of the group resources in the Failover Group A because "No operation (Next resources are not activated)" is selected as the final action.
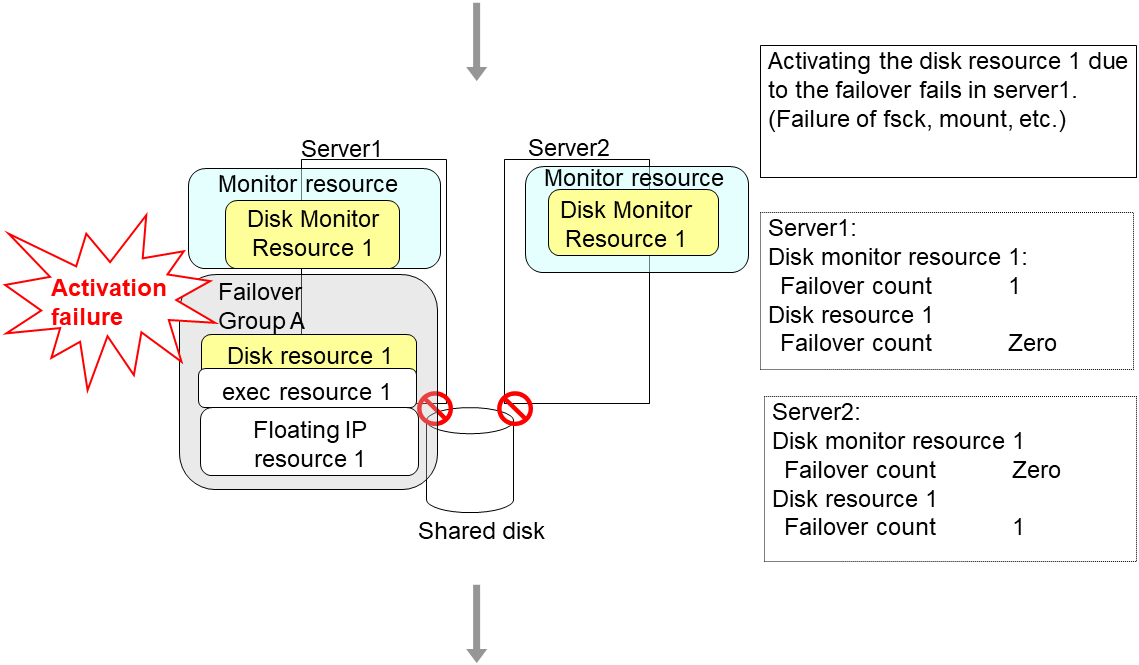
An error can be detected in deactivation of the disk resource depending on the location of the disk device failure.
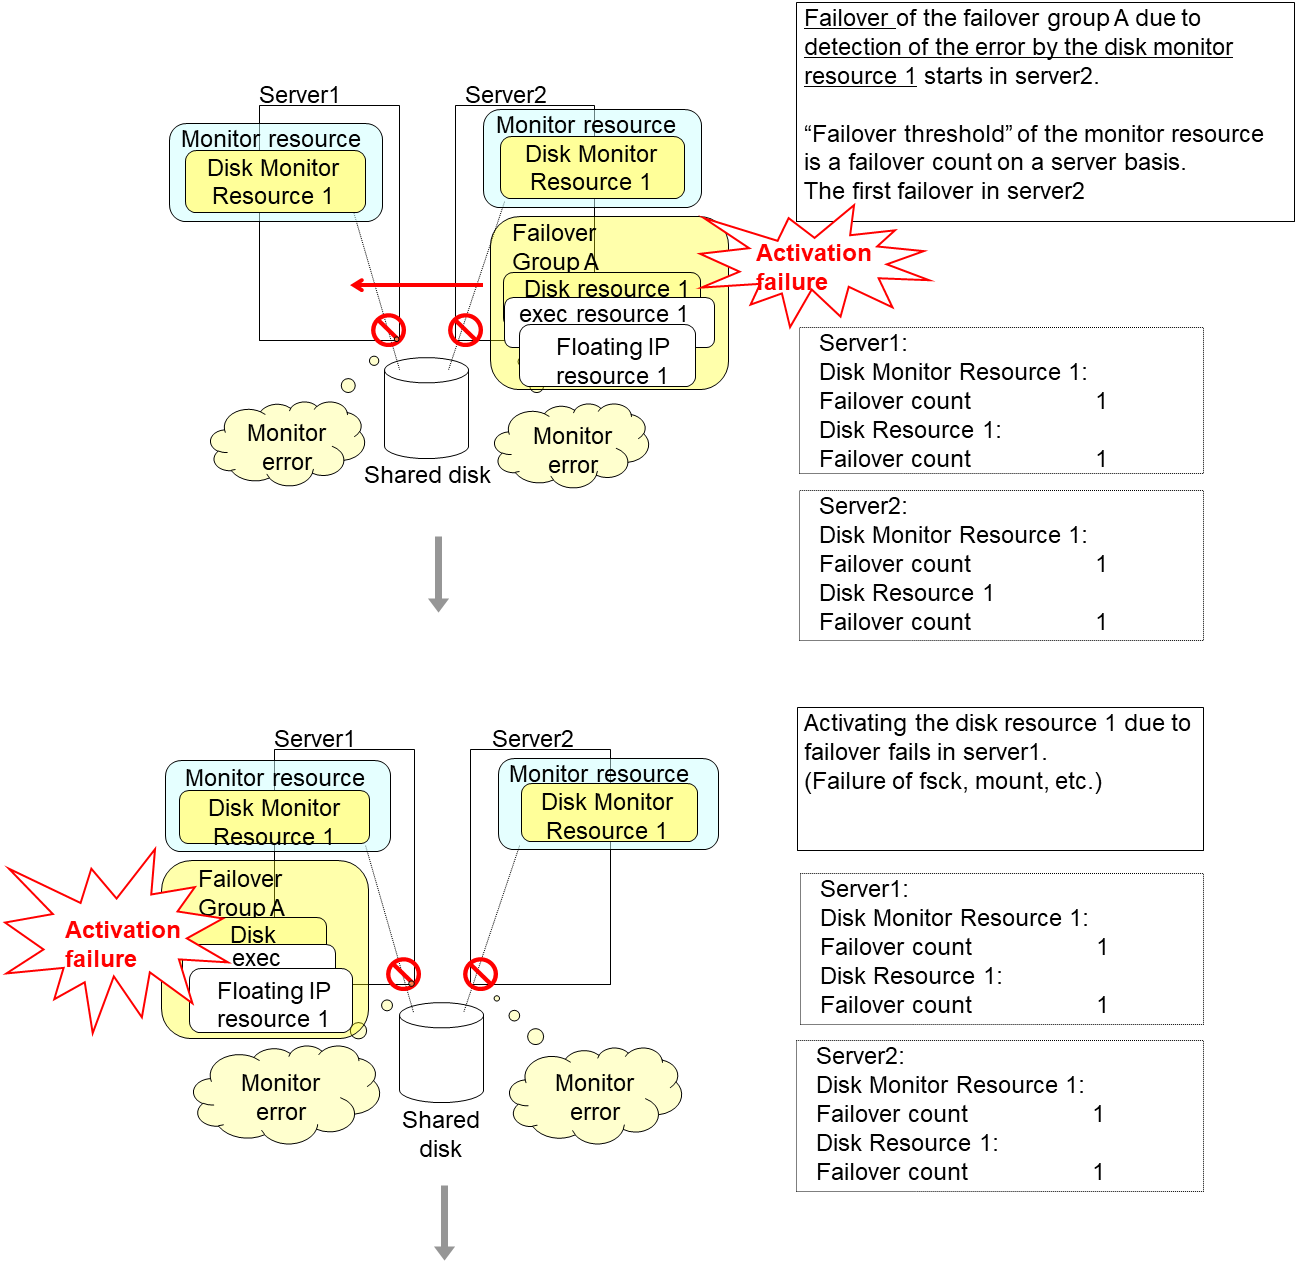
The final action is executed in server1 as is the case in server2 because the number of failovers due to failure of activating the disk resource 1 has exceeded the threshold.
However, note that activation ends abnormally without activating the rest of the group resources in the Failover Group A because "No operation (Next resources are not activated)" is selected as the final action.
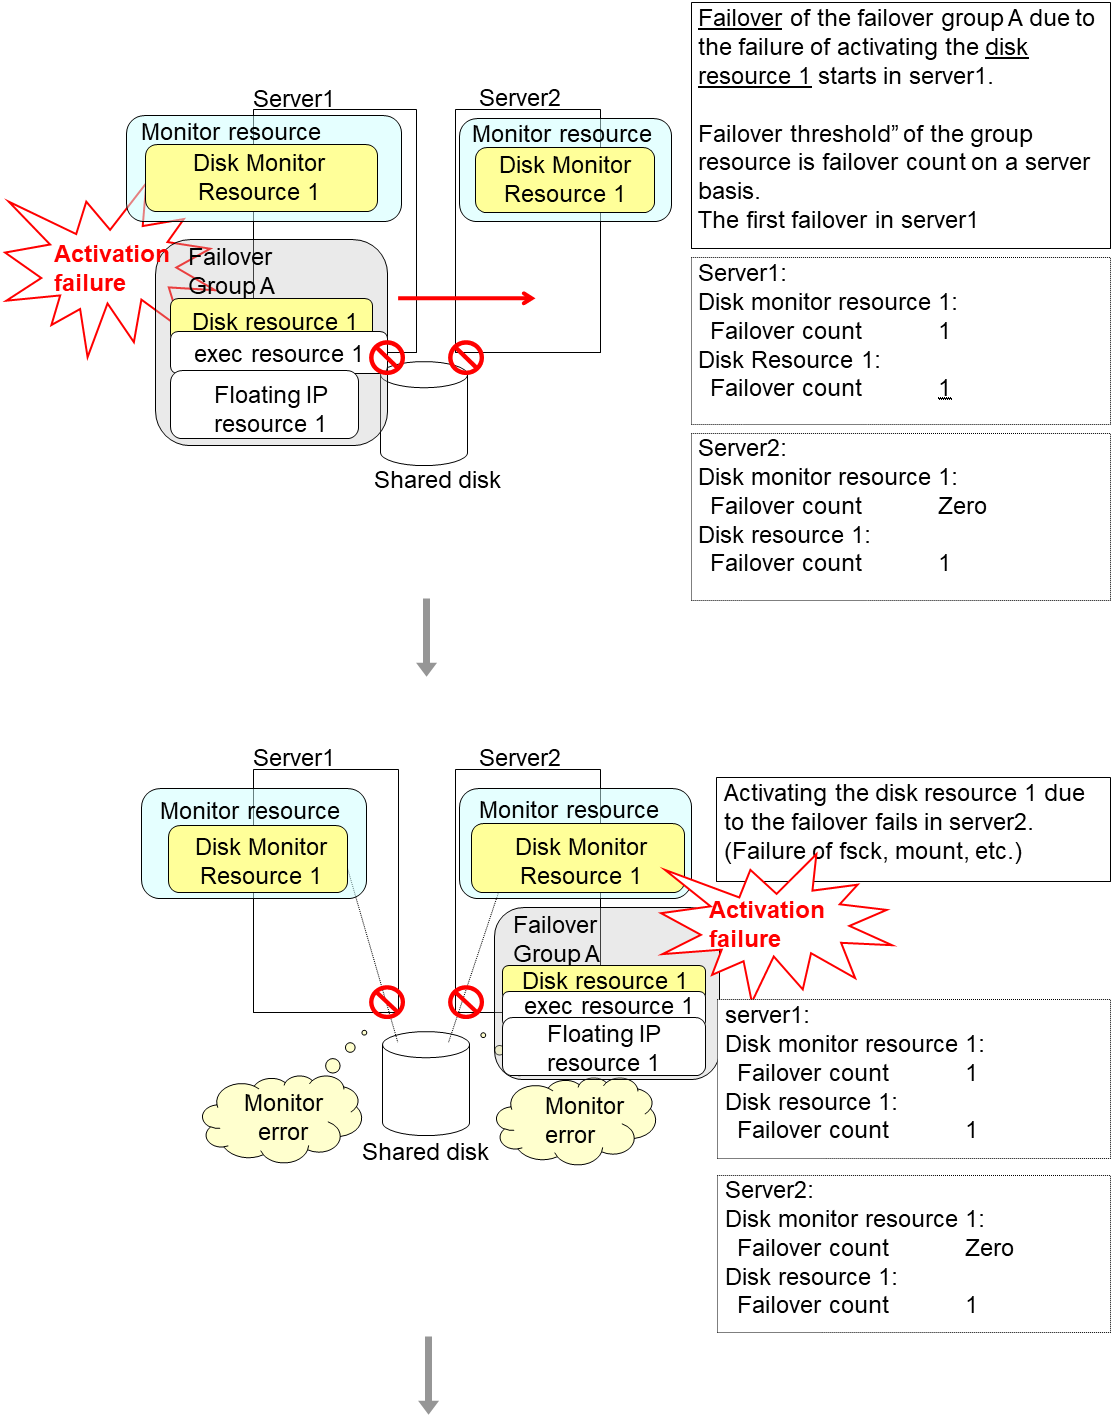
An error can be detected in deactivation of the disk resource depending on the location of the disk device failure.
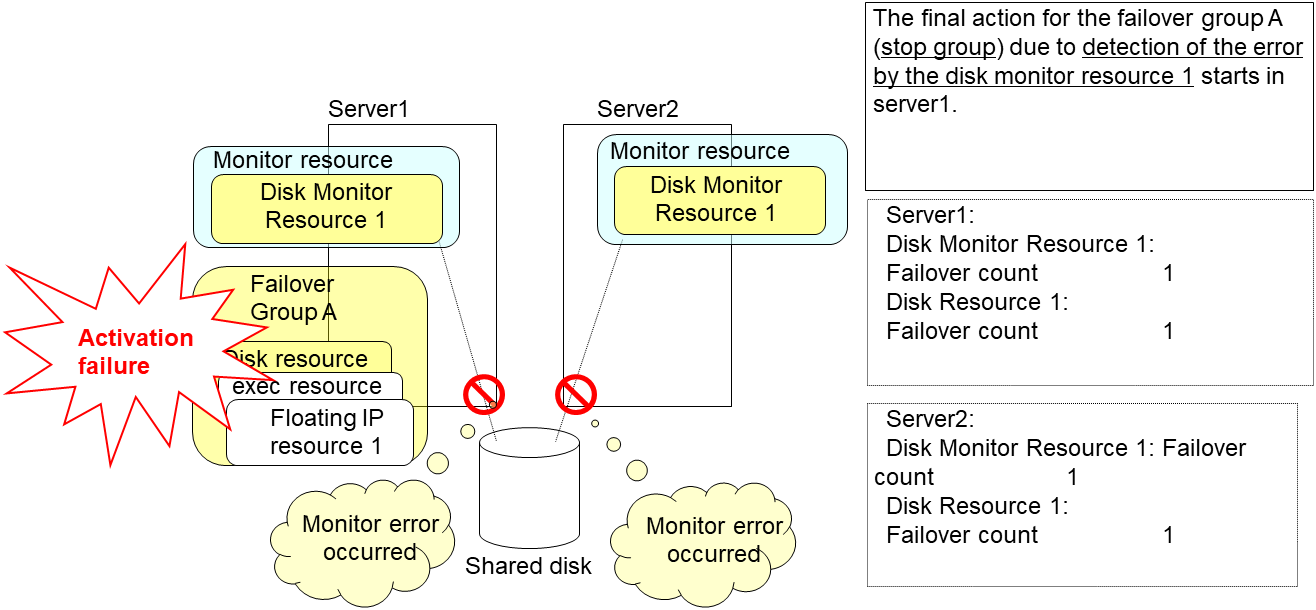
The final action is executed in server1 because the number of failovers due to monitoring error detected by the disk monitor resource 1 has exceeded the threshold.
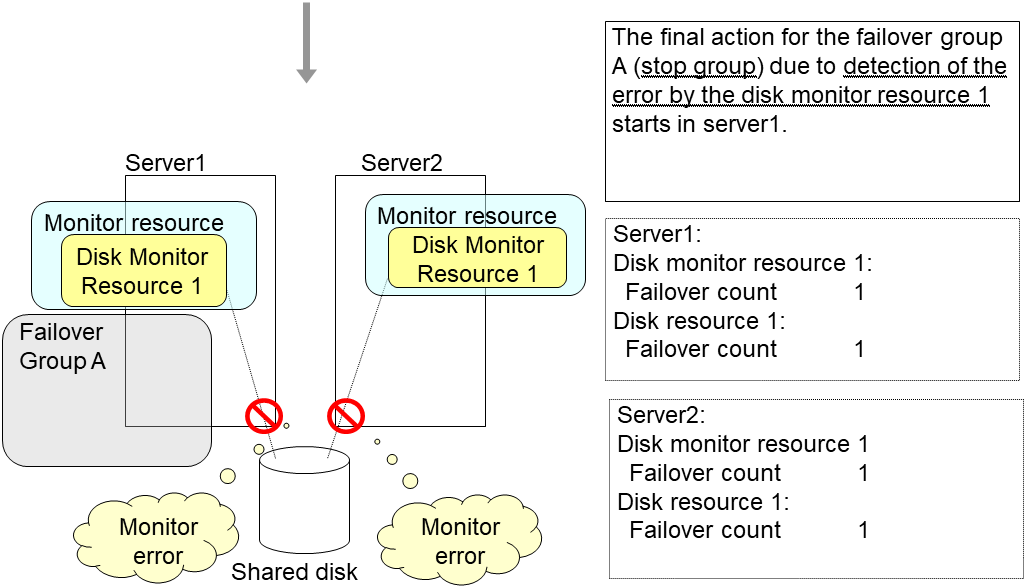
After the Failover Group A is stopped due to the final action executed for the disk monitor resource 1 in server1, nothing will happen even if an error is detected by the disk monitor resource 1.
However, note that the final action for the disk monitor resource 1 is executed in server2 if the Failover Group A is manually activated because the final action for the disk monitor resource 1 is not executed yet.
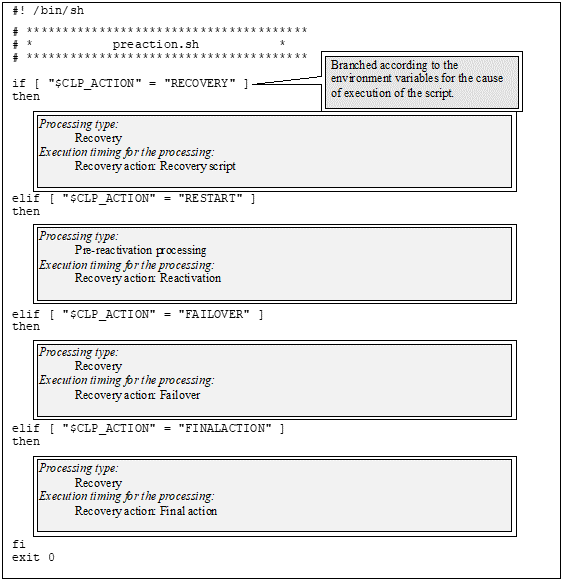
4.1.9. Recovery/pre-recovery action script
Upon the detection of a monitor resource error, a recovery script can be configured to run. Alternatively, before the reactivation, failover, or final action of a recovery target, a pre-recovery action script can be configured to run.
The script is a common file.
Environment variables used in the recovery/pre-recovery action script
EXPRESSCLUSTER sets status information (the recovery action type) in the environment variables upon the execution of the script.
The script allows you to specify the following environment variables as branch conditions according to the operation of the system.
Environment variable |
Value of the environment variable |
Description |
|---|---|---|
CLP_MONITORNAME
...Monitor resource name
|
Monitor resource name |
Name of the monitor resource in which an error that causes the recovery/pre-recovery action script to run is detected. |
CLP_VERSION_FULL
...EXPRESSCLUSTER
full version number
|
EXPRESSCLUSTER full version number |
EXPRESSCLUSTER full version number.
(Example) 4.2.0-1
|
CLP_VERSION_MAJOR
...EXPRESSCLUSTER major version
|
EXPRESSCLUSTER major version |
EXPRESSCLUSTER major version
(Example) 4
|
CLP_PATH
...EXPRESSCLUSTER installation path
|
EXPRESSCLUSTER installation path |
Path of EXPRESSCLUSTER installation.
(Example) /opt/nec/clusterpro
|
CLP_OSNAME
...Server OS name
|
Server OS name |
Name of the server OS on which the script is executed.
(Example)
1. When the OS name could be acquired:
Red Hat Enterprise Linux Server release 6.8 (Santiago)
2. When the OS name could not be acquired:
Linux
|
CLP_OSVER
...Server OS version
|
Server OS version |
Version of the server OS on which the script is executed.
(Example)
1. When the OS name could be acquired:6.8
2. When the OS version could not be acquired: *None
|
CLP_ACTION
...Recovery action type
|
RECOVERY |
Execution as a recovery script. |
RESTART |
Execution before reactivation. |
|
FAILOVER |
Execution before failover. |
|
FINALACTION |
Execution before final action. |
|
CLP_RECOVERYCOUNT
...Recovery script execution count
|
Recovery Script Execution Count |
Count for recovery script execution. |
CLP_RESTARTCOUNT
...Reactivation count
|
Reactivation count |
Count for reactivation. |
CLP_FAILOVERCOUNT
...Failover count
|
Failover count |
Count for failover. |
Writing recovery/pre-recovery action scripts
This section explains the environment variables mentioned above, using a practical scripting example.
Example of a recovery/pre-recovery action script
Tips for recovery/pre-recovery action script coding
Pay careful attention to the following points when coding the script.
When the script contains a command that requires a long time to run, log the end of execution of that command. The logged information can be used to identify the nature of the error if a problem occurs. clplogcmd is used to log the information.
- How to use clplogcmd in the scriptWith clplogcmd, messages can be output to Cluster WebUI Alert logs or OS syslog. For clplogcmd, see "Outputting messages (clplogcmd command)" in "8. EXPRESSCLUSTER command reference" in this guide.(Ex. : Scripting image)clplogcmd -m "recoverystart.."recoverystartclplogcmd -m "OK"
Note on the recovery/pre-recovery action script
- Stack size for commands and applications activated from the scriptThe recovery/pre-recovery action script runs with the stack size configured to 2 MB. If the script has a command or application that requires a stack size of 2 MB or more to run, a stack overflow occurs.If a stack overflow error occurs, adjust the stack size before the command or application is activated.
- Condition that a pre-recovery action script is executed as the final actionA pre-recovery action script is executed as the final action before the final action due to a monitor error detected by a monitor. Even if No operation is set as the final action, a pre-recovery action script is executed.If the final action is not executed because the maximum restart count has reached the upper limit or by the function to suppress the monitor resource recovery action or the function to suppress the final action when all other servers are being stopped, a pre-recovery action script is not executed.
4.1.10. Delay warning of monitor resources
When a server is heavily loaded, due to a reason such as applications running concurrently, a monitor resource may detect a monitoring timeout. It is possible to have settings to issue an alert at the time when polling time (the actual elapsed time) reaches a certain percentages of the monitoring time before a timeout is detected.
The following figure shows timeline until a delay warning of the monitor resource is used.
In this example, the monitoring timeout is set to 60 seconds and the delay warning rate is set to 80%, which is the default value.
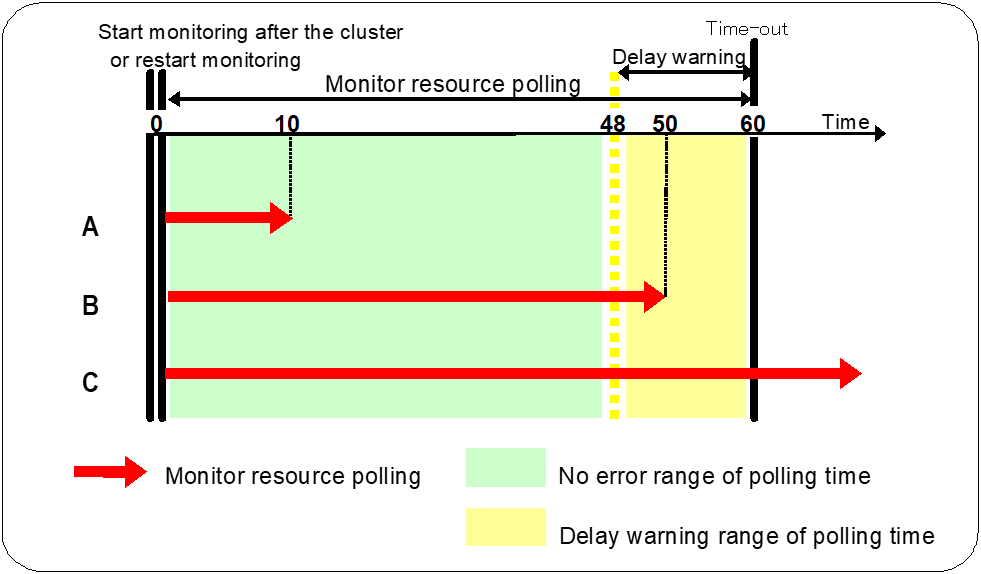
- The polling time of monitoring is 10 seconds. The target of the monitor resource is in normal status.In this case, no alert is used.
- The polling time of monitoring is 50 seconds and the delay of monitoring is detected during this time. The target of the monitor resource is in the normal status.In this case, an alert is used because the delay warning rate has exceeded 80%.
- The polling time of monitoring has exceeded 60 seconds of the monitoring timeout and the delay of monitoring is detected. The target of the monitor resource has a problem.In this case, no alert is used.
If the delay warning rate is set to 0 or 100:
- When 0 is set to the delay monitoring rateAn alert for the delay warning is used at every monitoring.By using this feature, the polling time for the monitor resource can be calculated at the time the server is heavily loaded, which will allow you to determine the time for monitoring timeout of a monitor resource.
- When 100 is set to the delay monitoring rateThe delay warning will not be is used.
Alert for the delay warning is used for the heartbeat resources as well.
For the user-mode monitor resource, the same delay monitoring rate as for the monitor resource is used.
Note
Be sure not to set a low value, such as 0%, except for a test operation.
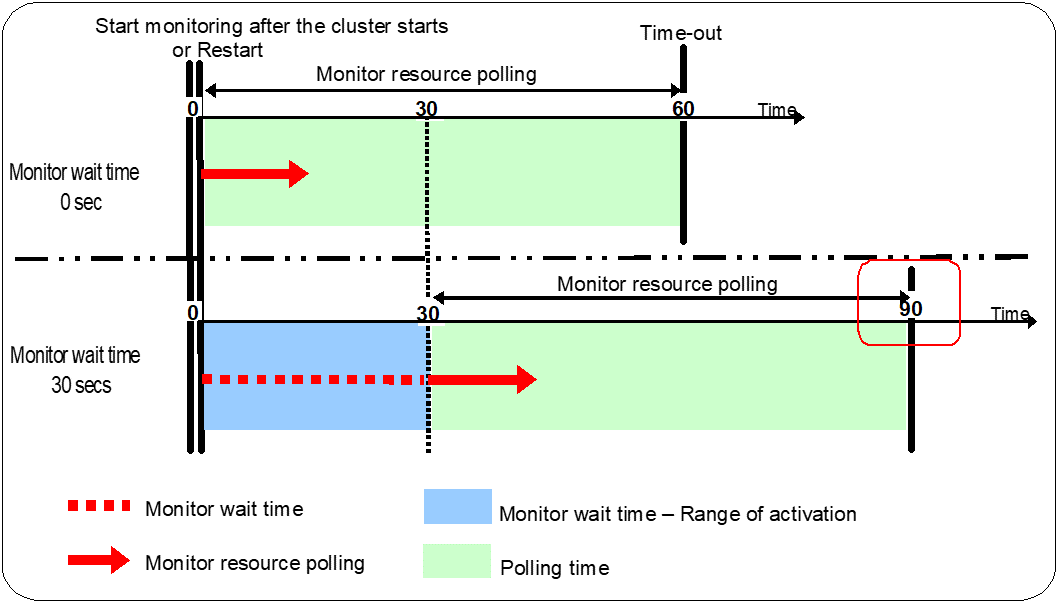
4.1.11. Waiting for monitor resource to start monitoring
"Wait Time to Start Monitoring" refers to start monitoring after the period of time specified as the waiting time elapses.
The following describes how monitoring differs when the wait time to start monitoring is set to 0 second and 30 seconds.
Configuration of monitor resource
Note
Monitoring will start after the time specified to wait for start monitoring has elapsed even when the monitor resource is suspended and/or resumed by using the monitoring control commands.
The wait time to start monitoring is used when there is a possibility for monitoring to be terminated right after the start of monitoring due to incorrect application settings, such as the exec resource monitored by PID monitor resource, and when they cannot be recovered by reactivation.
For example, when the monitor wait time is set to 0 (zero), recovery may be endlessly repeated. See the example below:
Configuration of PID Monitor resource
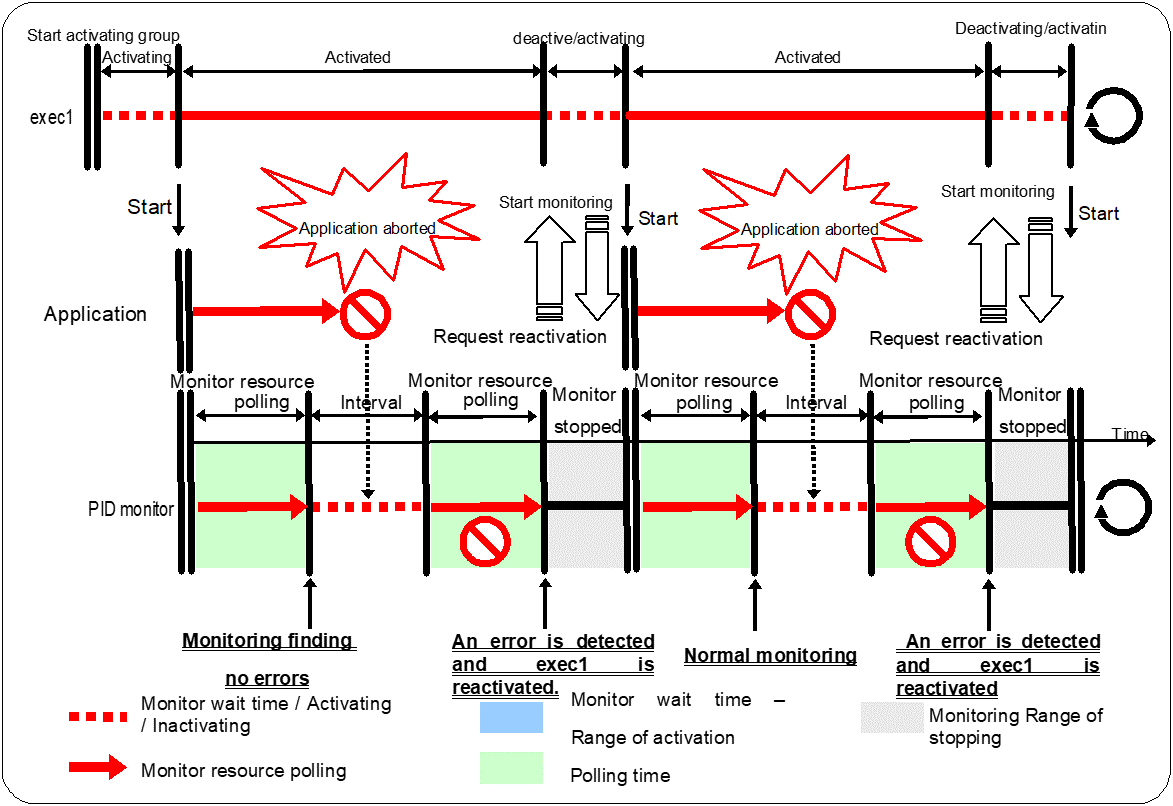
The reason why recovery action is endlessly repeated is because the initial monitor resource polling has terminated successfully. The current count of recoveries the monitor resource has executed is reset when the status of the monitor resource becomes normal (finds no error in the monitor target). Because of this, the current count is always reset to 0 and reactivation for recovery is endlessly repeated.
You can prevent this problem by setting the wait time to start monitoring. By default, 60 seconds is set as the wait time from the application startup to the end.
Configuration of PID monitor resource
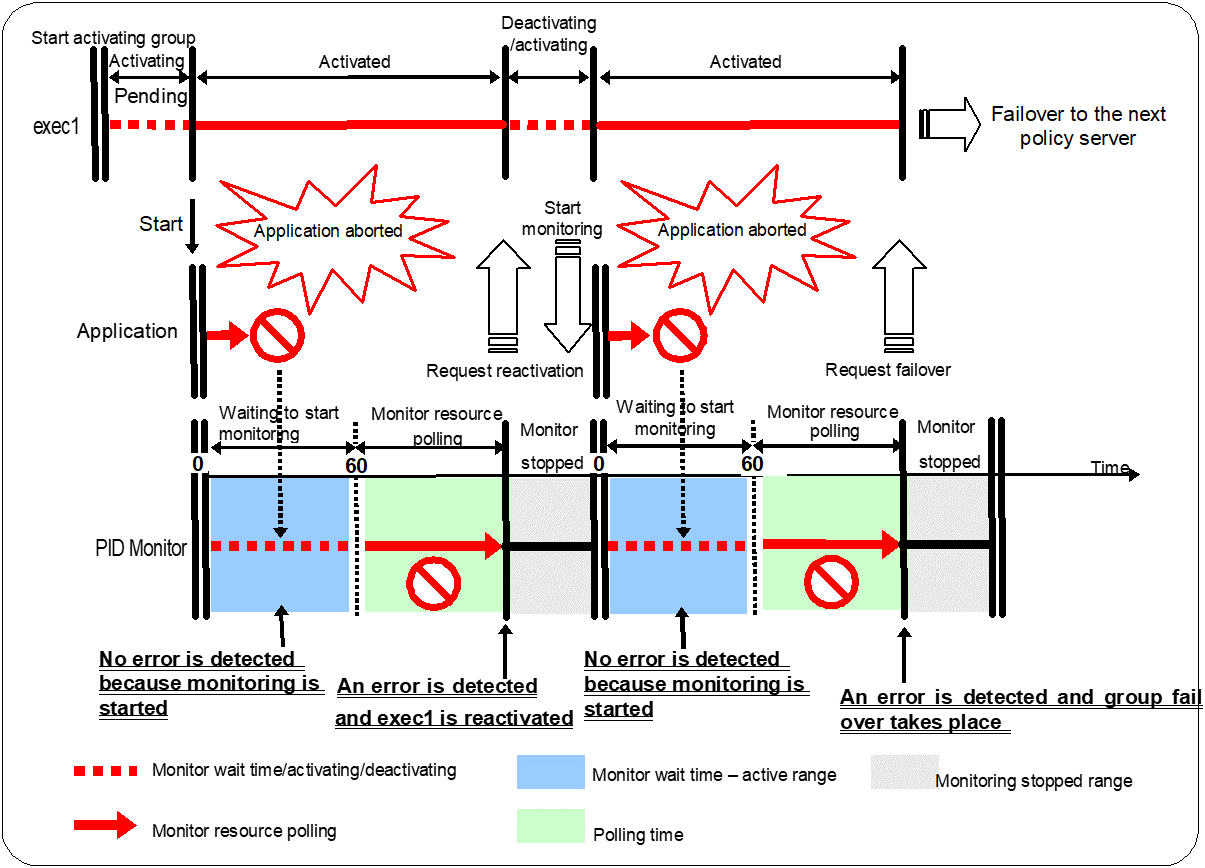
If the application is abnormally terminated in the destination server of the group failover, the group stops as the final action.
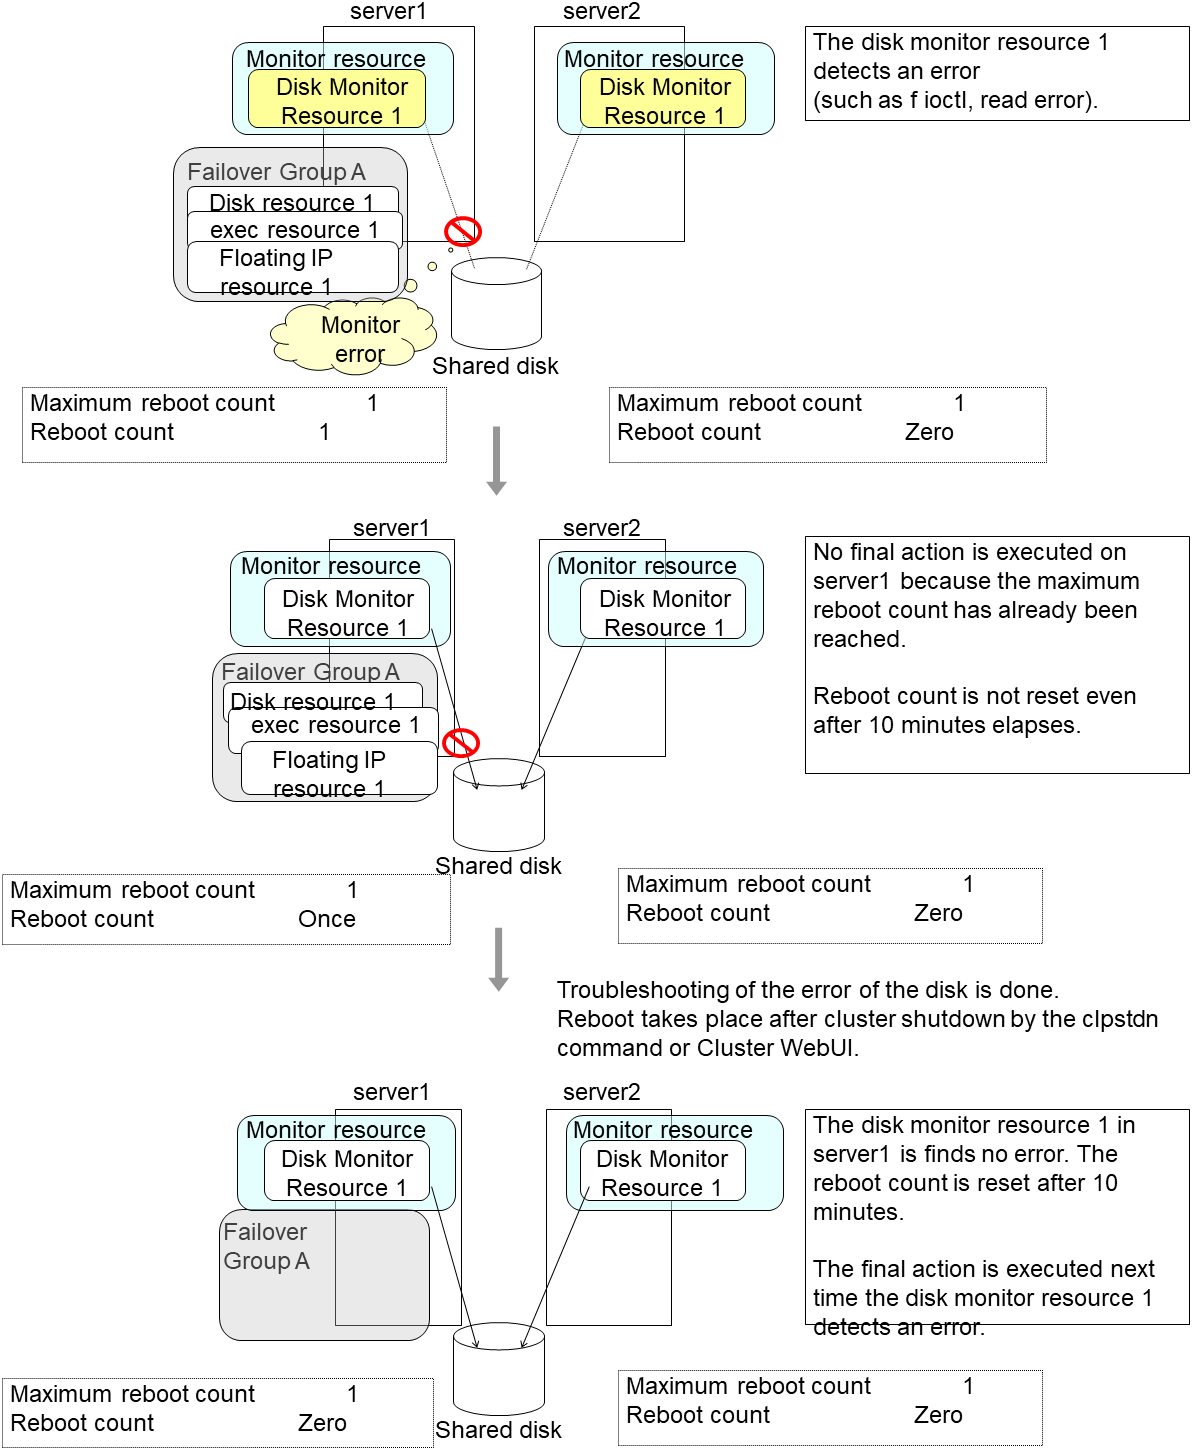
4.1.12. Limiting the number of reboots when an error is detected by the monitor resource
When Stop cluster service and shutdown OS or Stop cluster service and reboot OS is selected as a final action to be taken when an error is detected by the monitor resource, the number of shutdowns or reboots can be limited.
Note
The following is an example of the process when the number of reboots is limited.
As a final action, Stop cluster daemon and reboot OS is executed once because the maximum reboot count is set to one (1).
When the monitor resource finds no error in its target for 10 minutes after reboot following cluster shutdown, the number of reboots is reset because the time to reset the maximum reboot count is set to 10 minutes.
Examples of behavior when the following values are set.
Configuration
Time to reset the maximum reboot count 10 minutes
4.1.13. Monitor priority of the monitor resources
To assign a higher priority for monitor resources to monitor when the operating system is heavily loaded, the nice value can be set.
The nice value can be specified through minus 19 (low priority) to plus 20 (high priority). Detection of the monitor timeout can be controlled by setting a higher priority to the nice value.
4.1.14. IPMI command
Final actions BMC Reset, BMC Power Off, BMC Power Cycle, and BMC NMI use the ipmitool command.
If the commands are not installed, this function cannot be used.
Notes for the final action by ipmi
Final Action by IPMI is achieved by associating EXPRESSCLUSTER and the ipmitool command.
ipmitool(OpenIPMI-tools) is not shipped with EXPRESSCLUSTER. Users are required to install the rpm package by themselves.
When executing the final action by the ipmitool command, the ipmi driver needs to be loaded. It is recommended to load the ipmi driver automatically at OS startup.
Chassis identify uses the ipmitool command.
If the commands are not installed, this function cannot be used.
Notes for chassis identify by ipmi
Chassis identify by ipmi is actualized by combining EXPRESSCLUSTER and the ipmitool command.
ipmitool(OpenIPMI-tools) is not shipped with EXPRESSCLUSTER. Users are required to install the rpm package by themselves.
4.1.15. Setting monitor resources on individual servers
Some setting values of monitor resources can be set for individual servers. For the resources which can be configured on a server basis, the tabs of servers are displayed on the Monitor(special) tab.
The following monitor resources can be configured for individual servers.
Monitor resource name |
Supported version |
|---|---|
Disk monitor resource |
4.0.0-1 or later |
IP monitor resource |
4.0.0-1 or later |
NIC Link Up/Down monitor resource |
4.0.0-1 or later |
Message receive monitor resource |
4.0.0-1 or later |
AWS Elastic IP monitor resource |
4.0.0-1 or later |
AWS Virtual IP monitor resource |
4.0.0-1 or later |
AWS AZ monitor resource |
4.0.0-1 or later |
AWS DNS monitor resource |
4.0.0-1 or later |
For the parameters that can be configured for individual servers, see the descriptions of parameters on monitor resources. On those parameters, the Server Individual Setup icon is displayed.
In the example below, configuring settings for each server on the disk monitor resource is described.
Server Individual Setup
Parameters that can be configured for individual servers on a disk monitor resource are displayed.
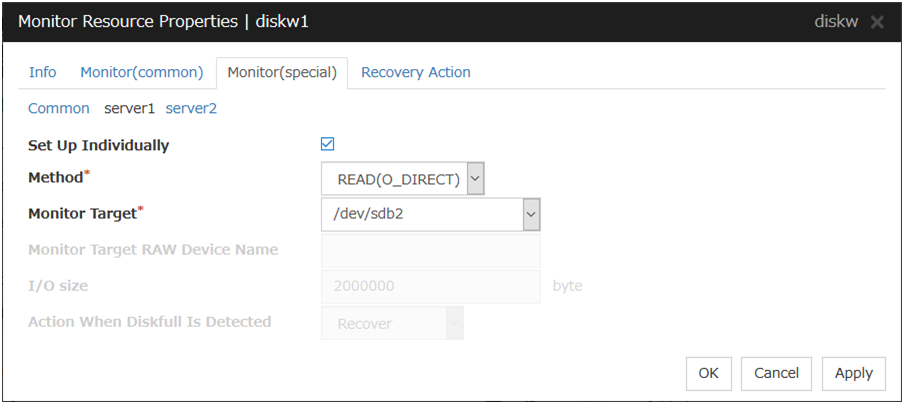
Set Up Individually
Click the tab of the server on which you want to configure server individual setting, and select this check box. The boxes for parameters that can be configured for individual servers become active. Enter required parameters.
4.1.16. Common settings for monitor resources of the monitoring option
This section describes the setting procedure for, and cautions related to, monitoring applications by using the monitor resources provided by the Application Server Agent, Database Agent, File Server Agent, Internet Server Agent, Java Resource Agent, and System Resource Agent (hereinafter referred to as "monitoring option").
Setting procedure of monitor resources of monitoring option
Follow the steps below to monitor applications by using monitor resources of the monitoring options.
In this example, DB2 monitor resource is used.
1. Create a failover group (for target monitoring application)
2. Add the EXEC resource for target monitoring application startup
3. Perform the test for target monitoring application startup
4. Add DB2 monitor resource for monitoring target monitoring application
The steps are described below.
Step 1 Create a failover group (for target monitoring application)
Create a failover group for monitoring the target monitoring application and performing a failover when an error occurs. Add group resources as necessary.
Note
For details on how to create failover groups and add group resources, see "Creating the cluster configuration data" in the "Installation and Configuration Guide".
Step 2 Add the EXEC resource for starting the target monitoring application
Add the EXEC resource for starting the target monitoring application to the failover group that you have created in Step 1, and edit it to start and finish the target monitoring application by its Start Script or Stop Script. In this guide, this EXEC resource is called exec 1.
Step 3 Confirmation test for target monitoring application startup
After completing the Steps 1 and 2, check that the monitored application is started normally. Modify the settings to the server, start, stop, move and fail over the group by the Cluster WebUI and confirm that those operations are performed normally.
Step 4 Add the DB2 monitor resource for starting target monitoring application
Add the DB2 monitor resource for monitoring the target monitoring application.
Select Active for Monitor Timing and specify exec1 for Target Resource on the Monitor (common) tab.
Note
For specific information on the monitor resources and settings, see the section on monitoring option monitor resources in "Monitor resource details" in this guide.
See also
For details on the monitoring settings common to monitor resources, see "Monitor (common) tab"
4.1.17. Cautions on monitoring option monitor resources
Cautions for using monitoring option monitor resources are as follows:
- For monitor resource db2w, ftpw, imap4w, mysqlw, odbcw, oraclew, pop3w, psqlw, sambaw, sqlserverw, sybasew, wasw, wlsw, otxw, and jraw a password is included as a property entry.This password is saved in plain text on the cluster configuration data file (clp.conf). Thus, it is recommended to create an account dedicated to monitoring other than for application and use it for security reasons.
4.2. Monitor resource properties
4.2.1. Info tab
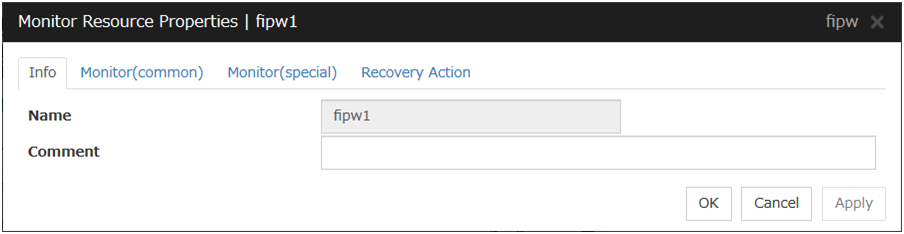
Name
The monitor resource name is displayed.
Comment (within 127 bytes)
Enter a comment for the monitor resource. Use only one-byte alphabets and numbers.
4.2.2. Monitor (common) tab
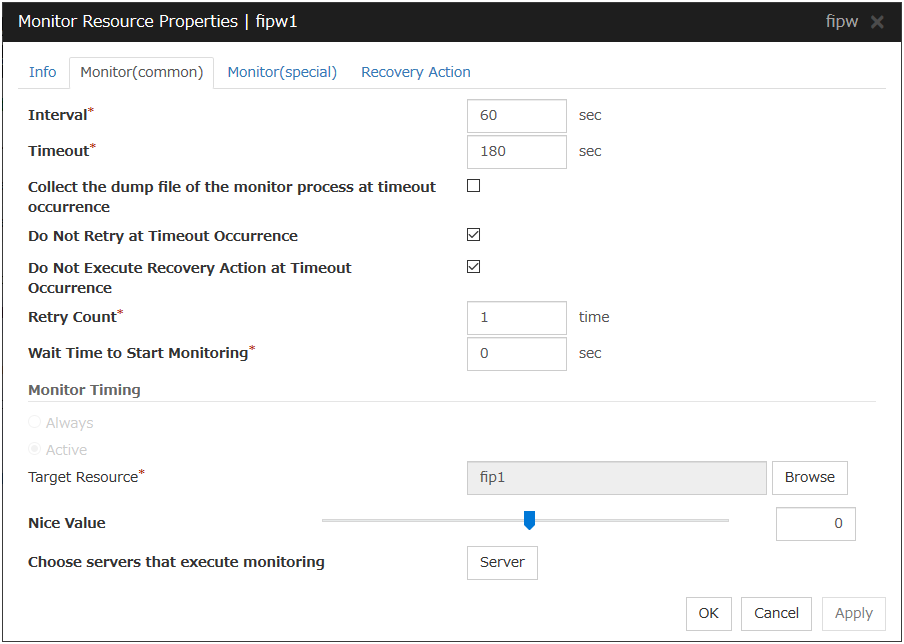
Interval(1 to 999)
Specify the interval to check the status of monitor target.
Timeout(5 to 9995 )
When the normal status cannot be detected within the time specified here, the status is determined to be error.
- 5
When ipmi is set as a monitoring method for the user-mode monitor resource, 255 or less should be specified.
Collect the dump file of the monitor process at timeout occurrence
In case that this function is enabled, the dump information of the timed out monitor resource is collected when the monitor resource times out. The collected dump information is written to the /opt/nec/clusterpro/work/rm/"monitor_resource_name"/errinfo.cur folder. When dump is performed more than once, the existing folders are renamed errinfo.1, errinfo.2, and so on. Dump information is collected up to 5 times.
Do Not Retry at Timeout Occurrence
When this function is enabled, recovery action is executed immediately if a monitor resource timeout occurs.
Do Not Execute Recovery Action at Timeout Occurrence
When this function is enabled, recovery action is not executed if a monitor resource timeout occurs.
This can be set only when the Do Not Retry at Timeout Occurrence function is enabled.
Note
For the following monitor resources, the Do Not Retry at Timeout Occurrence and Do Not Execute Recovery Action at Timeout Occurrence functions cannot be set.
User mode monitor resource
Multi target monitor resource
Virtual IP monitor resource
Custom monitor resource (only when Monitor Type is Asynchronous)
Message receive monitor resource
VM monitor resource
Dynamic DNS monitor resource
BMC monitor resource
Oracle Clusterware Synchronization Management monitor resource
JVM monitor resource
System monitor resource
Process resource monitor resource
Retry Count(0 to 999)
Specify how many times an error should be detected in a row after the first one is detected before the status is determined as error. If this is set to zero (0), the status is determined as error at the first detection of an error.
Wait Time to Start Monitoring(0 to 9999)
Set the wait time to start monitoring.
Monitor Timing
Set the monitoring timing. Select the timing from:
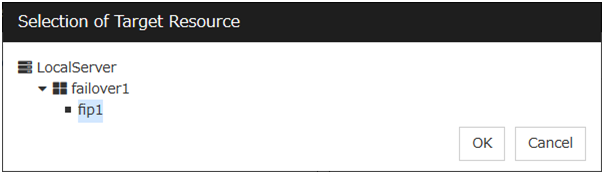
Target Resource
The resource which will be monitored when activated is shown.
Browse
Click this button to open the dialog box to select the target resource. The group names and resource names that are registered in the LocalServer and cluster are shown in a tree view. Select the target resource and click OK.
Nice Value
Set the nice value of a process.
Choose servers that execute monitoring
Choose the servers that execute monitoring.
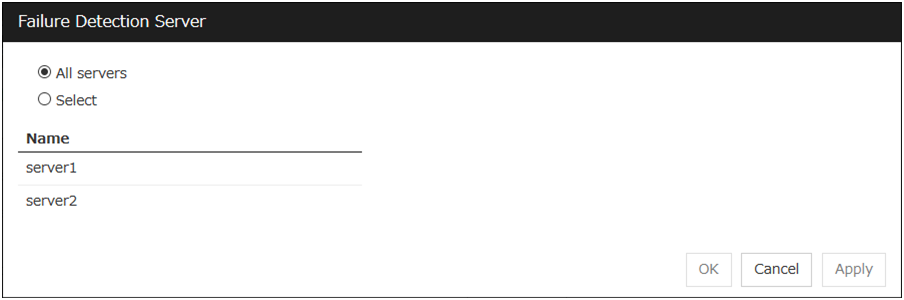
All Servers
All servers monitor the resources.
Select
Servers registered in Available Servers monitor the resources. One or more servers need to be set to Available Servers.
4.2.3. Monitor (special) tab
Some monitor resources require the parameters at the monitoring operaion to be configured. The parameters are described in the explanation part about each resource.
4.2.4. Recovery Action tab
In this dialog box, the recovery target and an action to be taken at the time when an error is detected can be configured. By setting this, it allows failover of the group, restart of the resource and cluster when an error is detected. However, recovery will not occur if the recovery target is not activated.
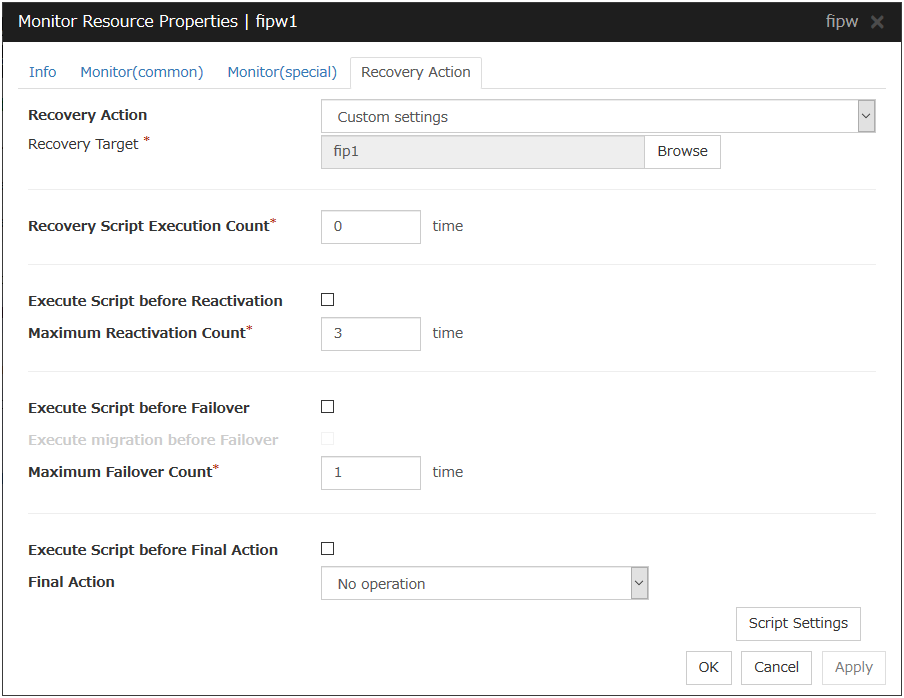
Recovery Action
Select a recovery action when detecting an error.
Recovery Target
A target is shown, which is to be recovered when it is determined as a resource error.
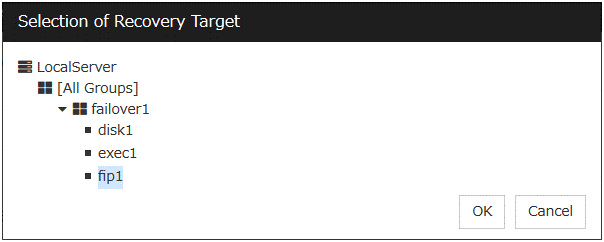
Browse
Click this button to open the dialog box in which the target resource can be selected. The LocalServer, All Groups and group names and resource names that are registered in the cluster are shown in a tree view. Select the target resource and click OK.
Recovery Script Execution Count (0 to 99)
Specify the number of times to allow execution of the script configured by Script Settings when an error is detected. If this is set to zero (0), the script does not run.
Execute Script before Reactivation
Maximum Reactivation Count(0 to 99)
Specify how many times you allow reactivation when an error is detected. If this is set to zero (0), no reactivation is executed. This is enabled when a group or group resource is selected as a recovery target.
When the group to which dynamic failover or a resource which belongs to that group is set as a recovery target of an IP monitor resource or NIC Link Up/Down monitor resource, reactivating the recovery target fails because a monitor resource registered in the exception list detects an error.
Execute Script before Failover
Execute migration before Fail over
When the check box is selected, execute migration before executing failover at error detection.
Maximum Failover Count(0 to 99)
Specify how many times you allow failover after reactivation fails for the number of times set in Maximum Reactivation Count when an error is detected. If this is set to zero (0), no failover is executed. This can be settable when selecting "All Groups", a group or a group resource as the recovery target. When "All Groups" is selected, execute failover of all groups running on the server of which the monitor resource has detected errors.
Execute Script before Final Action
Select whether script is run or not before executing final action.
When clicking Script Settings of Execute Script before Final Action, Edit Script dialogbox is displayed. Set script or script file, and click OK.
Script Settings
Click here to display the Edit Script dialog box. Configure the recovery or pre-recovery action script or commands.
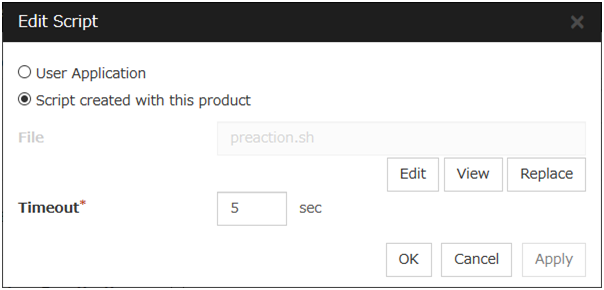
User Application
Use an executable file (executable shell script file or execution file) on the server as a script. For the file name, specify an absolute path or name of the executable file of the local disk on the server. If there is any blank in the absolute path or the file name, put them in double quotation marks ("") as follows.
Example:"/tmp/user application/script.sh"Each executable file is not included in the cluster configuration information of the Cluster WebUI. They must be prepared on each server because they cannot be edited or uploaded by the Cluster WebUI.
Script created with this product
Use a script file which is prepared by the Cluster WebUI as a script. You can edit the script file with the Cluster WebUI if you need. The script file is included in the cluster configuration information.
File(Within 1023 bytes)
Specify a script to be executed (executable shell script file or execution file) when you select User Application.
View
Click here to display the script file when you select Script created with this product.
Edit
Click here to edit the script file when you select Script created with this product. Click Save the script file to apply the change. You cannot modify the name of the script file.
Replace
Click here to replace the contents of a script file with the contents of the script file which you selected in the file selection dialog box when you select Script created with this product. You cannot replace the script file if it is currently displayed or edited. Select a script file only. Do not select binary files (applications), and so on.
Timeout (1 to 9999)
Specify the maximum time to wait for completion of script to be executed. The default value is set as 5.
Final Action
Select a final action to be taken after reactivation fails for the number of times set in Maximum Reactivation Count, and failover fails for the number of times set in Maximum Failover Count when an error is detected.
Select the final action from the options below:
Note
Select No Operation only when (1) temporarily canceling the final action, (2) displaying only an alert when an error is detected, and (3) executing the final action by multi target monitor resource.
Note
If performing the sysrq panic fails, the OS is shut down.
Note
If resetting keepalive fails, the OS is shut down. Do not select this action on the OS and kernel where the clpkhb and clpka drivers are not supported.
Note
If performing the keepalive panic fails, the OS is shut down. Do not select this action on the OS and kernel where the clpkhb and clpka drivers are not supported.
Note
If resetting BMC fails, the OS is shut down. Do not select this action on the server where OpenIPMI is not installed, or the ipmitool command does not run.
Note
If powering off BMC fails, the OS is shut down. Do not select this action on the server whereOpenIPMI is not installed, or the ipmitool command does not run.
Note
If performing the power cycle of BMC fails, the OS is shut down. Do not select this action on the server where OpenIPMI is not installed, or the ipmitool command does not run.
Note
If BMC NMI fails, the OS shutdown is performed. Do not select this action on the server where OpenIPMI is not installed, or the ipmitool command does not run.
Note
If I/O Fencing(High-End Server Option) fails, the OS shutdown is performed.
Collect Dump at Timeout
Select whether to enable this function.
Length: Within 4 bytes
Default value: 0 (disabled)
4.3. Understanding the disk monitor resources
Disk monitor resources monitor disk devices.
It is recommended to use the READ (O_DIRECT) monitoring method for disks where disk monitor resources cannot be used (TUR method).
4.3.1. Monitoring by disk monitor resources
Two ways of monitoring are employed by the disk monitor resource: READ and TUR.
Notes on TUR:
- You cannot run the Test Unit Ready and the SG_IO command of SCSI on a disk or disk interface (HBA) that does not support it. Even if your hardware supports this command, consult the driver specifications because the driver may not support it.
- ioctl may be incorrectly executed for an LVM logical volume (LV) device. Use READ for LV monitoring.
- A TUR method cannot be used for the IDE interface disk.
- In the case of the disk of S-ATA interface, it may be recognized as the IDE interface disk (hd) or as the SCSI interface disk (sd) depending on the type of a disk controller and the distribution to be used. When the disk is recognized as the IDE interface, no TUR methods can be used. If the disk is recognized as the SCSI interface, TUR (genetic) cannot be used but TUR (legacy) can be used.
- Test Unit Ready, compared to Read, burdens OS and disks less.
- In some cases, Test Unit Ready may not be able to detect actual errors in I/O to media.
- You cannot use a partition on the disk by setting it as the target to be monitored. A whole device (whole disk) must be specified.
- Some disk devices may temporarily return Unit Attention at TUR issue, depending on the device status.The temporary return of Unit Attention does not signify a problem. If the TUR retry count is set to 0, however, the above return is determined to be an error and the disk monitor resource becomes abnormal.To avoid this meaningless error detection, set the retry count to one or more.
For the TUR monitoring, one of the following is selected:
TUR
- ioctl is used by the following steps and the status of the device is determined by the result of the command:Run the ioctl (SG_GET_VERSION_NUM) command. The status is determined by the return value of ioctl and the version of SG driver.If the ioctl command runs successfully and the version of SG driver is 3.0 or later, execute ioctl TUR (SG_IO) using the SG driver.If the ioctl command fails or the version of SG driver is earlier than 3.0, execute ioctl TUR which is defined as a SCSI command.
TUR (legacy)
Monitoring is performed by using ioctrl (Test Unit Ready). Test Unit Ready (TUR) which is defined as a SCSI command is used against the specified device, and the status of the device is determined by the result of the command.
TUR (generic)
Monitoring is executed by using ioctl TUR (SG_IO). ioctl TUR (SG_IO) which is defined as a SCSI command is used against the specified device, and the status of the device is determined by the result of the command. Even with a SCSI disk, SG_IO may not work successfully depending on the OS or distribution.
The following is the READ monitoring:
READ
The specified size of the specified device (disk device or partition device) or file is read. Judgment is performed by the size that could be read.
Dummy Read is for determining if the specified size of data can be read. Validity of the data read is not judged.
Burden of the load experienced by the OS and disk is proportional to the size of the data on the specified disk to be read
See "I/O size when READ is selected for disk monitor resources" to configure the read size.
The following is the READ (O_DIRECT) monitoring:
READ (O_DIRECT)
A single sector on the specified device (disk device or partition device) or the file are read without using the cache (O_DIRECT mode), and the results are (the size of the data successfully read) are used to make a judgment.
Judgment is based on whether or not reading has been performed successfully. Validity of the read data is not judged.
The following describes READ (raw) monitoring:
READ (raw)
Like the READ (O_DIRECT) monitoring method, the process to read the specified device is monitored without using the OS cache.
Whether reading was successful is checked. The validity of read data is not checked.
When the READ (raw) monitoring method is specified, partitions that have been or will possibly be mounted cannot be monitored. In addition, a whole device (whole disk) that includes partitions that have been or will possibly be mounted cannot be monitored. Allocate a partition dedicated to monitoring and specify it as the disk monitor resource. (Allocate 10 MB or more to the monitoring partition).
Do not register a raw device that is already registered in the Disk I/F list or Disk Resource under the server properties. For details on the VxVM volume raw device, see "Notes when creating EXPRESSCLUSTER configuration data" , "Verifying raw device for VxVM" in "Notes and Restrictions" of the "Getting Started Guide".
When monitoring the raw device used by the disk heartbeat by using the READ (raw) monitoring method, specify the raw device for Monitor Target Raw Device Name in Cluster WebUI. Do not fill in Device Name.
The following describes READ (VXVM) monitoring:
READ (VXVM)
Like the READ (O_DIRECT) monitoring method, the process to read the specified device is monitored without using the OS cache.
Whether reading was successful is checked. The validity of read data is not checked.
The READ (VXVM) monitoring method can be used only when the file system of the volume raw device is vxfs.
The following is the WRITE (FILE) monitoring:
WRITE (FILE)
The file of the specified path is created, written, and deleted to be judged. Validity of the written data is not judged.
4.3.2. I/O size when READ is selected for disk monitor resources
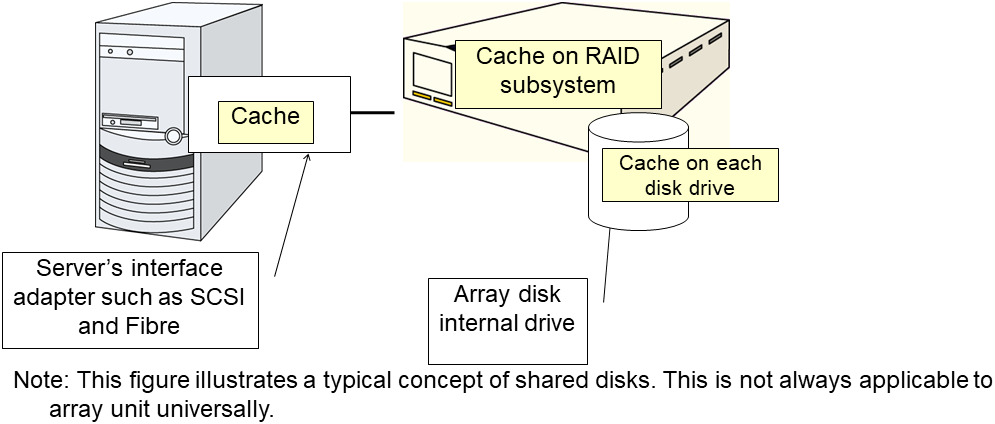
Enter the size of data when READ is selected as a method of monitoring.
Depending on the shared disk and interfaces in your environment, various caches for reading may be implemented. Because of this, when the specified read size is too small, READ may hit in cache, and may not be able to detect read errors.
When you specify a READ I/O size, verify that READ can detect I/O errors on the disk with that size by intentionally creating I/O errors.
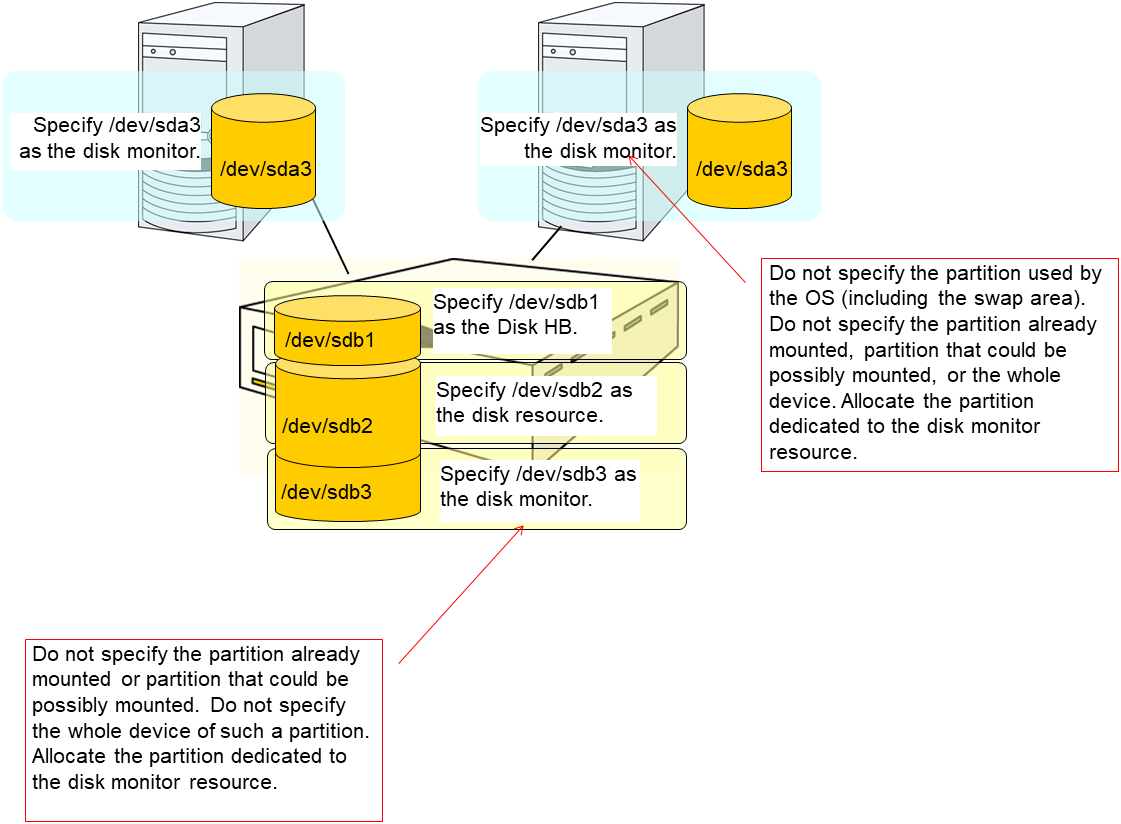
4.3.3. Setup example when READ (raw) is selected for the disk monitor resource
Example of setting up disk resources and disk monitoring
Disk Resource
Disk Monitor Resource (The HDDs installed in both servers are monitored in the READ (raw) mode.)
Disk Monitor Resource (The shared disk is monitored in the READ (raw) mode.
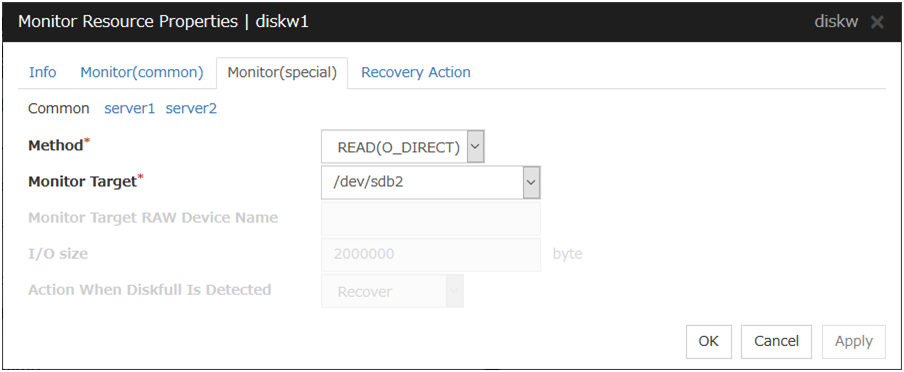
4.3.4. Monitor (special) tab

Method Server Individual Setup
Select the method used to monitor the disk device from the following:
TUR
TUR(generic)
TUR(legacy)
READ
READ (O_DIRECT)
WRITE (FILE)
READ (RAW)
READ (VXVM)
Monitor Target (Within 1023 bytes) Server Individual Setup
Monitor Target RAW Device Name (Within 1023 bytes) Server Individual Setup
This can be specified only when the monitoring method is READ (raw) or READ (VXVM).
To create an association with a disk resource, specify the dependent disk resource for Target Resource in "Monitor (common) tab" Specify that monitoring start after the specified disk resource is activated.
I/O Size (1 to 99999999) Server Individual Setup
Specify the size of I/O for reading or reading/writing when READ or WRITE (FILE) is selected as a monitoring method.
When READ (RAW) , READ(O_DIRECT) or READ (VXVM) is specified, the I/O size text box is dim. A single sector is read from the target device.
If TUR, TUR (generic), or TUR (legacy) is specified, this setting is ignored.
Action When Diskfull is Detected Server Individual Setup
Select the action when diskfull (state in which the disk being monitored has no free space) is detected.
Note
If READ, READ (RAW), READ (VXVM), READ (O_DIRECT), TUR, TUR (generic), or TUR (legacy) is specified, the Action when diskfull is detected option is grayed out.
When a local disk is specified in Target Device Name, a local disk on the server can be monitored.
Example of settings to monitor the local disk /dev/sdb by READ method, and to reboot the OS when an error is detected:
Option
Value
Remarks
Target Device Name
/dev/sdb
SCSI disk in the second machine.
Method
READ
READ method.
Recovery Target
Nothing
-
Final Action
Stop cluster service and reboot OS
Reboot the OS.
Example of settings to monitor the local disk /dev/sdb by TUR (generic) method, and select No Operation (sending an alert to the Cluster WebUI only) as the final action when an error is detected:
Option
Value
Remarks
Target Device Name
/dev/sdb
SCSI disk in the second machine.
Method
TUR(generic)
SG_IO method
Final Action
No Operation
4.4. Understanding IP monitor resources
IP monitor resource monitors IP addresses using the ping command.
4.4.1. Monitoring by IP monitor resources
IP monitor resource monitors specified IP addresses by using the ping command. If all IP addresses do not respond, the status is determined to be error.
To check the responses of IP addresses, packet types 0 (Echo Reply) and 8 (Echo Request) of ICMP are used.
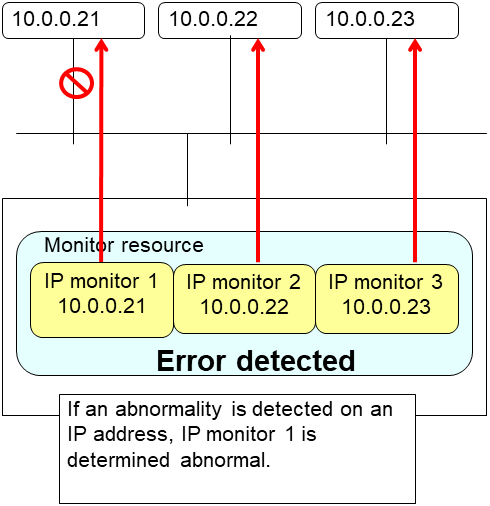
If you want to establish error when all of the multiple IP addresses have error, register all those IP addresses with one IP monitor resource.
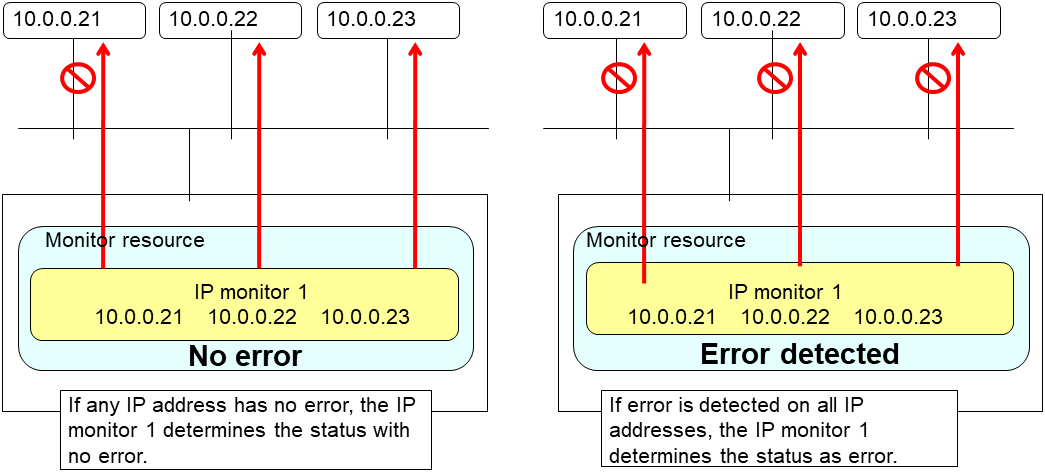
If you want to establish error when any one of IP addresses has an error, create one IP monitor resource for each IP address.
4.4.2. Monitor (special) tab
IP addresses to be monitored are listed in IP Addresses.
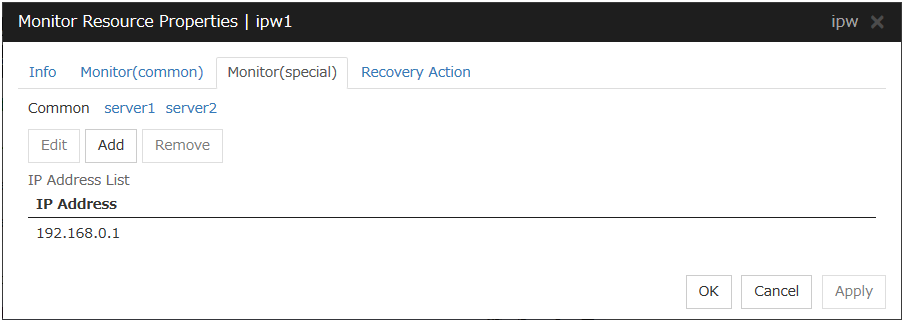
Add
Click Add to add an IP address to be monitored. A dialog box where an IP address can be entered is displayed.
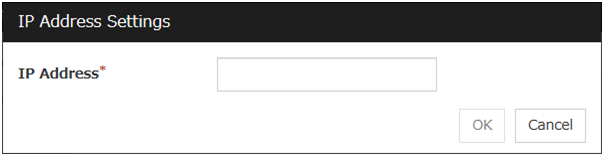
IP Address (Within 255 bytes) Server Individual Setup
Enter an IP address or a host name to be monitored in this field and click OK. The IP address or host name you enter here should be the one that exists on the public LAN. If a host name is set, the name resolution in the OS (such as adding an entry to /etc/hosts) should be configured.
Remove
Click Remove to remove an IP address selected in IP Addresses from the list so that it will no longer be monitored.
Edit
Click Edit to display the IP Address Settings dialog box. The dialog box shows the IP address selected in IP Addresses on the Parameter tab. Edit the IP address and click OK.
4.5. Understanding floating IP monitor resources
Floating IP monitor resources monitor floating IP resources.
4.5.1. Monitoring by floating IP monitor resources
4.5.2. Note on floating IP monitor resources
- This monitor resource is automatically registered when a floating IP resource is added. A floating IP monitor resource corresponding to a floating IP resource is automatically registered.Floating IP monitor resources are initially defaulted, so configure appropriate resource settings as needed.
4.5.3. Monitor (special) tab
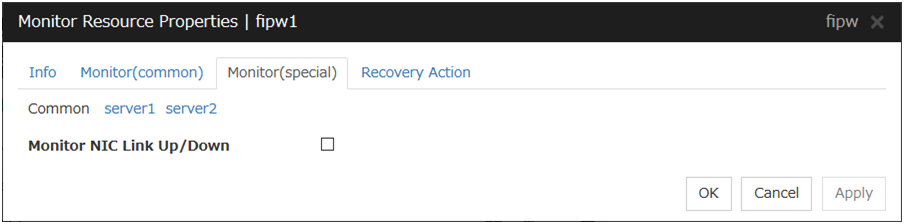
Monitor NIC Link Up/Down
Specify whether to monitor NIC Link Up/Down. If you have enabled, you can monitor the NIC Link Up/Down for the NIC that granted the floating IP. For this reason, a new set of NIC Link Up/Down monitor resource for the NIC that granted the floating IP is not required.
4.6. Understanding NIC Link Up/Down monitor resources
4.6.1. System requirements for NIC Link Up/Down monitor resource
Network interfaces supporting NIC Link Up/Down monitor resource
NIC Link Up/Down monitor resource has been tested to work in the following network interfaces.
Ethernet Controller(Chip) |
Bus |
Driver version |
|---|---|---|
Intel 82557/8/9 |
PCI |
3.5.10-k2-NAPI |
Intel 82546EB |
PCI |
7.2.9 |
Intel 82546GB |
PCI |
7.3.20-k2-NAPI 7.2.9 |
Intel 82573L |
PCI |
7.3.20-k2-NAPI |
Intel 80003ES2LAN |
PCI |
7.3.20-k2-NAPI |
Broadcom BCM5721 |
PCI |
7.3.20-k2-NAPI |
4.6.2. Note on NIC Link Up/Down monitor resources
ethtool eth0
Settings for eth0:
    Supported ports: [ TP ]
    Supported link modes:  10baseT/Half 10baseT/Full
                    100baseT/Half 100baseT/Full
                    1000baseT/Full
    Supports auto-negotiation: Yes
    Advertised link modes: 10baseT/Half 10baseT/Full
                    100baseT/Half 100baseT/Full
                    1000baseT/Full
    Advertised auto-negotiation: Yes
    Speed: 1000Mb/s
    Duplex: Full
    Port: Twisted Pair
    PHYAD: 0
    Transceiver: internal
    Auto-negotiation: on
    Supports Wake-on: umbg
    Wake-on: g
    Current message level: 0x00000007 (7)
    Link detected: yes
When the LAN cable link status ("Link detected: yes") is not displayed in the result of the ethtool command:
It is highly likely that NIC Link Up/Down monitor resource of EXPRESSCLUSTER is unable to operate. Use the IP monitor resource instead.
When LAN cable link status ("Link detected: yes") is displayed in the result of the ethtool command:
In most cases NIC Link Up/Down monitor resource of EXPRESSCLUSTER can operate, but sometimes it may not operate.
Particularly in the following hardware, NIC Link Up/Down monitor resource of EXPRESSCLUSTER may not operate. Use IP monitor resource instead.
When hardware is installed between the actual LAN connector and NIC chip such as a blade server
When you check if NIC Link Up/Down monitor resource can be used with the use of EXPRESSCLUSTER on a machine for a production environment, follow the steps below.
- Register NIC Link Up/Down monitor resource with the configuration data.Select No Operation for the configuration of recovery operation of NIC Link Up/Down monitor resource upon failure detection.
- Start the cluster.
- Check the status of NIC Link Up/Down monitor resource.If the status of NIC Link Up/Down monitor resource is abnormal while LAN cable link status is normal, NIC Link Up/Down monitor resource cannot be used.
- If NIC Link Up/Down monitor resource status becomes abnormal when LAN cable link status is made abnormal status (link down status), (NIC Link Up/Down monitor resource can be used).If the status remains to be normal, NIC Link Up/Down monitor resource cannot be used.
4.6.3. Configuration and range of NIC Link Up/Down monitoring
The ioctl( ) to the NIC driver is used to find how the server is linked to the network. (For the IP monitoring, the status is judged by the ping response from the specified IP address.)
You can monitor an NIC dedicated to interconnect (mirror connect). If you do this in the environment where two nodes are directly connected with a LAN cable and one server fails, the other server is considered to be failing. This is because no link is established. The recovery action to be taken at detection of error should be configured with the appropriate value. For example, if Stop cluster daemon and reboot OS is selected, other servers will continue to restart the OS endlessly.
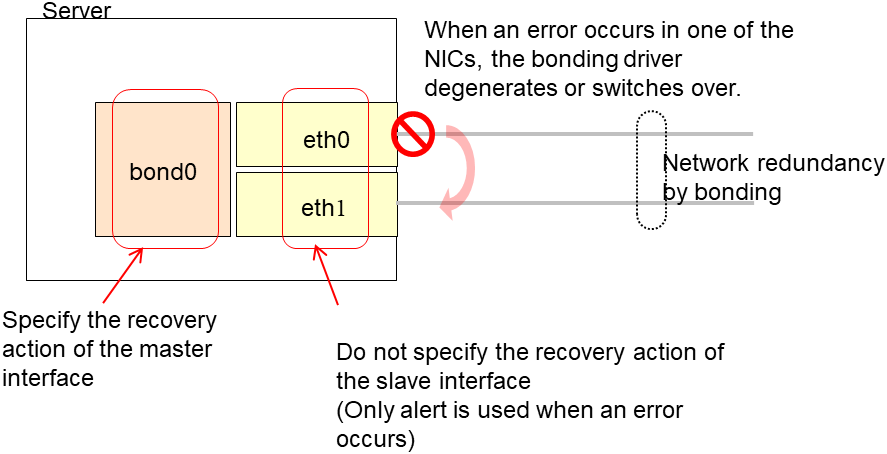
If the network is has a bonding status, it is possible to monitor the master interface (bond0...) as well as the slave interface (eth0, eth1...) in the lower level, while applying the bonding availability. It is recommended to use the settings below.
Slave Interface Recovery action when an error is detected: Set no action
When only one of the network cables (eth0) fails, EXPRESSCLUSTER issues an alert, while no recovery action takes place. The network recovery is performed by bonding.
Master Interface
Recovery action when an error is detected: Set actions such as failover and shutdown. When all slave interfaces fail (and the master interface is down), the EXPRESSCLUSTER performs the recovery action.
4.6.4. Monitor (special) tab
NIC Link Up/Down monitor resource obtains the information on how the specified NIC is linked monitors the linkage is up or down.
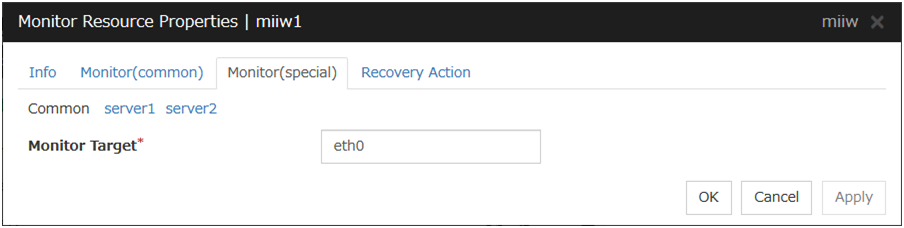
Monitor Target (Within 15 bytes) Server Individual Setup
Enter the name of the NIC interface you want to monitor. You can monitor Bond devices (e.g. bond.600) and team devices (e.g. team0). You can also monitor VLAN and tagVLAN (setting example: eth0.8).
4.7. Understanding mirror disk connect monitor resources
4.7.1. Note on mirror disk connect monitor resources
A mirror disk connect monitor resource monitors a network for mirroring. If communication of mirror data using the specified mirror disk connect fails, it is recognized as an error. This resource is automatically registered when the mirror disk resource is added.
When more than one mirror disk resource is added, the same number of mirror disk connect monitor resources as the one of mirror resources is automatically registered.
4.7.2. Monitor (special) tab
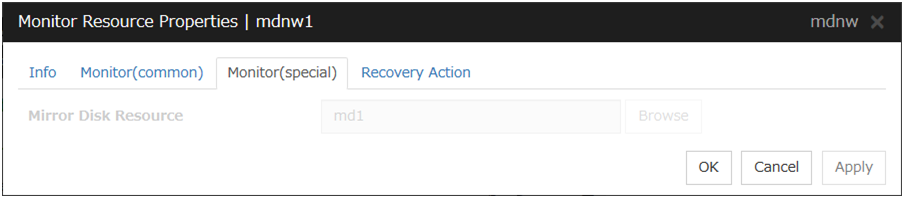
Mirror Disk Resource
The mirror disk resource to be monitored is displayed.
4.8. Understanding mirror disk monitor resources
Mirror disk monitor resources monitor the state of date of mirror disk and the soundness of mirror driver.
4.8.1. Note on mirror disk monitor resources
This resource is automatically registered when a mirror disk resource is added. A mirror disk monitor resource corresponding to a mirror disk resource is automatically registered.
4.8.2. Monitor (special) tab

Mirror Disk Resource
The mirror disk resource to be monitored is displayed.
4.9. Understanding hybrid disk connect monitor resources
4.9.1. Note on hybrid disk connect monitor resources
A mirror disk connect monitor resource monitors a network for mirroring. If communication of mirror data using the specified mirror disk connect fails, it is recognized as an error. This resource is automatically registered when the hybrid disk resource is added.
When more than one hybrid disk resource is added, hybrid disk connect monitor resources as many as the number of the hybrid disk resources are automatically registered.
4.9.2. Monitor (special) tab
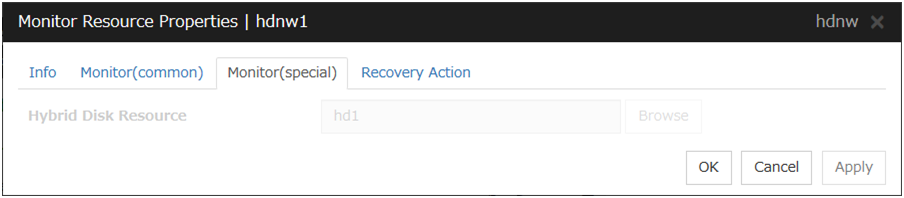
Hybrid Disk Resource
The hybrid disk resource to be monitored is displayed.
4.10. Understanding hybrid disk monitor resources
Hybrid disk monitor resources monitor the status of the data in the hybrid disk and the health of the mirror driver.
4.10.1. Note on hybrid disk monitor resources
This resource is automatically registered when a hybrid disk resource is added. Hybrid disk monitor resources corresponding to hybrid disk resources are automatically registered.
4.10.2. Monitor (special) tab
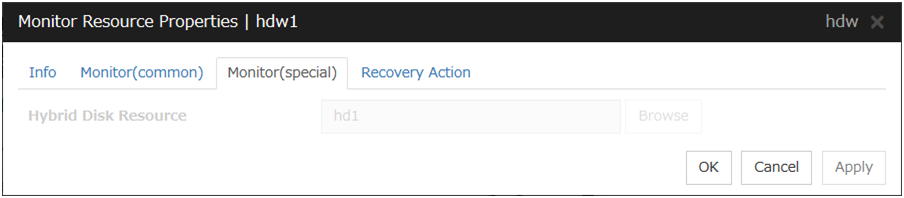
Hybrid Disk Resource
The hybrid disk resource for monitoring is displayed.
4.11. Understanding PID monitor resources
4.11.1. Note on PID monitor resources
PID monitor resource monitors a successfully activated EXEC resource. The EXEC resource can be monitored if its settings for activation are configured to Asynchronous.
4.11.2. Setting PID monitor resources
Note
To monitor stalls such as data base, samba, apache, and sendmail, purchase optional EXPRESSCLUSTER product.
4.12. Understanding User mode monitor resources
4.12.1. Drivers that User mode monitor resources depend
Monitor by: softdog
softdog
If softdog is selected as a monitoring method, the softdog driver is required.
Use a loadable module configuration. User-mode monitor resources do not work on the static driver.
If the softdog driver is not available, monitoring cannot be started.
Monitor by: keepalive
clpkaclpkhb
If keepalive is selected as a monitoring method, the clpkhb driver and the clpka driver of the EXPRESSCLUSTER are required.
When keepalive is set to the monitoring method, it is recommended to set the kernel mode LAN heartbeat. To use the kernel mode LAN heartbeat, the clpkhb driver is required.
The clpka driver and the clpkhb driver are provided by EXPRESSCLUSTER. For information on support, refer to "Supported distributions and kernel versions" in "Software" in "Installation requirements for EXPRESSCLUSTER" in the "Getting Started Guide".
You cannot start monitoring if the clpkhb driver and the clpka driver cannot be used.
Monitor by: ipmi, ipmi (High-End Server Option)
ipmi
If ipmi or ipmi (High-End Server Option) is used as a monitoring method, this driver is required.
If the ipmi driver is not loaded, monitoring cannot be started.
4.12.2. How monitor User mode monitor resources perform monitoring
You can select how a user-mode monitor resource monitors its target from the following:
Monitor by: softdog
If softdog is selected as a monitoring method, the softdog driver of the OS is used.
Monitor by: keepalive
If keepalive is selected as a monitoring method, the clpkhb and the clpka drivers are used.
Note
Always check the distributions and the kernel versions on which the clpkhb driver and the clpka driver can be operated with "Supported distributions and kernel versions" in "Software" in "Installation requirements for EXPRESSCLUSTER" in the "Getting Started Guide". Check them when applying a security patch released by a distributor to the operating cluster (when the kernel version changes).
Monitor by: ipmi, ipmi (High-End Server Option)
If ipmi or ipmi (High-End Server Option) is selected as a monitoring method, the ipmi driver is used.
Monitor by: none
"none" is a monitoring method is used for evaluation. This only executes operations of the advanced settings of the user-mode monitor resource. Do not use this in a production environment.
4.12.3. Advanced settings of User mode monitor resource
Opening/closing of a dummy file, writing to a dummy file and creating a dummy thread are the configurations that allow advance user-mode monitor resource. If any of these configurations fail, the timer will not be updated. If a configuration continues to fail for the period of time set for the timeout or heartbeat timeout, the OS is reset.
Opening/closing a dummy file
A dummy file is created, opened, closed and then deleted at every monitoring interval repeatedly.
When this advanced function is set and there is no free disk space, opening the dummy file fails and the OS is reset.
Writing to a dummy file
A specified size of data is written into a dummy file at every monitoring interval.
This advanced function is not available unless opening/closing a dummy file is set.
Creating a dummy thread
A dummy thread is created at every monitoring interval.
4.12.4. User mode monitor resource logic
Monitoring method: IPMI
Process overview
Steps 2 to 7 of the process are repeated.
Set the IPMI timer
Open a dummy file
Write to the dummy file
Execute fdatasync for the dummy file
Close the dummy file
Create a dummy thread
Updated the IPMI timer
Steps 2 to 6 of the process overview are for advanced settings. To execute these steps, you need to configure the settings.
- What happens when timeout does not occur (i.e. Steps 2 to 7 are performed without any problem):Recovery actions such as resetting are not performed.
- What happens when timeout occurs (i.e. any of Steps 2 to 7 is stopped or delayed):Reset is performed by BMC (the management function of the server).
Advantages
This method of is less likely to be impacted by a kernel space failure, which makes chance of reset higher because BMC (the management function of the server itself) is used.
Disadvantages
This method is not available on servers not supporting IPMI or on which OpenIPMI does not run. This is because this monitoring method is hardware dependent.
This method is not available on a server where NEC ESMPRO Agent is used.
This method may not be able to coexist with software programs for server monitoring that are supplied by server vendors.
Monitoring method: softdog
Process overview
Steps 2 to 7 of the process are repeated.
Set softdog
Open a dummy file
Write to the dummy file
Execute fdatasync for the dummy file
Close the fumy file
Create a dummy thread
Update the softdog timer
Steps 2 to 6 of the process overview are for advanced settings. To execute these steps, you need to configure the settings.
- What happens when timeout does not occur (i.e. Steps 2 to 7 are performed without any problem):Recovery actions such as reset are not performed.
- What happens when timeout occurs (i.e. any of Steps 2 to 7 is stopped or delayed):Reset is performed by softdog.
Advantages
- Since this method is not dependent on hardware, you can use it as long as there is a softdog kernel module.(In some distributions, softdog is not provided by default. Check that you have softdog before configuring the settings.)
Disadvantages
Because softdog is dependent on the timer logic of the kernel space, reset may not be performed if an error occurs in the kernel space.
Monitoring method: keepalive
Process overview
Steps 2 to 7 are repeated.
Set the keepalive timer
Open a dummy file
Execute write to the dummy file
Execute fdatasync to the dummy file
Close the dummy file
Create a dummy thread
Update the keepalive timer
Steps 2 to 6 of the process overview are for advanced settings. To execute these steps, you need to configure the settings
When a timeout does not occur (i.e. Steps 2 to 7 are performed without any problem): Recovery actions such as reset are not performed.
When a timeout occurs (i.e. any of Steps 2 to 7 is stopped or delayed):
Reset of the local server is announced to other servers through clpkhb.ko.
Reset or panic is performed by clpka.ko according to the action setting.
Advantage
Logs are recorded on other servers by announcement of the reset of the local server through execution of clpkhb.
Disadvantages
Distributions, architectures, kernel versions which can be operated (which provide drivers) are limited.
Because clpka is dependent on the timer logic of the kernel space, reset may not be performed if an error occurs in the kernel space.
Monitoring method: ipmi (High-End Server Option)
It can't be used.
4.12.5. Checking availability of IPMI
You can quickly check if OpenIPMI runs on the server by following the steps below:
Install the rpm package of OpenIPMI.
Run /usr/bin/ipmitool.
Check the result of the execution.
Watchdog Timer Use: BIOS FRB2 (0x01)
Watchdog Timer Is: Stopped
Watchdog Timer Actions: No action (0x00)
Pre-timeout interval: 0 seconds
Timer Expiration Flags: 0x00
Initial Countdown: 0 sec
Present Countdown: 0 sec
You can use OpenIPMI. ipmi can be chosen as a monitoring method.
4.12.6. User mode monitor resources
All monitoring methods:
When a cluster is added by the Cluster WebUI, a user-mode monitor resource of softdog is automatically created.
A user-mode monitor resource with different monitoring method can be added. A user-mode monitor resource of softdog that was automatically created can be deleted when a cluster is added.
When the activation of a user-mode monitor resource fails due to a reason such as the softdog driver of OS or the clpkhb/clpka driver of EXPRESSCLUSTER does not exist, or the rpm for OpenIPMI is not installed, "Monitor userw failed." will be displayed on the Alert logs in the Cluster WebUI,. In the tree view of the Cluster WebUI, as the response to the clpstat command, Normal will be displayed as the resource status, and Offline will be displayed as the status of each server.
Monitoring by IPMI:
For notes on ipmi, see "IPMI command" in "Monitor resource " in "4. Monitor resource details" in this guide.
Note
Monitoring by ipmi (High-End Server Option)
It can't be used.
Monitoring by keepalive
Notification to other servers are performed only when a kernel mode LAN heartbeat resource is set. In this case, the following log is displayed on the syslog.
kernel: clpka: <server priority: %d> <reason: %s> <process name: %s>system reboot.
4.12.7. Monitor (special) tab
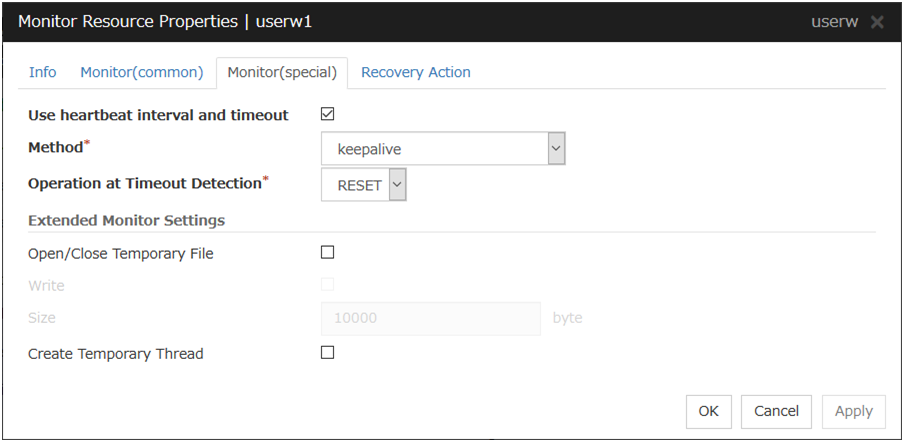
Use heartbeat interval and timeout
Select this check box if you use heartbeat's interval and timeout for monitor's interval and timeout.
Method
Choose how you want to monitor the user-mode monitor resource from the following.You can not select a method which has already been used for other user-mode monitor resource.
Operation at Timeout Detection
Select the final action. This can be set only when the monitoring method is keepalive.
Open/Close Temporary File
Select this check box if you want to open/close a dummy file at every interval when you execute monitoring.
Write
Select this check box if you have chosen to open/close a dummy file and want to write in dummy data.
Size (1 to 9999999)
If you have chosen to write dummy data into a dummy file, specify the size to write in.
Create Temporary Thread
Select this check box if you want to create a dummy thread when monitoring is performed.
4.13. Understanding multi target monitor resources
The multi target monitor resource monitors more than one monitor resources.
4.13.1. Notes on multi target monitor resources
The multi target monitor resources regard the offline status of registered monitor resources as being an error. For this reason, for a monitor resource that performs monitoring when the target is active is registered, the multi target monitor resource might detect an error even when an error is not detected by the monitor resource. Do not, therefore, register monitor resources that perform monitoring when the target is active.
4.13.2. Multi target monitor resource status
The status of the multi target monitor resource is determined by the status of registered monitor resources.
The table below describes status of multi target monitor resource when the multi target monitor resource is configured as follows:
The number of registered monitor resources 2Error Threshold 2Warning Threshold 1
Multi target monitor resource status |
Monitor resource1 status |
|||
|---|---|---|---|---|
Normal |
Error |
Offline |
||
Monitor resource2 status |
Normal |
normal |
caution |
caution |
Error |
caution |
error |
error |
|
Offline |
caution |
error |
normal |
|
- Multi target monitor resource monitors status of registered monitor resources.If the number of the monitor resources with the error status exceeds the error threshold, the status of the multi target monitor resource becomes error.If the number of the monitor resources with the caution status exceeds the caution threshold, the status of the multi target resource becomes caution.If all registered monitor resources are in the status of stopped (offline), the status of multi target monitor resource becomes normal. Unless all the registered monitor resources are stopped (offline), the multi target monitor resource recognizes the stopped (offline) status of a monitor resource as error.
- If the status of a registered monitor resource becomes error, actions for the error of the monitoring resource are not executed.Actions for error of the multi target monitor resource are executed only when the status of the multi target monitor resource becomes error.
4.13.3. Example of the multi target monitor resource configuration
- An example of disk path duplication driver usageThe status should be indicating an error only when disk devices (for example, /dev/sdb and /dev/sdc) fail at the same time.
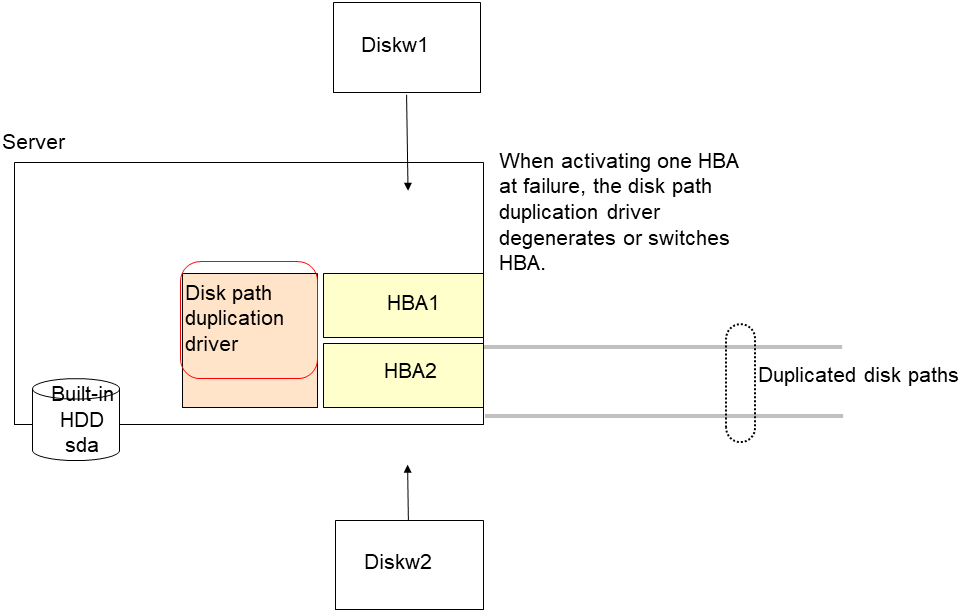
Monitor resources to be registered with the multi target monitor resources (mtw1):
diskw1
diskw2
Error Threshold and Warning Threshold of multi target monitor resource (mtw1)
Error Threshold 2
Warning Threshold 0
Detailed settings of the monitor resource to be registered with the multi target monitor resource (mtw1)
- Disk monitor resource (diskw1)Target Device Name: /dev/sdbReactivation Threshold: 0Failover Threshold: 0Final Action: No Operation
- Disk monitor resource (diskw2)Target Device Name: /dev/sdcReactivation Threshold: 0Failover Threshold: 0Final Action: No Operation
With the settings above, even if either of diskw1 and diskw2, which are registered as monitor resources of the multi target monitor resource detects an error, no actions for the monitor resource having the error are taken.
Actions for an error set to the multi target monitor resource are executed when the status of both diskw1 and diskw2 become error, or when the status of two monitor resources become error and offline.
4.13.4. Monitor (special) tab
Monitor resources are grouped and the status of the group is monitored. You can register up to 64 monitor resources in the Monitor Resources.
When the only one monitor resource set in the Monitor Resources is deleted, the multi target monitor resource is deleted automatically.
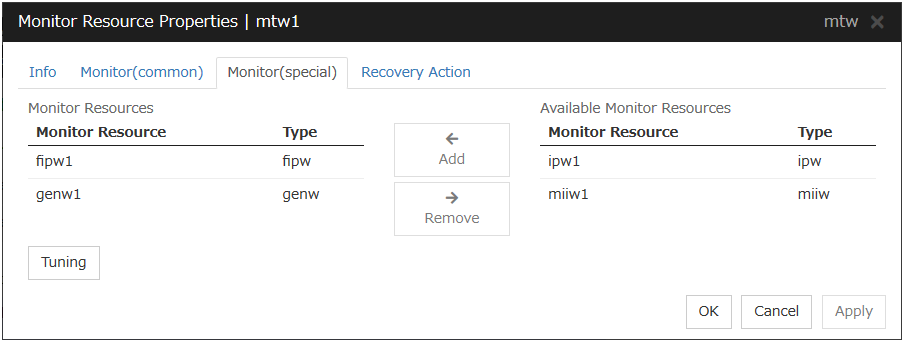
Add
Click Add to add a selected monitor resource to Monitor Resources.
Remove
Click Remove to delete a selected monitor resource from Monitor Resources.
Tuning
Open Multi Target Monitor Resource Tuning Properties dialog box. Configure detailed settings for the multi target monitor resource.
MultiTarget Monitor Resource Tuning Properties
Parameter tab
Display the details of setting the parameter
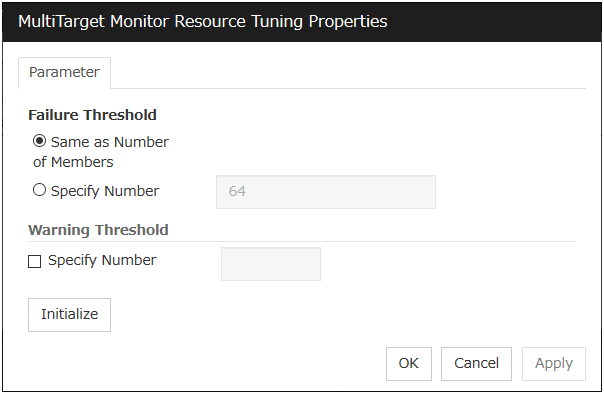
Error Threshold
Select the condition for multi target monitor resources to be determined as an error.
Same as Number of Members
The status of multi target monitor resources becomes "Error" when all monitor resources specified to be under the multi target monitor resource are failed, or when "Error" and "Offline" co-exist.
The status of multi target monitor resources becomes "Normal" when the status of all monitor resources specified to be under the multi target monitor resource are "Offline."
Specify Number
The status of multi target monitor resources becomes "Error" when the number of monitor resources specified in Error Threshold becomes "Error" or "Offline."
When the status of some monitor resources among those specified to be under the multi target monitor resource, specify how many monitor resources need to be "Error" or "Offline" to determine that the status of multi target monitor resource is "Error."
Warning Threshold
Initialize
Clicking Initialize resets all items to their default values.
4.14. Understanding virtual IP monitor resources
4.14.1. Note on virtual IP monitor resources
Virtual IP monitor resource is created automatically when the virtual IP resource is created. One virtual IP monitor resource is created per virtual IP resource automatically.
Virtual IP monitor resource cannot be deleted. It is deleted automatically at deletion of a virtual IP resource.
Do not change the recovery target.
Monitoring cannot be suspended or resumed by the clpmonctrl command or the Cluster WebUI.
Virtual IP monitor resource regularly sends RIP packets to control a path of the virtual IP resource. If the target virtual IP resource is active while the cluster is suspended, the virtual IP monitor resource continues operating.
The setting of Monitor(common) tab-Retry Count is invalid. When you'd like to delay error detection, please change the setting of Monitor(common) tab-Timeout.
4.14.2. Setting virtual IP monitor resources
Virtual IP monitor resource sends packets for dynamic routing of the routing table the virtual IP resource requires. The status of IP addresses activated by the virtual IP resources is not checked. There is no detailed setting for the virtual IP monitor resource.
4.15. Understanding ARP monitor resources
ARP monitor resource sends ARP packets regularly to maintain and update the ARP table for active floating IP resources or virtual IP resources.
4.15.1. Note on ARP monitor resources
For details on the ARP broadcast packets that ARP monitor resource sends, see "Understanding Floating IP resource" of "3. Group resource details" in this guide.
The status of the IP address activated by floating IP resource or virtual IP resource is not checked.
Only floating IP resource or virtual IP resource can be selected as a target monitoring resource of ARP monitor resource. On the ARP monitor resource setting, make sure to select a same resource for Target Resource on the Monitor(common) tab and Target Resource on the Monitor(special) tab.
Monitoring of the ARP monitor resource cannot be suspended or resumed by the clpmonctrl command or by the Cluster WebUI.
4.15.2. Monitor (special) tab
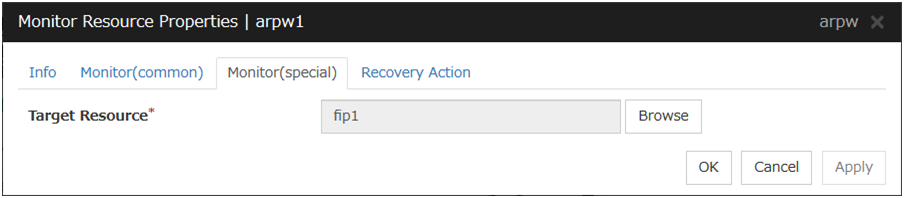
Target Resource
Click Browse to display the dialog box to select a target resource. The names of groups, floating IP resources and virtual IP resources registered to a LocalServer and cluster are displayed in the tree view. Select the resource you want to set as a target resource, and then click OK.
Note
When you change the target resource, make sure to change the one configured on the Monitor(common) tab.
4.16. Understanding custom monitor resources
Custom monitor resources monitor system by executing an arbitrary script.
4.16.1. Notes on custom resources
When the monitor type is Asynchronous, and the monitoring retry count is set to 1 or more, monitoring cannot be performed correctly. When you set the monitor type to Asynchronous, also specify 0 as the monitoring retry count.
When the Script Log Rotate function is enabled, a process is generated to mediate the log output. This intermediate process continues to work until the file descriptor is closed (i.e. until all the logs stop being output from the start and stop scripts and from a descendant process that takes over the standard output and/or the standard error output from the start and stop scripts). To exclude output from the descendant process from the log, redirect the standard output and/or the standard error output when the process is generated with the script.
4.16.2. Monitoring by custom monitor resources
4.16.3. Monitor (special) tab
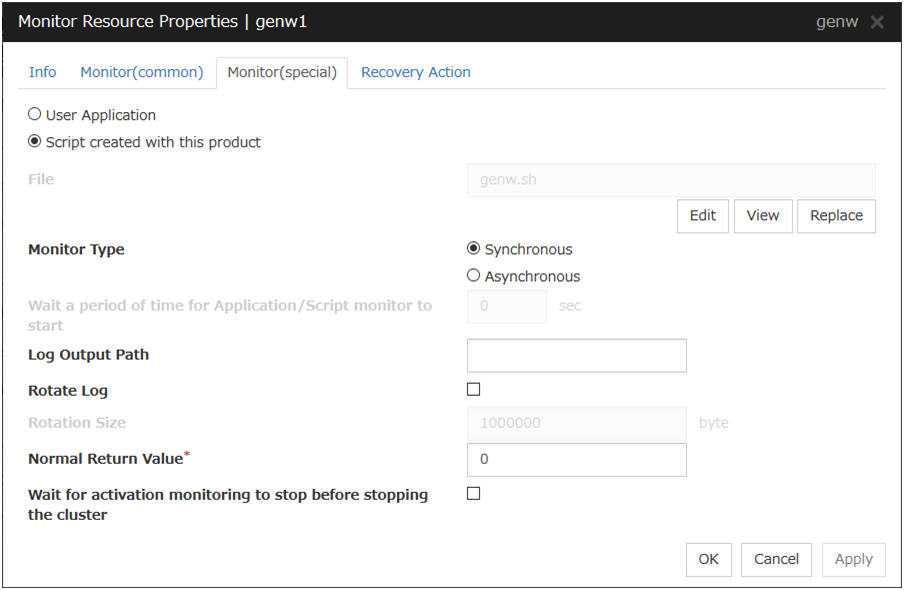
User Application
Use an executable file (executable shell script file or execution file) on the server as a script. For the file name, specify an absolute path or name of the executable file of the local disk on the server.
Each executable files is not included in the cluster configuration information of the Cluster WebUI. They must be prepared on each server because they cannot be edited nor uploaded by the Cluster WebUI.
Script created with this product
Use a script file which is prepared by the Cluster WebUI as a script. You can edit the script file with the Cluster WebUI if you need. The script file is included in the cluster configuration information.
File (Within 1023 bytes)
Specify the script to be executed (executable shell script file or execution file) when you select User Application with its absolute path on the local disk of the server.
View
Click here to display the script file when you select Script created with this product.
Edit
Click here to edit the script file when you select Script created with this product. Click Save to apply the changes. You cannot modify the name of the script file.
Replace
Click here to replace the contents of a script file with the contents of the script file which you selected in the file selection dialog box when you select Script created with this product. You cannot replace the script file if it is currently displayed or edited. Select a script file only. Do not select binary files (applications), and so on.
Monitor Type
Select a monitor type.
Wait for the application/script monitoring to start for a certain period of time (0 to 9999)
Specify the delay time from the start of the application/script and that of monitoring for the Asynchronous monitor type. This delay value must be set smaller than the timeout value specified under the Monitor (common) tab.
Note
The set value becomes valid next time you start the monitor.
Default value: 0
Log Output Path (Within 1023 bytes)
Specify log output path for the script of custom monitor resource.
Pay careful attention to the free space in the file system because the log is output without any limitations when the file name is specified and the Rotate Log check box is unchecked.
When the Rotate Log check box is selected, output log files are rotated.
Rotate Log
Turn this off to output execution logs of scripts and executable files with no limit on the file size.
Turn it on to rotate and output the logs. In addition, note the following.
Enter the log path in 1009 bytes or less in Log Output Path. If the path exceeds 1009 bytes, the logs are not output.
The log file name must be 31 bytes or less. If the name exceeded 32 bytes, the logs are not output.
If some custom monitor resources are configured to rotate logs, and the log file names are the same but the log paths are different, the Log Rotate Size may be incorrect.
(for example, /home/foo01/log/genw.log, /home/foo02/log/genw.log)
Rotation Size (1 to 9999999)
Specify a file size for rotating files when the Rotate Log check box is selected.
The log files that are rotated and output are configured as described below.
File name
Description
Log Output Path specified_file_name
Latest log file.
Log Output Path specified_file_name.pre
Former log file that has been rotated.
Normal Return Value (Within 1023 bytes)
When Asynchronous is selected for Monitor Type, set the values of script error code to be determined as normal. If you want to set two or more values here, separate them by commas like 0,2,3 or connect them with a hyphen to specify the range like 0-3.
Default value: 0
Wait for activation monitoring to stop before stopping the cluster
The cluster stop waits until the custom monitor resource is stopped. This is effective only when the monitoring tyming is set to Active.
4.17. Understanding volume manager monitor resources
Volume manager monitor resources are used to monitor logical disks managed by the volume manager.
4.17.1. Notes on volume manager monitor resources
When the volume manager is VxVM, volmgrw uses the daemon monitoring method. Therefore, registering multiple items in a single cluster is meaningless.
When specifying VxVM as the volume manager, do not specify the recovery target.
When monitoring the LVM by using the volume manager monitor resource in an environment of Red Hat Enterprise Linux 7 or later, the LVM metadata daemon must be disabled.
4.17.2. Monitoring by volume manager monitor resources
The monitoring method used by volume manager monitor resources depends on the type of volume manager that manages the target logical disks.
The following volume managers are supported:
lvm (LVM volume group)
vxvm (VxVM daemon)
zfspool (ZFS storage pool)
4.17.3. Monitor (special) tab
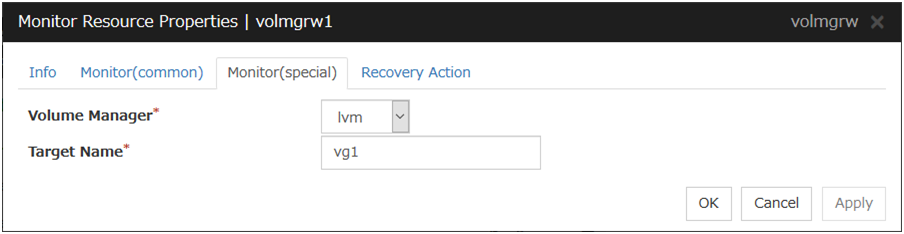
Volume Manager
Specify the type of volume manager that manages the monitor target logical disks. The following volume managers are supported:
lvm (LVM volume group)
vxvm (VxVM daemon)
zfspool (ZFS storage pool)
Target Name(within 1023 bytes)
Specify the name of the monitor target in the <VG name> format (only the target name is used).
When the volume manager is lvm, it's possible to control multiple volumes together.
More than one volume is delimited with an one-byte space.
When the volume manager is vxvm, this setting need not be entered.
4.18. Understanding message receive monitor resources
4.18.1. Monitoring by message receive monitor resources
- When an error message is received from an outside source, the resource recovers the message receive monitor resource whose Category and Keyword have been reported. (The Keyword can be omitted.)If there are multiple message receive monitor resources whose monitor types and monitor targets have been reported, each monitor resource is recovered.
Message receive monitors can receive error messages issued by the clprexec command, local server BMC, and expanded device drivers within the server management infrastructure.
Error messages from local server BMC are available only in Express5800/A1080a or Express5800/A1040a series linkage. For details, see " Express5800/A1080a or Express5800/A1040a series linkage with message receive monitor resources" in "Express5800/A1080a or Express5800/A1040a series linkage" in "Linkage with specific hardware" in the "Hardware Feature Guide".
For details on the monitoring method that uses linkage with server management infrastructure, see "Linkage with Server Management Infrastructure" in the "Hardware Feature Guide".
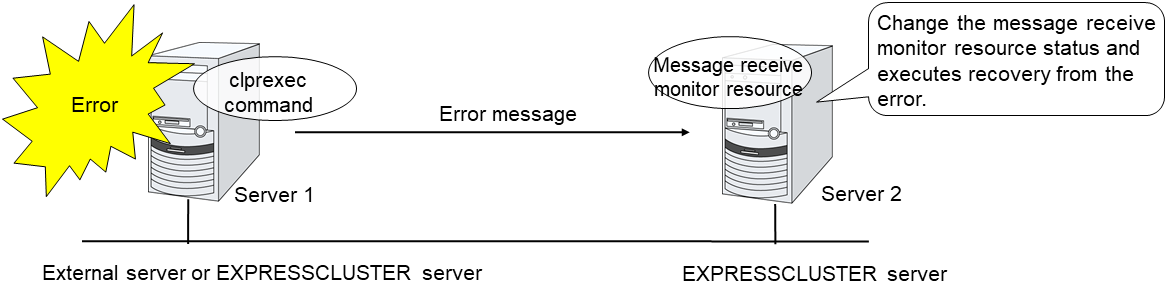
4.18.2. Failover to outside the server group
Upon the reception of notification of the occurrence of an error, failover from the active server group to another server group is allowed.
The following server group and other settings must be specified.
Group resource for recovery
[Use Server Group Settings] is selected
Message receive monitor
[Execute failover to the recovery target] is specified for the recovery target
[Execute Failover outside the Server Group] is selected
Upon the execution of server group failover to outside the server group, the dynamic failover settings and inter-server group failover settings are disabled. The server fails over to the server having the highest priority in a server group other than that to which it belongs.
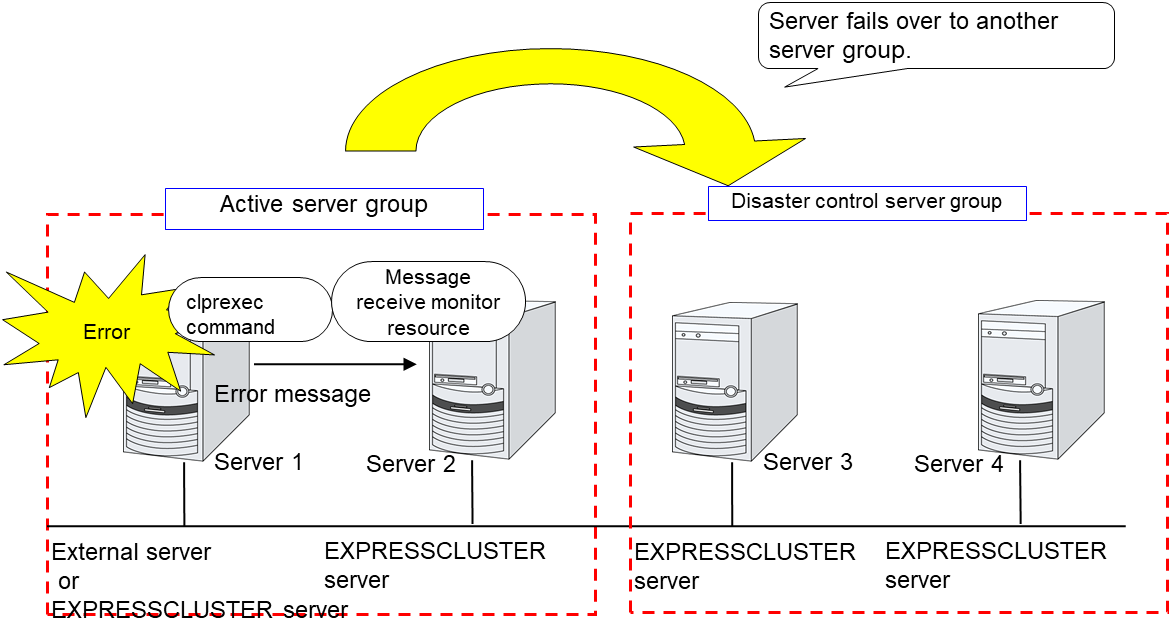
4.18.3. Notes on message receive monitor resources
Notes on message receive monitor resources
- If a message receive monitor resource is paused when an error message is received from outside, error correction is not performed.
- If an error message is received from outside, the status of the message receive monitor resource becomes "error". The error status of the message receive monitor resource is not automatically restored to "normal". To restore the status to normal, use the clprexec command. For details about this command, see "Requesting processing to cluster servers (clprexec command)" in "8. EXPRESSCLUSTER command reference" in this guide.
- If an error message is received when the message receive monitor resource is already in the error status due to a previous error message, recovery from the error is not performed.When the recovery action is Executing failover to outside the Server Group, and if Execute Failover to outside the Server Group is selected, the server always fails over to a server in a server group other than the active server group. If, however, the above-mentioned settings are configured but the server group is not configured, the failover destination is determined according to the ordinary failover policy.
- To receive an I/O Fencing completion notification from the BMC, the management LAN port of the BMC must be capable of communicating with the NIC of the OS. Specify a port number by connecting the SNMP Trap-receiving IP addresses of all servers with ; (semicolon). The port number can be omitted (defaults to 162). If it is necessary to set a port number, it must be entered at the end of the IP address, after : (colon).
Example: 192.168.0.1;192.168.0.2;192.168.0.3:162
Notes on using the Express5800/A1080a or Express5800/A1040a series linkage function
To enable the reception of error messages from BMC, the hardware and firmware on the server must be configured accordingly. The IPMI service must also be activated. For details on supported hardware, see "Servers supporting Express5800/A1080a or Express5800/A1040a series -related functions" in the "Getting Started Guide".
To enable the reception of error messages from BMC, communication from the BMC network interface to the OS network interface must be secured.
To enable the reception of error messages from BMC, specify the IP address for SNMP trap reception and the port number for the server by using server-specific settings. The port number can be omitted (defaults to 162). Configure the same port number for all message receive monitor resources on the server if explicitly specified.
Notes on using linkage with server management infrastructure
If the Enterprise Linux with Dependable Support server management infrastructure is linked, the settings for and operation of the message receive monitor resources will differ. If linking with the server management infrastructure, see "Linkage with Server Management Infrastructure" in the "Hardware Feature Guide".
4.18.4. Monitor (special) tab
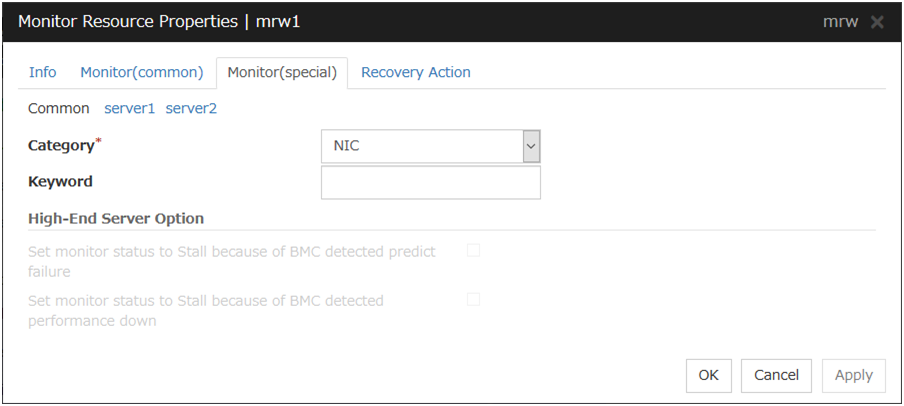
For Category and Keyword, specify a keyword passed using the -k parameter of the clprexec command. The keyword can be omitted.
Category (within 32 bytes)
Specify a monitor type. To monitor error messages from BMC (SNMP Trap), specify BMCNOTICE.You can select the default character string from the list box or specify any character string.
Keyword (within 1023 bytes)
Specify a keyword passed using the -k parameter of the clprexec command. When BMCNOTICE is specified for the category, specify the IP address for SNMP trap reception and the port number for each server by using server-specific settings. The port number can be omitted (defaults to 162). Configure the same port number for all the message receive monitor resources for each server if explicitly specified. The specification format is as described below:
<IP_address>[:<port_number>]
Set monitor status to Stall because of BMC detected predict failure
This cannot be used.
Set monitor status to Stall because of BMC detected performance down
This cannot be used.
4.18.5. Recovery Action tab
Specify the recovery target and the action upon detecting an error. For message receive monitor resources, select " Restart the recovery target ", " Executing failover to the recovery target ", or "Execute the final action" as the action to take when an error is detected. However, if the recovery target is inactive, the recovery action is not performed.
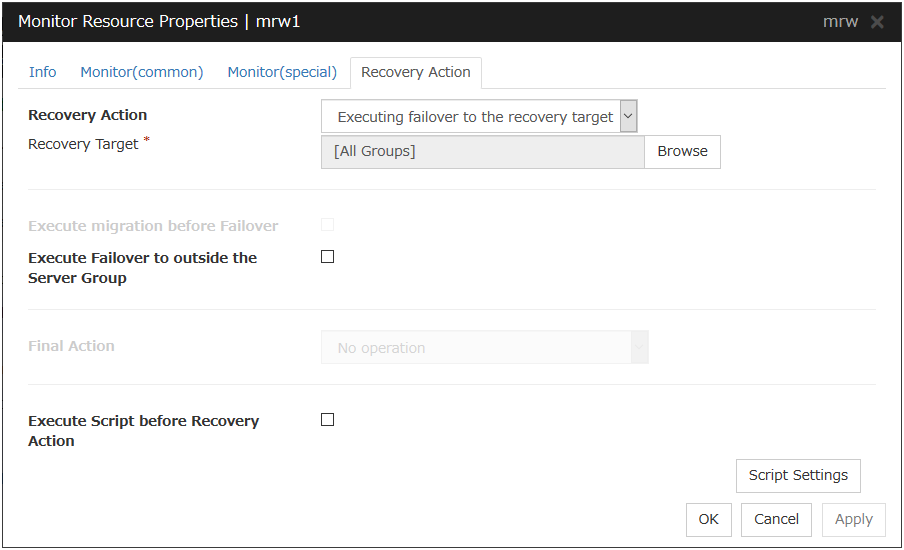
Recovery Action
Select the action to take when a monitor error is detected.
Execute Failover to outside the Server Group
Can be configured only for message receive monitor resources. Specify whether to fail over to a server group other than the active server group upon the reception of an error message.
Execute Script before Recovery Action
Executes the script before the operation performed upon error detection selected as the recovery action.
* For details on settings other than those above, see "Recovery Action tab".
4.19. Understanding VM monitor resources
VM monitor resources check whether the virtual machine is alive.
4.19.1. Notes on VM monitor resources
This resource is automatically registered when a virtual machine resource is added.
For the supported virtual infrastructure versions, see "Operation Environment of VM resources" in "Software" in "Installation requirements for EXPRESSCLUSTER" in the "Getting Started Guide".
The times counter of the recovery action kept by the monitor resource is not reset even though the virtual machine monitor resource recovery is detected while recovery action is in transit, or after all the recovery action have completed. Execute either one of the following procedures when you want to reset the times counter of the recovery action.
Reset the times counter of the recovery action by the clpmonctrl command.
Execute cluster stop/start with the clpcl command or Cluster WebUI.
4.19.2. Monitoring by VM monitor resources
VM monitor resources monitor the following:
If the virtual machine type is vSphere
VM monitor resources monitor the virtual machine by using the VMware vSphere API.
An error is detected if the monitoring result is one of the following:
The VM status is POWEROFF, SHUTDOWN, or SUSPENDED.
Acquiring the VM status failed.
If the virtual machine type is Xenserver
VM monitor resources monitor the virtual machine by using a general-purpose virtualization library.
An error is detected if the monitoring result is one of the following:
The VM status is HALTED, PAUSED, or SUSPENDED.
Acquiring the VM status failed.
If the virtual machine type is Kvm
VM monitor resources monitor the virtual machine by using a general-purpose virtualization library.
An error is detected if the monitoring result is one of the following:
The VM status is BLOCKED, SHUTDOWN, PAUSED, SHUTOFF, CRASHED, or NOSTATE.
Acquiring the VM status failed.
4.19.3. Monitor (special) tab
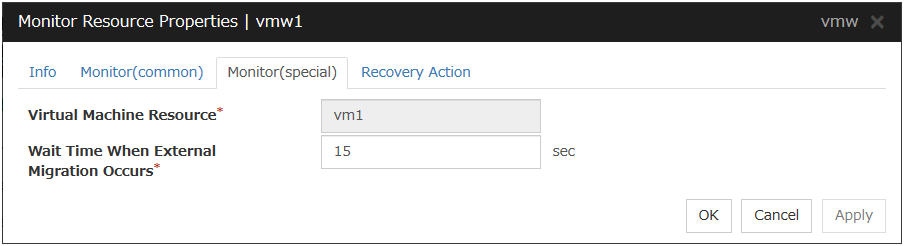
Wait Time When External Migration Occurs
Specify the time to wait for the completion of the migration.
4.20. Understanding Dynamic DNS monitor resources
4.20.1. Notes on Dynamic DNS monitor resources
There are no detailed settings for Dynamic DNS monitor resources. These monitor resources are used when using the Dynamic DNS resources in EXPRESSCLUSTER.
A Dynamic DNS monitor resource is automatically created when a Dynamic DNS resource is added. One Dynamic DNS monitor resource is automatically created for each Dynamic DNS resource.
Dynamic DNS monitor resources cannot be deleted. They are automatically deleted when the Dynamic DNS resource is deleted.
Do not change the recovery target.
Monitoring cannot be paused or resumed using the clpmonctrl command or from the Cluster WebUI.
Dynamic DNS monitor resources periodically register virtual host names with the DDNS server. If the target Dynamic DNS resource is active while the cluster is suspended, the Dynamic DNS monitor resource continues operating.
The setting of Monitor(common) tab-Retry Count is invalid. When you'd like to delay error detection, please change the setting of Monitor(common) tab-Timeout.
4.20.2. Settings for Dynamic DNS monitor resources
Dynamic DNS monitor resources periodically register virtual host names with the DDNS server.
There are no detailed settings for Dynamic DNS monitor resources.
4.21. Understanding process name monitor resources
Process name monitor resources monitor the process of specified processes. Process stalls cannot be detected.
4.21.1. Notes on process name monitor resources
If there are two or more processes having the name specified for the monitor target, only one process is selected according to the following conditions and is subject to monitoring.
If you set 1 for Minimum Process Count, and if there are two or more processes having the process name specified for the monitor target, only one process is selected under the following conditions and is subject to monitoring.
When the processes are in a parent-child relationship, the parent process is monitored.
When the processes are not in a parent-child relationship, the process having the earliest activation time is monitored.
When the processes are not in a parent-child relationship and their activation times are the same, the process having the lowest process ID is monitored.
If monitoring of the number of started processes is performed when there are multiple processes with the same name, specify the process count to be monitored for Minimum Process Count. If the number of processes with the same name falls short of the specified minimum count, an error is recognized. You can set 1 to 999 for Minimum Process Count. If you set 1, only one process is selected for monitoring.
Up to 1023 bytes can be specified for the monitor target process name. To specify a monitor target process with a name that exceeds 1023 bytes, use a wildcard (such as *).
If the name of the target process is 1024 bytes or longer, only the first 1023 bytes can be recognized as the process name. If you use a wild card (such as *) to specify a process name, specify a string containing the first 1024 or fewer bytes.
If the name of the target process is long, the latter part of the process name is omitted and output to the log.
If the name of the target process includes double quotations( "" ) or a comma ( , ), the process name might not be correctly output to an alert message.
Check the monitor target process name which is actually running by ps(1) command, etc, and specify the monitor target process name.
Execution result
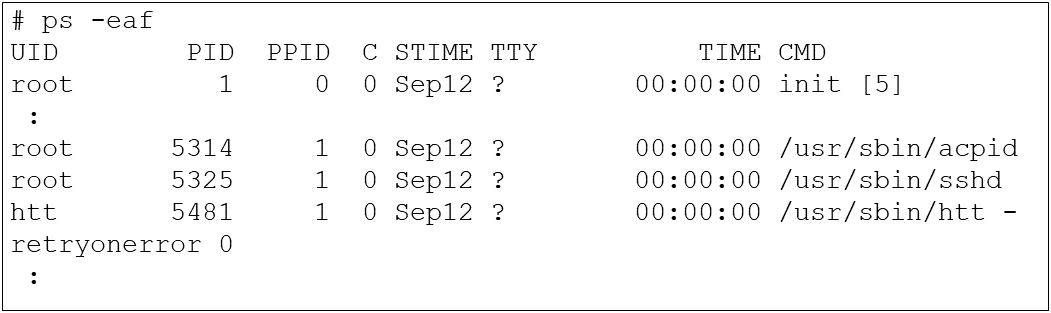
From the above command result, /usr/sbin/htt -retryonerror 0 is specified as monitor target process name in the case of monitoring /usr/sbin/htt.
The process name specified for the name of the target process specifies the target process, using the process arguments as part of the process name. To specify the name of the target process, specify the process name containing the arguments. To monitor only the process name with the arguments excluded, specify it with the wildcard (*) using right truncation or partial match excluding the arguments.
4.21.2. How process name monitor resources perform monitoring
The process name monitor resource monitors a process having the specified process name. If Minimum Process Count is set to 1, the process ID is identified from the process name and the deletion of the process ID is treated as an error. Process stalls cannot be detected.
If Minimum Process Count is set to a value greater than 1, the number of processes that have the specified process name are monitored. The number of processes to be monitored is calculated using the process name, and if the number falls below the minimum count, an error is recognized. Process stalls cannot be detected.
4.21.3. Monitor (special) tab
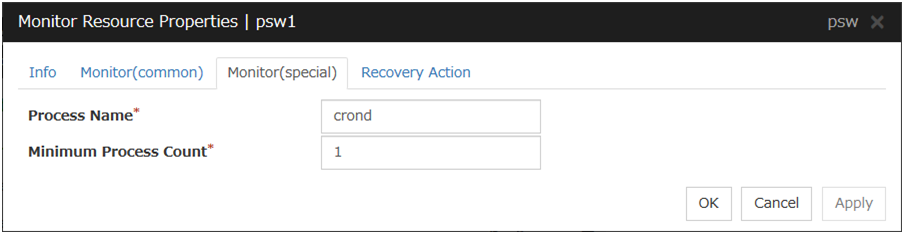
Process Name (within 1023 bytes)
Set the name of the target process. The process name can be obtained by using the ps(1) command
Wild cards can be used to specify a process name by using one of the following three patterns. No other wild card pattern is permitted.
[prefix search] <string included in the process name>*
[suffix search] *<string included in the process name>
[partial search] *<string included in the process name>*
Minimum Process Count (1 to 999)
Set the process count to be monitored for the monitor target process. If the number of processes having the specified monitor target process name falls short of the set value, an error is recognized.
4.22. Understanding BMC monitor resources
This cannot be used.
4.23. Understanding DB2 monitor resources
DB2 monitor resource monitors DB2 database that operates on servers.
4.23.1. Note on DB2 monitor resources
For the supported versions of DB2, see "Applications supported by monitoring options" of "Software" in "Installation requirements for EXPRESSCLUSTER" in the "Getting Started Guide".
This monitoring resource monitors DB2, using the CLI library of DB2. For this reason, it is required to execute "source instance user home/sqllib/db2profile" as root user. Write this in a start script.
To monitor a DB2 database that runs in the guest OS on a virtual machine controlled by a VM resource, specify the VM resource as the monitor target and specify enough wait time for the DB2 database to become accessible after the VM resource is activated for Wait Time to Start Monitoring. Also, set up the DB2 client on the host OS side, where monitor resources run, and register the database on the virtual machine to the database node directory.
If values of database name, instance name, user name and password specified by a parameter differ from the DB2 environment for monitoring, DB2 cannot be monitored. Error message is displayed. Check the environment.
Selectable monitor level |
Prior creation of a monitor table |
|---|---|
Level 1 (monitoring by select) |
Required |
Level 2 (monitoring by update/select) |
Optional |
Level 3 (create/drop table each time) |
Optional |
Create a monitor table using either of the following methods:
Alphanumeric characters and some symbols (such as underscores) can be used to specify a monitor table name.
4.23.2. How DB2 monitor resources perform monitoring
DB2 monitor resources perform monitoring according to the specified monitor level.
- Level 1 (monitoring by select)Monitoring with only reference to the monitor table. SQL statements executed for the monitor table are of (select) type.
An error is recognized if:
An error message is sent in response to a database connection or SQL statement message
- Level 2 (monitoring by update/select)Monitoring with reference to and update of the monitoring table. One SQL statement can read/write numerical data of up to 10 digits. SQL statements executed for the monitor table are of (update/select) type.If a monitor table is automatically created at the start of monitoring, the SQL statement (create/insert) is executed for the monitor table.
An error is recognized if:
An error message is sent in response to a database connection or SQL statement message
The written data is not the same as the read data
- Level 3 (create/drop table each time)Creation/deletion of the monitor table by statement as well as update. One SQL statement can read/write numerical data of up to 10 digits. SQL statements executed for the monitor table are of (create / insert / select / drop) type.
An error is recognized if:
An error message is sent in response to a database connection or SQL statement message
The written data is not the same as the read data
4.23.3. Monitor (special) tab
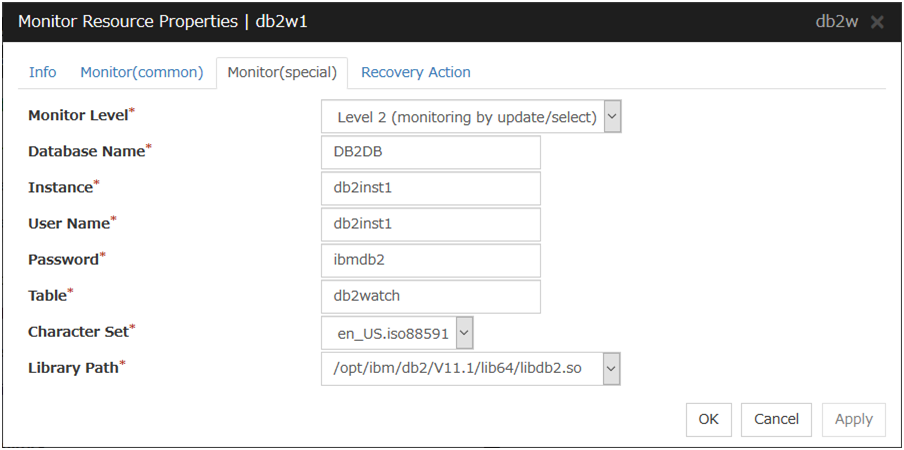
Monitor Level
Select one of the following levels. You cannot omit this level setting.
Default: Level 2 (monitoring by update/select)
Database Name (Within 255 bytes)
Specify the database to be monitored. You must specify the database.
Default value: None
Instance (Within 255 bytes)
Specify the instance name of the database to be monitored. You must specify the instance name.
Default value: db2inst1
User Name (Within 255 bytes)
Specify the user name to log on to the database. You must specify the user name.Specify the DB2 user who can access the specified database.Default value: db2inst1
Password (Within 255 bytes)
Specify the password to log on to the database. You must specify the password.
Default value: None
Table (Within 255 bytes)
Specify the name of a monitor table created on the database. You must specify the name.Make sure not to specify the same name as the table used for operation because a monitor table will be created and deleted. Be sure to set the name different from the reserved word in SQL statements. Some characters cannot be used to specify a monitor table name according to the database specifications. For details, refer to the database specifications.Default value: db2watch
Character Set
Specify the character set of DB2. You must specify the character code.
Default value: None
Library Path (Within 1023 bytes)
Specify the home path to DB2. You must specify the path.
Default value: /opt/ibm/db2/V11.1/lib64/libdb2.so
4.24. Understanding FTP monitor resources
FTP monitor resources monitor FTP services that run on the server. FTP monitor resources monitor FTP protocol and they are not intended for monitoring specific applications. FTP monitor resources monitor various applications that use FTP protocol.
4.24.1. FTP monitor resources
For monitoring target resources, specify EXEC resources etc. that start FTP. Monitoring starts after a target resource is activated. However, if FTP cannot be started immediately after target resource is activated, adjust the time using Wait Time to Start Monitoring.
To monitor an FTP server that runs in the guest OS on a virtual machine controlled by a VM resource, specify the VM resource as the monitor target and specify enough wait time for the FTP server to become accessible after the VM resource is activated for Wait Time to Start Monitoring.
FTP service may produce operation logs for each monitoring. Configure FTP settings if this needs to be adjusted.
If a change is made to a default FTP message (such as a banner or welcome message) on the FTP server, it may be handled as an error.
4.24.2. Monitoring by FTP monitor resources
FTP monitor resources connect to the FTP server and execute the command for acquiring the file list. As a result of monitoring, the following is considered as an error:
When connection to the FTP service fails.
When an error is notified as a response to the FTP command.
4.24.3. Monitor (special) tab
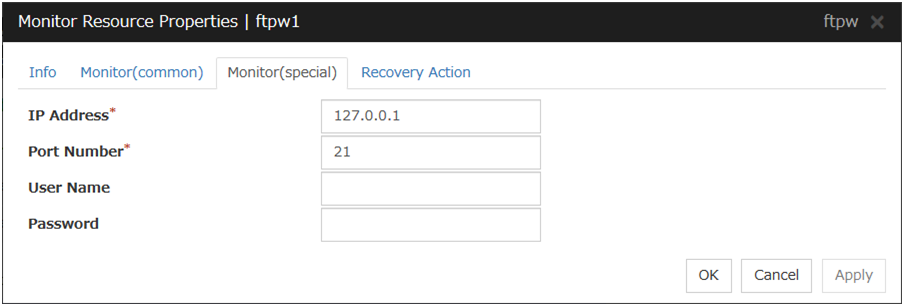
IP Address (Within 79 bytes )
Specify the IP address of the FTP server to be monitored. You must specify this IP address. If it is multi-directional standby server, specify FIP.
Usually, specify the loopback address (127.0.0.1) to connect to the FTP server that runs on the local server. If the addresses for which connection is possible are limited by FTP server settings, specify an address for which connection is possible (such as a floating IP address). To monitor an FTP server that runs in the guest OS on a virtual machine controlled by a VM resource, specify the IP address of the virtual machine.
Default value: 127.0.0.1
Port Number (1-65535)
Specify the FTP port number to be monitored. You must specify a port number.
Default value: 21
User Name (Within 255 bytes)
Specify the user name to log on to FTP.
Default value: None
Password (Within 255 bytes)
Specify the password to log on to FTP.
Default value: None
4.25. Understanding HTTP monitor resources
HTTP monitor resource monitors HTTP daemon that operates on servers.
4.25.1. Note on HTTP monitor resources
For the supported versions of HTTP, see the "Applications supported by monitoring options" in "Software" in "Installation requirements for EXPRESSCLUSTER" in the "Getting Started Guide".
To monitor an HTTP server that runs in the guest OS on a virtual machine controlled by a VM resource, specify the VM resource as the monitor target and specify enough wait time for the HTTP server to become accessible after the VM resource is activated for Wait Time to Start Monitoring.
HTTP monitor resource does not support the client authentication and DIGEST authentication..
4.25.2. How HTTP monitor resources perform monitoring
HTTP monitor resource monitors the following:
Monitors the HTTP daemon by connecting to the HTTP daemon on the server and issuing a HEAD request.
This monitor resource determines the following results as an error:
an error is notified during the connection to the HTTP daemon.
the response message to the HEAD request is not started with "/HTTP"
the status code for the response to the HEAD request is in 400s and 500s (when URI other than the default is specified to the request URI)
4.25.3. Monitor (special) tab
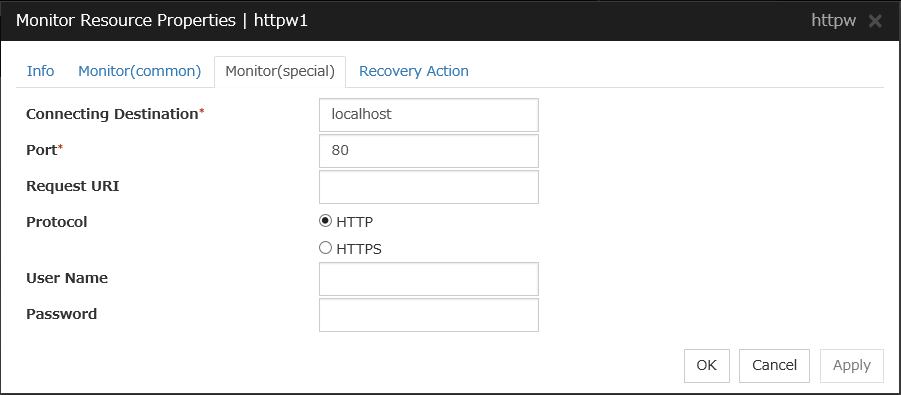
Connecting Destination (Within 255 bytes)
Specify the HTTP server name to be monitored. You must specify the name.
Usually, specify the loopback address (127.0.0.1) to connect to the HTTP server that runs on the local server. If the addresses for which connection is possible are limited by HTTP server settings, specify an address for which connection is possible (such as a floating IP address). To monitor an HTTP server that runs in the guest OS on a virtual machine controlled by a VM resource, specify the IP address of the virtual machine.
Default value: localhost
Port (1 to 65535)
Specify the port number used for connecting the HTTP server. You must specify the number.
Default value: 80 (HTTP)443 (HTTPS)
Request URI (Within 255 bytes)
Set the request URI (for example: "/index.html").
Default value: None
Protocol
Configure protocol used for communication with and HTTP server.. In general, HTTP is selected. If you need to connect with HTTP over SSL, select HTTPS.
Default value: HTTP
Note
OpenSSL is required to use HTTPS.
User Name (Within 255 bytes)
Set a user name to login to HTTPThis field is used only in case that you use BASIC authentication.Default value: None
Password (Within 255 bytes)
Set a password to login to HTTPThis field is used only in case that you use BASIC authentication.Default value: None
4.26. Understanding IMAP4 monitor resources
IMAP4 monitor resources monitor IMAP4 services that run on the server. IMAP4 monitor resources monitor IMAP4 protocol but they are not intended for monitoring specific applications. IMAP4 monitor resources monitor various applications that use IMAP4 protocol.
4.26.1. Note on IMAP4 monitor resources
For monitoring target resources, specify EXEC resources that start IMAP4 servers. Monitoring starts after a target resource is activated. However, if IMAP4 servers cannot be started immediately after a target resource is activated, adjust the time using Wait Time to Start Monitoring.
To monitor an IMAP4 server that runs in the guest OS on a virtual machine controlled by a VM resource, specify the VM resource as the monitor target and specify enough wait time for the IMAP4 server to become accessible after the VM resource is activated for Wait Time to Start Monitoring.
IMAP4 servers may produce operation logs for each monitoring. Configure IMAP4 server settings if this needs to be adjusted.
4.26.2. Monitoring by IMAP4 monitor resources
IMAP4 monitor resources connect to the IMAP4 server and execute the command to verify the operation. As a result of monitoring, the following is considered as an error:
When connection to the IMAP4 server fails.
When an error is notified as a response to the command.
4.26.3. Monitor (special) tab
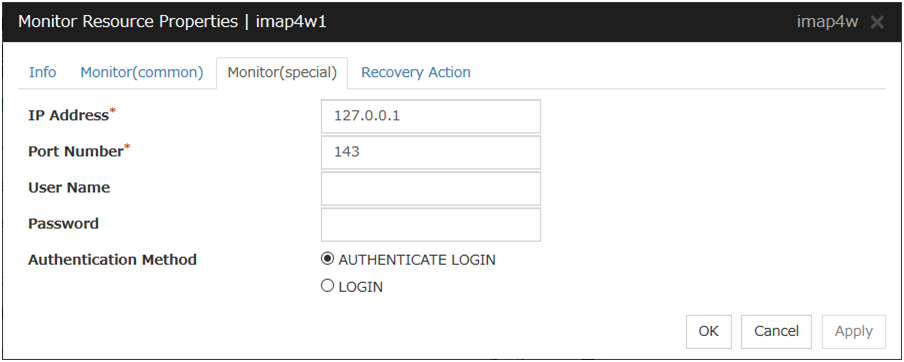
IP Address (Within 79 bytes )
Specify the IP address of the IMAP4 server to be monitored. You must specify this IP address. If it is multi-directional standby server, specify FIP.
Usually, specify the loopback address (127.0.0.1) to connect to the IMAP4 server that runs on the local server. If the addresses for which connection is possible are limited by IMAP4 server settings, specify an address for which connection is possible (such as a floating IP address). To monitor an IMAP4 server that runs in the guest OS on a virtual machine controlled by a VM resource, specify the IP address of the virtual machine.
Default value: 127.0.0.1
Port Number (1-65535)
Specify the port number of the IMAP4 to be monitored. You must specify this port number.
Default value: 143
User Name (Within 255 bytes)
Specify the user name to log on to IMAP4.
Default value: None
Password (Within 189 bytes)
Specify the password to log on to IMAP4. Default value: None
Authentication Method
Select the authentication method to log on to IMAP4. It must follow the settings of IMAP4 being used:
4.27. Understanding MySQL monitor resources
MySQL monitor resource monitors MySQL database that operates on servers.
4.27.1. Note on MySQL monitor resources
For the supported versions of MySQL, see the "Applications supported by monitoring options" in "Software" in "Installation requirements for EXPRESSCLUSTER" in the "Getting Started Guide".
To monitor a MySQL database that runs in the guest OS on a virtual machine controlled by a VM resource, specify the VM resource as the monitor target and specify enough wait time for the MySQL database to become accessible after the VM resource is activated for Wait Time to Start Monitoring.
If a value specified by a parameter differs from the MySQL environment for monitoring, an error message is displayed on the Cluster WebUI Alert logs. Check the environment.
Note that the following points about monitor levels described in the next section "How MySQL monitor resources perform monitoring".
Selectable monitor level |
Prior creation of a monitor table |
|---|---|
Level 1 (monitoring by select) |
Required |
Level 2 (monitoring by update/select) |
Optional |
Level 3 (create/drop table each time) |
Optional |
Create a monitor table using either of the following methods:
4.27.2. How MySQL monitor resources perform monitoring
MySQL monitor resources perform monitoring according to the specified monitor level.
- Level 1 (monitoring by select)Monitoring with only reference to the monitor table. SQL statements executed for the monitor table are of (select) type.An error is recognized if:
An error message is sent in response to a database connection or SQL statement message
- Level 2 (monitoring by update/select)Monitoring with reference to and update of the monitoring table. One SQL statement can read/write numerical data of up to 10 digits. SQL statements executed for the monitor table are of (update/select) type.If a monitor table is automatically created at the start of monitoring, the SQL statement (create/insert) is executed for the monitor table.
An error is recognized if:
An error message is sent in response to a database connection or SQL statement message
The written data is not the same as the read data
- Level 3 (create/drop table each time)Creation/deletion of the monitor table by statement as well as update. One SQL statement can read/write numerical data of up to 10 digits. SQL statements executed for the monitor table are of (create / insert / select / drop) type.
An error is recognized if:
An error message is sent in response to a database connection or SQL statement message
The written data is not the same as the read data
4.27.3. Monitor (special) tab
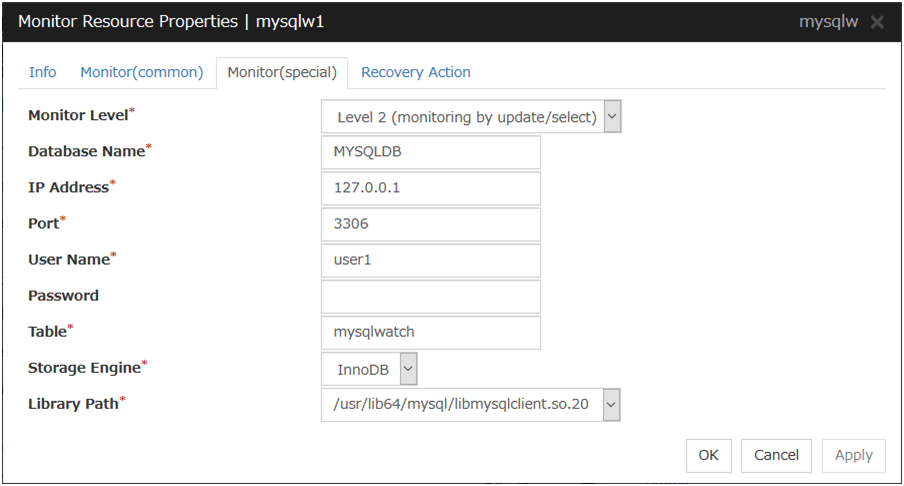
Monitor Level
Select one of the following levels. You cannot omit this level setting.
Default: Level 2 (monitoring by update/select)
Database Name (Within 255 bytes)
Specify the database name to be monitored. You must specify the name.
Default value: None
IP Address (Within 79 bytes)
Specify the IP address of the server to connect. You must specify the IP address.
Usually, specify the loopback address (127.0.0.1) to connect to the MySQL server that runs on the local server. To monitor a MySQL database that runs in the guest OS on a virtual machine controlled by a VM resource, specify the IP address of the virtual machine.
Default value: 127.0.0.1
Port 1 to 65535
Specify the port number used for connection. You must specify the port number.
Default value: 3306
User Name (Within 255 bytes)
Specify the user name to log on to the database. You must specify the name.
Specify the MySQL user who can access the specified database.
Default value: None
Password (Within 255 bytes)
Specify the password to log on to the database.
Default value: None
Table (Within 255 bytes)
Specify the name of a monitor table created in the database. You must specify the name.
Make sure not to specify the same name as the table used for operation because a monitor table will be created and deleted. Make sure to set the name different from the reserved word in SQL statements.Some characters cannot be used to specify a monitor table name according to the database specifications. For details, refer to the database.Default value: mysqlwatch
Storage Engine
Specify the storage engine of MySQL. You must specify the storage engine.
Default value: InnoDB
Library Path (Within 1023 bytes)
Specify the home path to MySQL. You must specify the path.
Default value: /usr/lib64/mysql/libmysqlclient.so.20
4.28. Understanding NFS monitor resources
NFS monitor resource monitors NFS file server that operates on servers.
4.28.1. System requirements for NFS monitor resource
The use of NFS monitor resources requires that the following already be started:
< For Red Hat Enterprise Linux 6, 7 >
nfs
rpcbind
nfslock (unnecessary for NFS v4)
4.28.2. Note on NFS monitor resources
For the supported versions of NFS, see "Applications supported by monitoring options" in "Software" in "Installation requirements for EXPRESSCLUSTER" in the "Getting Started Guide".
Specify the exports file for the shared directory to be monitored to enable the connection from a local server.
To monitor an NFS file server that runs in the guest OS on a virtual machine controlled by a VM resource, specify the VM resource as the monitor target and specify enough wait time for the NFS file server to become accessible after the VM resource is activated for Wait Time to Start Monitoring.
It is handled as an error that the deletion of nfsd with the version specified for NFS version of the Monitor(special) tab and mountd corresponding the nfsd is detected. The correspondence between nfsd versions and mountd versions is as follows.
nfsd version |
mountd version |
|---|---|
v2 (udp) |
v1 (tcp) or v2 (tcp) |
v3 (udp) |
v3 (tcp) |
v4 (tcp) |
- |
4.28.3. How NFS monitor resources perform monitoring
NFS monitor resource monitors the following:
Connect to the NFS server and run NFS test command.
This monitor resource determines the following result as an error:
Response to the NFS service request is invalid
mountd is deleted (excluding NFS v4)
nfsd is deleted
The rpcbind service is stopped
The export area is deleted(unnecessary for NFS v4)
When an error is repeated the number of times set to retry count, it is considered as NFS error.
4.28.4. Monitor (special) tab
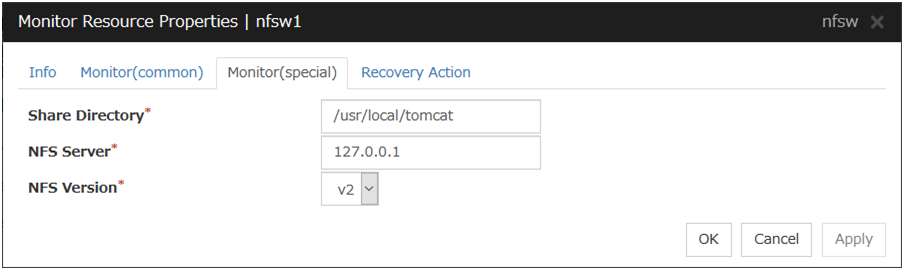
Share Directory (Within 1023 bytes)
Specify a directory for sharing files. You must specify the directory.
Default value: None
NFS Server (Within 255 bytes)
Specify an IP address of the server that monitors NFS. You must specify the IP address.
Usually, specify the loopback address (127.0.0.1) to connect to the NFS file server that runs on the local server. To monitor an NFS file server that runs in the guest OS on a virtual machine controlled by a VM resource, specify the IP address of the virtual machine.
Default value: 127.0.0.1
NFS Version
Select one NFS version for NFS monitoring, from the following choices. Be careful to set this NFS version.
For RHEL 7, the NFS version v2 is not supported.
Default value: v2
4.29. Understanding ODBC monitor resources
ODBC monitor resource monitors ODBC database that operates on servers.
4.29.1. Note on ODBC monitor resources
Since unixODBC Driver Manager is used for the monitoring process, installation of ODBC driver for the database to be monitored and settings for the data source on odbc.ini in advance.
To monitor a ODBC database that runs in the guest OS on a virtual machine controlled by a VM resource, specify the VM resource as the monitor target and specify enough wait time for the ODBC database to become accessible after the VM resource is activated for Wait Time to Start Monitoring.
If a value specified by a parameter differs from the ODBC environment for monitoring, an error message is displayed on the Cluster WebUI Alert logs. Check the environment.
Note that the following points about monitor levels described in the next section "How ODBC monitor resources perform monitoring". | A monitor error occurs if there is no monitor table at the start of monitoring in "Level 1". Note that monitor resource settings must be completed beforehand. | If there is no monitor table at the start of monitoring in "Level 2", EXPRESSCLUSTER automatically creates the monitor table. In this case, a message indicating that the Cluster WebUI Aalert logs does not have the monitor table is displayed. | The load on the monitor at "Level 3" is higher than that at "Level 1" and "Level 2" because the monitor in "Level 3" creates or deletes monitor tables for each monitoring.
Selectable monitor level |
Prior creation of a monitor table |
|---|---|
Level 1 (monitoring by select) |
Required |
Level 2 (monitoring by update/select) |
Optional |
Level 3 (create/drop table each time) |
Optional |
Create a monitor table using either of the following methods:
4.29.2. How ODBC monitor resources perform monitoring
ODBC monitor resources perform monitoring according to the specified monitor level.
- Level 1 (monitoring by select)Monitoring with only reference to the monitor table. SQL statements executed for the monitor table are of (select) type.
An error is recognized if:
An error message is sent in response to a database connection or SQL statement message
- Level 2 (monitoring by update/select)Monitoring with reference to and update of the monitoring table. One SQL statement can read/write numerical data of up to 10 digits. SQL statements executed for the monitor table are of (update/select) type.If a monitor table is automatically created at the start of monitoring, the SQL statement (create/insert) is executed for the monitor table.
An error is recognized if:
An error message is sent in response to a database connection or SQL statement message
The written data is not the same as the read data
- Level 3 (create/drop table each time)Creation/deletion of the monitor table by statement as well as update. One SQL statement can read/write numerical data of up to 10 digits. SQL statements executed for the monitor table are of (create / insert / select / drop) type.
An error is recognized if:
An error message is sent in response to a database connection or SQL statement message
The written data is not the same as the read data
4.29.3. Monitor (special) tab
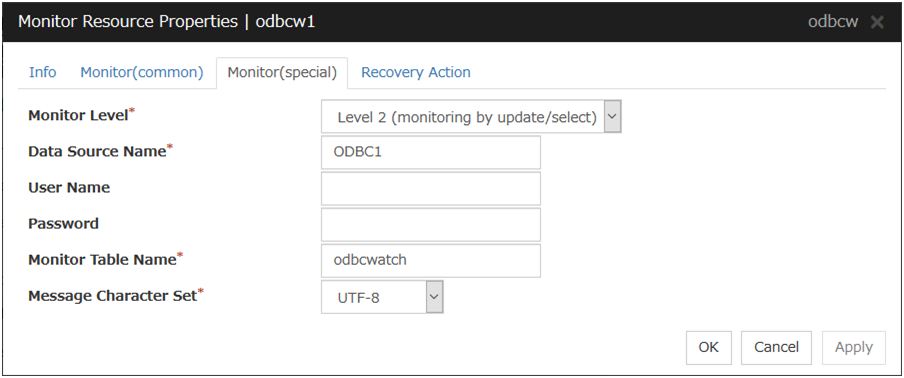
Monitor Level
Select one of the following levels. You cannot omit this level setting.
Default: Level 2 (monitoring by update/select)
Data Source Name (Within 255 bytes)
Specify the data source name to be monitored. You must specify the name.
Default value: None
User Name (Within 255 bytes)
Specify the user name to log on to the database.
If you have specified user name in odbc.ini, you do not need to specify it.
Default value: None
Password (Within 255 bytes)
Specify the password to log on to the database.
Default value: None
Monitor Table Name (Within 255 bytes)
Specify the name of a monitor table created in the database. You must specify the name.
Make sure not to specify the same name as the table used for operation because a monitor table will be created and deleted. Make sure to set the name different from the reserved word in SQL statements.
Some characters cannot be used to specify a monitor table name according to the database specifications. For details, refer to the database.
Default value: odbcwatch
Message Character Set
Specify the character code of database messages.
Default value: UTF-8
4.30. Understanding Oracle monitor resources
Oracle monitor resource monitors Oracle database that operates on servers.
4.30.1. Note on Oracle monitor resources
For the supported versions of Oracle, see " Applications supported by monitoring options" in "Software"in "Installation requirements for EXPRESSCLUSTER" in the "Getting Started Guide."
This monitor resource monitors Oracle with the Oracle interface (Oracle Call Interface). For this reason, the library for interface (libclntsh.so) needs to be installed on the server for monitoring.
To monitor an Oracle database that runs in the guest OS on a virtual machine controlled by a VM resource, specify the VM resource as the monitor target and specify enough wait time for the Oracle database to become accessible after the VM resource is activated for Wait Time to Start Monitoring. Also, set up the Oracle client on the host OS side, where monitor resources run, and specify the connection string for connecting to the Oracle database on the virtual machine.
If values of a connection string, user name and password specified by a parameter are different from the Oracle environment for monitoring, Oracle monitoring cannot be done. Error message is displayed. Check the environment.
For the user specified with the user name parameter, the default is sys, but when a monitoring-dedicated user has been configured, for each monitor level the following access permissions must be provided for that user (if the sysdba permission is not provided):
Monitor level |
Necessary permissions |
|---|---|
Level 0 (database status) |
SELECT permission for V$INSTANCE |
Level 1 (monitoring by select) |
SELECT permission for a monitor table |
Level 2 (monitoring by update/select) |
CREATE TABLE / DROP ANY TABLE / INSERT permission for a monitor table / UPDATE permission for a monitor table /SELECT permission for a monitor table |
Level 3 (create/drop table each time) |
CREATE TABLE / DROP ANY TABLE / INSERT permission for a monitor table / UPDATE permission for a monitor table /SELECT permission for a monitor table |
If sys is specified for the user name, an Oracle audit log may be output. If you do not want to output large audit logs, specify a user name other than sys.
Note that the following points about monitor levels described in the next section "How Oracle monitor resources perform monitoring".
Selectable monitor level |
Prior creation of a monitor table |
|---|---|
Level 0 (database status) |
Optional |
Level 1 (monitoring by select) |
Required |
Level 2 (monitoring by update/select) |
Optional |
Level 3 (create/drop table each time) |
Optional |
Create a monitor table using either of the following methods:
*Create this in a schema for the user specified with the user name parameter.
4.30.2. How Oracle monitor resources perform monitoring
Oracle monitor resources perform monitoring according to the specified monitor level.
- Level 0 (database status)The Oracle management table (V$INSTANCE table) is referenced to check the DB status (instance status). This level corresponds to simplified monitoring without SQL statements being executed for the monitor table.
An error is recognized if:
The Oracle management table (V$INSTANCE table) status is in the inactive state (MOUNTED,STARTED)
The Oracle management table (V$INSTANCE table) database_status is in the inactive state (SUSPENDED,INSTANCE RECOVERY)
- Level 1 (monitoring by select)Monitoring with only reference to the monitor table. SQL statements executed for the monitor table are of (select) type.
An error is recognized if:
An error message is sent in response to a database connection or SQL statement message
- Level 2 (monitoring by update/select)Monitoring with reference to and update of the monitoring table. One SQL statement can read/write numerical data of up to 11 digits. SQL statements executed for the monitor table are of (update/select) type.If a monitor table is automatically created at the start of monitoring, the SQL statement (create/insert) is executed for the monitor table.
An error is recognized if:
An error message is sent in response to a database connection or SQL statement message
The written data is not the same as the read data
- Level 3 (create/drop table each time)Creation/deletion of the monitor table by statement as well as update. One SQL statement can read/write numerical data of up to 11 digits. SQL statements executed for the monitor table are of (create / insert / select / drop) type.
An error is recognized if:
An error message is sent in response to a database connection or SQL statement message
The written data is not the same as the read data
4.30.3. Monitor (special) tab
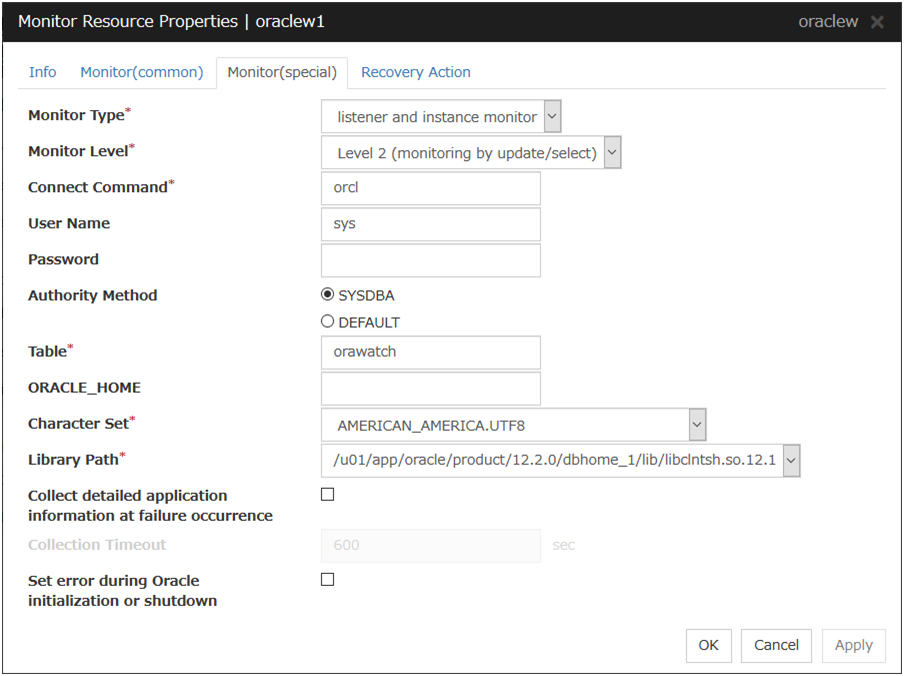
Monitor Type
Select the Oracle features to be monitored.
If ORACLE_HOME is not set, only connection operations for the items specified in the connect string are monitored. Use this to attempt recovery by restarting the Listener service upon a connection error.
Selecting this setting causes the monitor level setting to be ignored.
When the monitoring target is a database that has an Oracle12c multi-tenant configuration, monitoring using BEQ connection cannot be performed.
If ORACLE_HOME is not set, only the connection specified with the connect string is established, and any error in the connection operation is ignored. This is used to set the recovery action for a non-connection error together with an Oracle monitor resource for which Monitor Listener only is specified.
Monitor Level
Select one of the following levels. When the monitor type is set to Monitor Listener only, the monitor level setting is ignored.
If a monitor table is automatically created at the start of monitoring, the SQL statement (create/insert) is executed for the monitor table.
Default: Level 2 (monitoring by update/select)
Connect Command (Within 255 bytes)
Specify the connect string for the database to be monitored. You must specify the connect string.
When Monitor Type is set to Monitor Instance only, set ORACLE_SID.
Monitor Type
ORACLE_HOME
Connect Command
Monitor Level
Monitor Listener and Instance
Need not be specified
Specify the connect string
As specified
Monitor Listener only
Monitoring dependent on Oracle command if specified
Specify the connect string
Ignored
Check for connection to the instance through the listener if not specified
Specify the connect string
Ignored
Monitor Instance only
Check for the instance by BEQ connection if specified
Specify ORACLE_SID
As specified
Check for the instance through the listener if not specified
Specify the connect string
As specified
Default value: None for the connect string
User Name (Within 255 bytes)
Specify the user name to log on to the database. You must specify the name.
Specify the Oracle user who can access the specified database.
Default value: sys
Password (Within 255 bytes)
Specify the password to log on to the database.
Default value: None
Authority Method
Specify the database user authentication.
Default value: SYSDBA
Table (Within 255 bytes)
Specify the name of a monitor table created on the database. You must specify the name.
Make sure not to specify the same name as the table used for operation because a monitor table will be created and deleted. Be sure to set the name different from the reserved word in SQL statements.Some characters cannot be used to specify a monitor table name according to the database specifications. For details, refer to the database.Default value: orawatch
ORACLE_HOME (Within 255 bytes)
Specify the path name configured in ORACLE_HOME. Begin with [/]. This is used when Monitor Type is set to Monitor Listener only or Monitor Instance only.
Default: None
Character Set
Specify the character set of Oracle. You must specify the character code.
Default value: None
Library Path (Within 1023 bytes)
Specify the library path of Oracle Call Interface (OCI). You must specify the path.
Default value: /u01/app/oracle/product/12.2.0/dbhome_1/lib/libclntsh.so.12.1
Collect detailed application information at failure occurrence
In case that this function is enabled, when Oracle monitor resource detects errors, the detailed Oracle information is collected. The collected information is written to the /opt/nec/clusterpro/work/rm/ "monitor_resource_name"/errinfo.cur folder. When the information is obtained more than once, the existing folders are renamed errinfo.1, errinfo.2, and so on. The detailed Oracle information is collected up to 5 times.
Note
In case of stopping the Oracle service while collecting the information due to the cluster stop, correct information may not be collected.
Default value: disabled
Collection Timeout
Specify the timeout value for collecting detailed information.
Default value: 600
Set error during Oracle initialization or shutdown
If this function is enabled, a monitor error occurs immediately when Oracle initialization or shutdown in progress is detected.Disable this function when Oracle is automatically restarted during operation in cooperation with Oracle Clusterware or the like. Monitoring becomes normal even during Oracle initialization or shutdown.However, a monitor error occurs if Oracle initialization or shutdown continues for one hour or more.Default value: Disabled
4.31. Understanding Oracle Clusterware Synchronization Management monitor resources
It can't be used.
4.32. Understanding POP3 monitor resources
POP3 monitor resources monitor POP3 services that run on the server. POP3 monitor resources monitor POP3 protocol but they are not intended for monitoring specific applications. POP3 monitor resources monitor various applications that use POP3 protocol.
4.32.1. Note on POP3 monitor resources
For monitoring target resources, specify EXEC resources etc. that start POP3 services. Monitoring starts after target resource is activated. However, if POP3 services cannot be started immediately after target resource is activated, adjust the time using Wait Time to Start Monitoring.
To monitor a POP3 server that runs in the guest OS on a virtual machine controlled by a VM resource, specify the VM resource as the monitor target and specify enough wait time for the POP3 server to become accessible after the VM resource is activated for Wait Time to Start Monitoring.
POP3 services may produce operation logs for each monitoring. Configure the POP3 settings if this needs to be adjusted.
4.32.2. Monitoring by POP3 monitor resources
POP3 monitor resources connect to the POP3 server and execute the command to verify the operation. As a result of monitoring, the following is considered as an error:
When connection to the POP3 server fails.
When an error is notified as a response to the command.
4.32.3. Monitor (special) tab
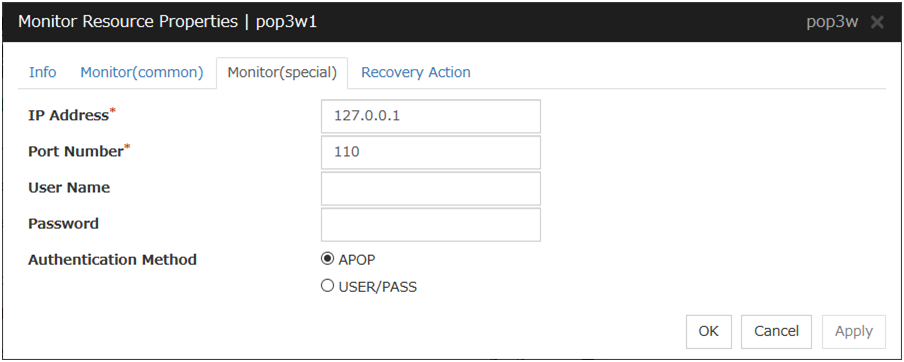
IP Address (Within 79 bytes )
Specify the IP address of the POP3 server to be monitored. You must specify this IP address. If it is multi-directional standby server, specify FIP.
Usually, specify the loopback address (127.0.0.1) to connect to the POP3 server that runs on the local server. If the addresses for which connection is possible are limited by POP3 server settings, specify an address for which connection is possible (such as a floating IP address). To monitor a POP3 server that runs in the guest OS on a virtual machine controlled by a VM resource, specify the IP address of the virtual machine.
Default value: 127.0.0.1
Port Number (1-65535)
Specify the POP3 port number to be monitored. You must specify this port number.
Default value: 110
User Name (Within 255 bytes)
Specify the user name to log on to POP3.
Default value: None
Password (Within 255 bytes)
Specify the password to log on to POP3. Click Change and enter the password in the dialog box.
Default value: None
Authentication Method
Select the authentication method to log on to POP3. It must follow the settings of POP3 being used:
4.33. Understanding PostgreSQL monitor resources
PostgreSQL monitor resource monitors PostgreSQL database that operates on servers.
4.33.1. Note on PostgreSQL monitor resources
For the supported versions of PostgreSQL, see "Applications supported by monitoring options" in "Software"in "Installation requirements for EXPRESSCLUSTER" in the "Getting Started Guide".
To monitor a PostgreSQL database that runs in the guest OS on a virtual machine controlled by a VM resource, specify the VM resource as the monitor target and specify enough wait time for the PostgreSQL database to become accessible after the VM resource is activated for Wait Time to Start Monitoring.
If a value specified by a parameter differs from the PostgreSQL environment for monitoring, a message indicating an error is displayed on the Alert logs of the Cluster WebUI. Check the environment.
YYYY-MM-DD hh:mm:ss JST moodle moodle LOG: statement: DROP TABLE psqlwatch
YYYY-MM-DD hh:mm:ss JST moodle moodle ERROR: table "psqlwatch" does not exist
YYYY-MM-DD hh:mm:ss JST moodle moodle STATEMENT: DROP TABLE psqlwatch
YYYY-MM-DD hh:mm:ss JST moodle moodle LOG: statement: CREATE TABLE psqlwatch (num INTEGER NOT NULL PRIMARY KEY)
YYYY-MM-DD hh:mm:ss JST moodle moodle NOTICE: CREATE TABLE / PRIMARY KEY will create implicit index "psqlwatch_pkey" for table "psql watch"
YYYY-MM-DD hh:mm:ss JST moodle moodle LOG: statement: DROP TABLE psqlwatch
Selectable monitor level |
Prior creation of a monitor table |
|---|---|
Level 1 (monitoring by select) |
Required |
Level 2 (monitoring by update/select) |
Optional |
Level 3 (create/drop table each time) |
Optional |
Create a monitor table using either of the following methods:
4.33.2. How PostgreSQL monitor resources perform monitoring
PostgreSQL monitor resources perform monitoring according to the specified monitor level.
- Level 1 (monitoring by select)Monitoring with only reference to the monitor table. SQL statements executed for the monitor table are of (select) type.
An error is recognized if:
An error message is sent in response to a database connection or SQL statement message
- Level 2 (monitoring by update/select)Monitoring with reference to and update of the monitoring table. One SQL statement can read/write numerical data of up to 10 digits. SQL statements executed for the monitor table are of (update/select/vacuum) type.
If a monitor table is automatically created at the start of monitoring, the SQL statement (create/insert) is executed for the monitor table.
An error is recognized if:
An error message is sent in response to a database connection or SQL statement message
The written data is not the same as the read data
- Level 3 (create/drop table each time)Creation/deletion of the monitor table by statement as well as update. One SQL statement can read/write numerical data of up to 10 digits. SQL statements executed for the monitor table are of (create / insert / select / drop / vacuum) type.
An error is recognized if:
An error message is sent in response to a database connection or SQL statement message
The written data is not the same as the read data
4.33.3. Monitor (special) tab
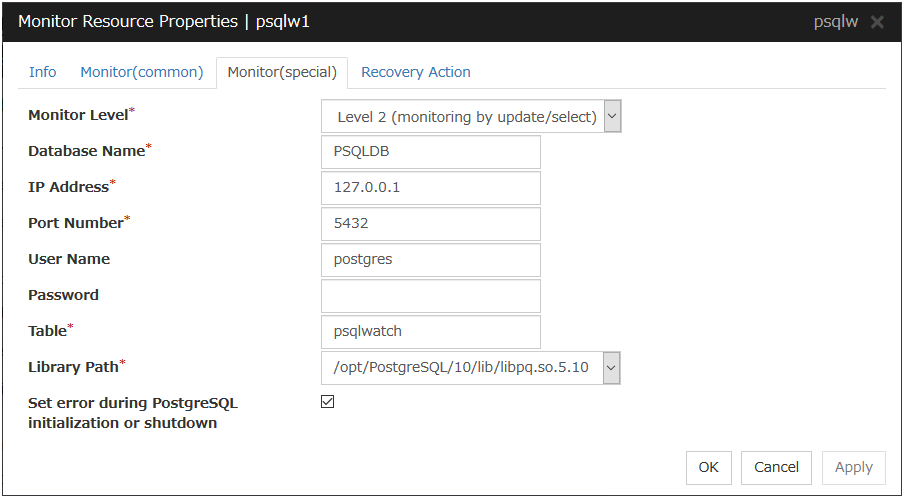
Monitor Level
Select one of the following levels. You cannot omit this level setting.
- Level 1 (monitoring by select)Monitoring with only reference to the monitor table. SQL statements executed for the monitor table are of (select) type.
- Level 2 (monitoring by update/select)Monitoring with reference to and update of the monitoring table. SQL statements executed for the monitor table are of (update/select/vacuum) type.If a monitor table is automatically created at the start of monitoring, the SQL statement (create/insert) is executed for the monitor table.
- Level 3 (create/drop table each time)Creation/deletion of the monitor table by statement as well as update. SQL statements executed for the monitor table are of (create / insert / select / drop / vacuum) type.
Default: Level 2 (monitoring by update/select)
Database Name (Within 255 bytes)
Specify the database name to be monitored. You must specify the name.
Default value: None
IP Address (Within 79 bytes)
Specify the IP address of the server to connect. You must specify the IP address.
Usually, specify the loopback address (127.0.0.1) to connect to the PostgreSQL server that runs on the local server. To monitor a PostgreSQL database that runs in the guest OS on a virtual machine controlled by a VM resource, specify the IP address of the virtual machine.
Default value: 127.0.0.1
Port (1 to 65535)
Specify the port number for connection. You must specify the number.
Default value: 5432
User Name (Within 255 bytes)
Specify the user name to log on to the database. You must specify the name.
Specify the PostgreSQL user who can access the specified database.
Default value: postgres
Password (Within 255 bytes)
Specify the password to log on to the database.
Default value: None
Table (Within 255 bytes)
Specify the name of a monitor table created in the database. You must specify the table name.
Make sure not to specify the same name as the table used for operation because a monitor table will be created and deleted. Be sure to set the name different from the reserved word in SQL statements.Some characters cannot be used to specify a monitor table name according to the database specifications. For details, refer to the database specifications.Default value: psqlwatch
Library Path (Within 1023 bytes)
Specify the home path to PostgreSQL. You must specify the path.
Default value: /opt/PostgreSQL/10/lib/libpq.so.5.10
Set error during PostgreSQL initialization or shutdown
When this function is enabled, a monitor error occurs immediately upon the detection of PostgreSQL initialization or shutdown in progress.
When this function is disabled, monitoring becomes normal even during PostgreSQL initialization or shutdown.
However, a monitor error occurs if PostgreSQL initialization or shutdown continues for one hour or more.
Default value: Enabled
4.34. Understanding Samba monitor resources
Samba monitor resource monitors samba file server that operates on servers.
4.34.1. Note on Samba monitor resources
For the supported versions of samba, seesee "Applications supported by monitoring options" in "Software" in "Installation requirements for EXPRESSCLUSTER" in the "Getting Started Guide".
If this monitor resource fails, the parameter value and samba environment may not match. Check the samba environment
Specify the smb.conf file for the shared name to be monitored to enable a connection from a local server. Allow guest connection when the security parameter of the smb.conf file is "share."
Samba functions except file sharing and print sharing
To monitor a samba file server that runs in the guest OS on a virtual machine controlled by a VM resource, specify the VM resource as the monitor target and specify enough wait time for the samba file server to become accessible after the VM resource is activated for Wait Time to Start Monitoring.
If the smbmount command is run on the monitoring server when the samba authentication mode is "Domain" or "Server," it may be mounted as a user name specified by the parameter of this monitor resource.
4.34.2. How Samba monitor resources perform monitoring
From internal version 4.1.0-1, Samba monitor resources use the shared library libsmbclient.so.0.
Samba monitor resource monitors the following:
By connecting to samba server and verify establishment of tree connection to resources of the samba server.
This monitor resource determines the following results as an error:
A response to samba service request is invalid.
4.34.3. Monitor (special) tab
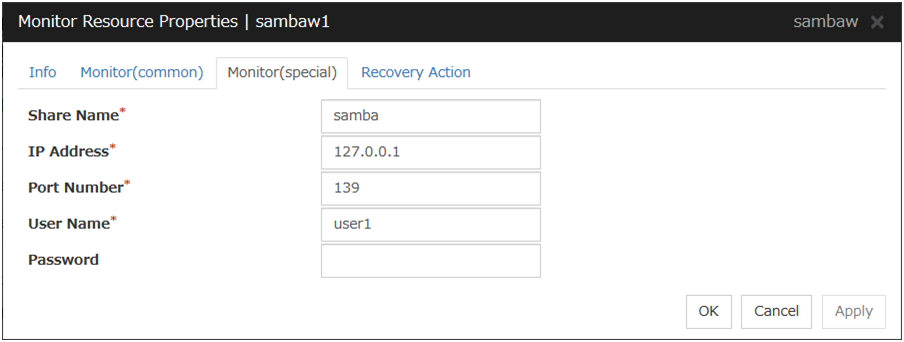
Share Name (Within 255 bytes)
Specify the shared name of samba server to be monitored. You must specify the name.
Default value: None
IP Address (Within 79 bytes)
Specify the IP address of samba server. You must specify the IP address.
Usually, specify the loopback address (127.0.0.1) to connect to the samba file server that runs on the local server. To monitor a samba file server that runs in the guest OS on a virtual machine controlled by a VM resource, specify the IP address of the virtual machine.
Default value: 127.0.0.1
Port (1 to 65535)
Specify the port number to be used by samba daemon. You must specify the port number. If the version of libsmbclient is 3 or earlier (e.g. libsmbclient.so provided with RHEL 6), the Port field can accept only 139 or 445. Specify the same value for smb ports of the smb.conf as well.
Default value: 139
User Name (Within 255 bytes)
Specify the user name to log on to the samba service. You must specify the user name.
Default value: None
Password (Within 255 bytes)
Specify the password to log on to the samba service.
Default value: None
4.35. Understanding SMTP monitor resources
SMTP monitor resource monitors SMTP daemon that operates on servers.
4.35.1. Note on SMTP monitor resources
For the supported versions of SMTP,see "Applications supported by monitoring options" in "Software" in "Installation requirements for EXPRESSCLUSTER" in the "Getting Started Guide".
If a state that the load average exceeds the RefuseLA value set in the sendmail.def file for a certain period of time, the monitoring commands may consider this as an error and perform failover.
To monitor an SMTP server that runs in the guest OS on a virtual machine controlled by a VM resource, specify the VM resource as the monitor target and specify enough wait time for the SMTP server to become accessible after the VM resource is activated for Wait Time to Start Monitoring.
4.35.2. How SMTP monitor resources perform monitoring
SMTP monitor resource monitors the following:
Monitors the SMTP daemon by connecting to the SMTP daemon on the server and issuing the NOOP command
This monitor resource determines the following result as an error:
An error reporting as the response to the SMTP daemon or issued NOOP command.
4.35.3. Monitor (special) tab
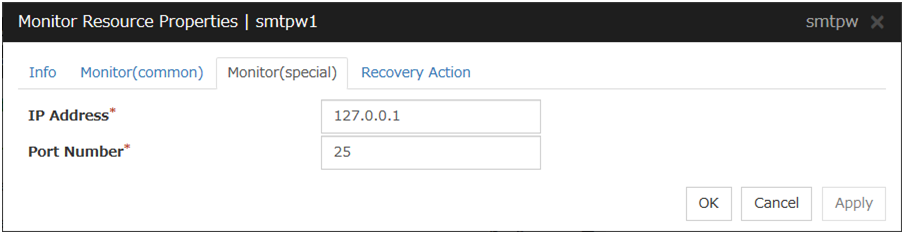
IP Address (Within 79 bytes)
Specify the IP address of the SMTP server to be monitored. You must specify the IP address.
Usually, specify the loopback address (127.0.0.1) to connect to the SMTP server that runs on the local server. To monitor an SMTP server that runs in the guest OS on a virtual machine controlled by a VM resource, specify the IP address of the virtual machine.
Default value: 127.0.0.1
Port (1 to 65535)
Specify the port number used to connect to the SMTP server. You must specify the port number.
Default value: 25
4.36. Understanding SQL Server monitor resources
SQL Server monitor resource monitors SQL Server database that operates on servers.
4.36.1. Note on SQL Server monitor resources
For the supported versions of SQL Server, see "Applications supported by monitoring options" in "Software" in "Installation requirements for EXPRESSCLUSTER" in the "Getting Started Guide".
This monitor resource monitors SQL Server using Microsoft ODBC Driver for SQL Server.
If a value specified by a parameter differs from the SQL Server environment for monitoring, an error message is displayed on the Cluster WebUI Alert logs. Check the environment.
Selectable monitor level |
Prior creation of a monitor table |
|---|---|
Level 0 (database status) |
Optional |
Level 1 (monitoring by select) |
Required |
Level 2 (monitoring by update/select) |
Optional |
Level 3 (create/drop table each time) |
Optional |
Use SQL statements (in the following example, the monitor table is named sqlwatch)
When SET IMPLICIT_TRANSACTIONS OFF
sql> CREATE TABLE sqlwatch (num INT NOT NULL PRIMARY KEY)sql> GOsql> INSERT INTO sqlwatch VALUES(0)sql> GOWhen SET IMPLICIT_TRANSACTIONS ON
sql> CREATE TABLE sqlwatch (num INT NOT NULL PRIMARY KEY)sql> GOsql> INSERT INTO sqlwatch VALUES(0)sql> GOsql> COMMITsql> GO
4.36.2. How SQL Server monitor resources perform monitoring
SQL Server monitor resources perform monitoring according to the specified monitor level.
- Level 0 (database status)The SQL Server management table is referenced to check the DB status.This level corresponds to simplified monitoring without SQL statements being issued for the monitor table.
An error is recognized if:
The database status is not online
- Level 1 (monitoring by select)Monitoring with only reference to the monitor table. SQL statements executed for the monitor table are of (select) type.
An error is recognized if:
An error message is sent in response to a database connection or SQL statement message
- Level 2 (monitoring by update/select)Monitoring with reference to and update of the monitoring table. One SQL statement can read/write numerical data of up to10 digits. SQL statements executed for the monitor table are of (update/select) type.
If a monitor table is automatically created at the start of monitoring, the SQL statement (create/insert) is executed for the monitor table.
An error is recognized if:
An error message is sent in response to a database connection or SQL statement message
The written data is not the same as the read data
- Level 3 (create/drop table each time)Creation/deletion of the monitor table by statement as well as update. One SQL statement can read/write numerical data of up to 10 digits. SQL statements executed for the monitor table are of (create / insert / select / drop) type.
An error is recognized if:
An error message is sent in response to a database connection or SQL statement message
The written data is not the same as the read data
4.36.3. Monitor (special) tab
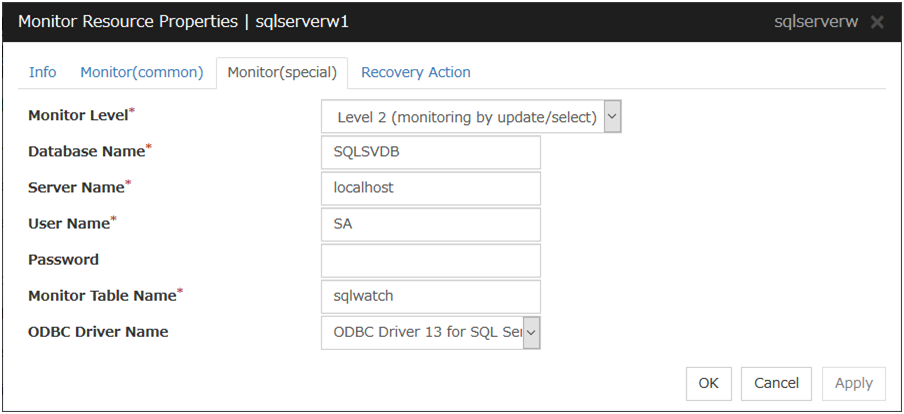
Monitor Level
Select one of the following levels. You cannot omit this level setting.
Default: Level 2 (monitoring by update/select)
Database Name (Within 255 bytes)
Specify the database name to be monitored. You must specify the name.
Default value: None
Server Name (Within 255 bytes)
Specify the database server name to be monitored. You must specify the name.
Default value: localhost
User Name (Within 255 bytes)
Specify the user name to log on to the database. You must specify the name.
Specify the SQL Server user who can access the specified database.
Default value: SA
Password (Within 255 bytes)
Specify the password to log on to the database. You must specify the password.
Default value: None
Monitor Table Name (Within 255 bytes)
Specify the name of a monitor table created in the database. You must specify the name.
Make sure not to specify the same name as the table used for operation because a monitor table will be created and deleted. Make sure to set the name different from the reserved word in SQL statements.Some characters cannot be used to specify a monitor table name according to the database specifications. For details, refer to the database.Default value: sqlwatch
ODBC Driver Name (Within 255 bytes)
Specify the ODBC driver name of SQL Server. You must specify the name.
Default value: ODBC Driver 13 for SQL Server
4.37. Understanding Sybase monitor resources
Sybase monitor resource monitors Sybase database that operates on servers.
4.37.1. Note on Sybase monitor resources
For the supported versions of Sybase, see "Applications supported by monitoring options" in "Software" in "Installation requirements for EXPRESSCLUSTER" in the "Getting Started Guide".
This monitor resource monitors ASE using Open Client DB-Library/C of ASE. If a value specified by a parameter differs from the ASE environment for monitoring, an error message is displayed on the Cluster WebUI Alert logs. Check the environment .
Note that the following points about monitor levels described in the next section "How Sybase monitor resources perform monitoring".
Selectable monitor level |
Prior creation of a monitor table |
|---|---|
Level 0 (database status) |
Optional |
Level 1 (monitoring by select) |
Required |
Level 2 (monitoring by update/select) |
Optional |
Level 3 (create/drop table each time) |
Optional |
Create a monitor table using either of the following methods:
Alphanumeric characters and some symbols (such as underscores) can be used to specify a monitor table name.
4.37.2. How Sybase monitor resources perform monitoring
Sybase monitor resources perform monitoring according to the specified monitor level.
- Level 0 (database status)The Sybase management table (sys.sysdatabases) is referenced to check the DB status. This level corresponds to simplified monitoring without SQL statements being issued for the monitor table.
An error is recognized if:
The database status is in an unusable state, e.g., offline.
- Level 1 (monitoring by select)Monitoring with only reference to the monitor table. SQL statements executed for the monitor table are of (select) type.
An error is recognized if:
An error message is sent in response to a database connection or SQL statement message
- Level 2 (monitoring by update/select)Monitoring with reference to and update of the monitoring table. One SQL statement can read/write numerical data of up to 10 digits. SQL statements executed for the monitor table are of (update/select) type.If a monitor table is automatically created at the start of monitoring, the SQL statement (create/insert) is executed for the monitor table.
An error is recognized if:
An error message is sent in response to a database connection or SQL statement message
The written data is not the same as the read data
- Level 3 (create/drop table each time)Creation/deletion of the monitor table by statement as well as update. One SQL statement can read/write numerical data of up to 10 digits. SQL statements executed for the monitor table are of (create / insert / select / drop) type.
An error is recognized if:
An error message is sent in response to a database connection or SQL statement message
The written data is not the same as the read data
4.37.3. Monitor (special) tab
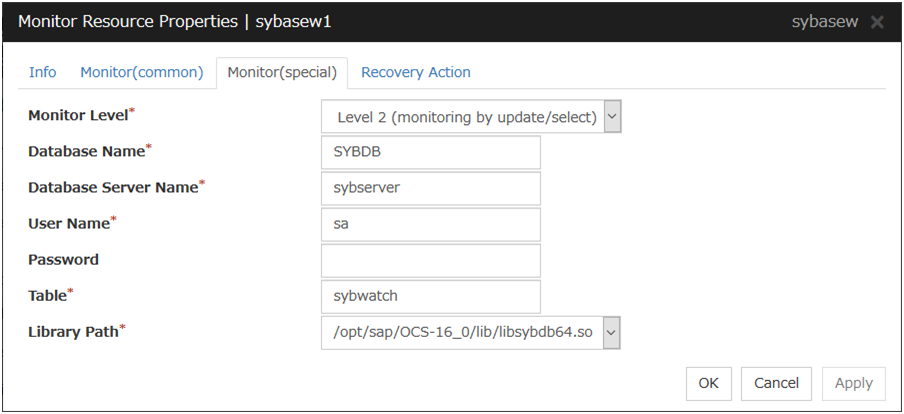
Monitor Level
Select one of the following levels. You cannot omit this level setting.
Default: Level 2 (monitoring by update/select)
Database Name (Within 255 bytes)
Specify the database to be monitored. You must specify the database.
Default value: None
Database Server Name (Within 255 bytes)
Specify the database server name to be monitored. You must specify the database server.
Default value: None
User Name (Within 255 bytes)
Specify the user name to log on to the database. You must specify the user name.
Specify the Sybase user who can access the specified database.
Default value: sa
Password (Within 255 bytes)
Specify the password to log on to the database.
Default value: None
Table (Within 255 bytes)
Specify the name of a monitor table created in the database. You must specify the name.
Make sure not to specify the same name as the table used for operation because a monitor table will be created and deleted. Make sure to set the name different from the reserved word in SQL statements.Some characters cannot be used to specify a monitor table name according to the database specifications. For details, refer to the database.Default value: sybwatch
Library Path (Within 1023 bytes)
Specify the home path to Sybase. You must specify the path.
Default value: /opt/sap/OCS-16_0/lib/libsybdb64.so
4.38. Understanding Tuxedo monitor resources
Tuxedo monitor resource monitors Tuxedo that operates on servers.
4.38.1. Note on Tuxedo monitor resources
For the supported versions of Tuxedo, see "Applications supported by monitoring options" in "Software" in "Installation requirements for EXPRESSCLUSTER" in the "Getting Started Guide".
If any library of the Tuxedo such as libtux.so does not exist, monitoring cannot be performed.
4.38.2. How Tuxedo monitor resources perform monitoring
Tuxedo monitor resource monitors the following:
This monitor resource executes the application server monitoring by using the API of the Tuxedo. The command determines the following results as an error:
An error is reported in response to ping.
4.38.3. Monitor (special) tab
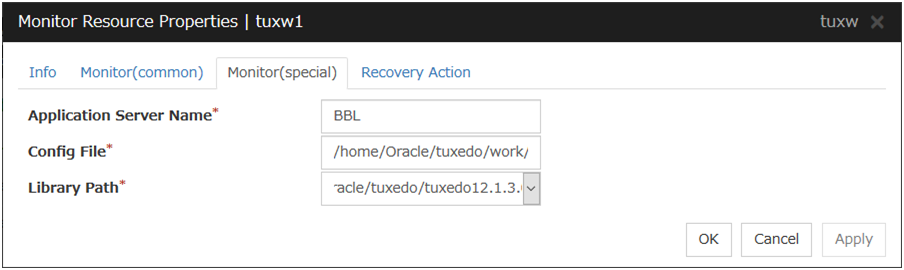
Application Server Name (Within 255 bytes)
Specify the IP address of the server to be monitored. You must specify the name.
Default value: BBL
Config File (Within 1023 bytes)
Specify the placement file name of Tuxedo. You must specify the name.
Default value: None
Library Path (Within 1023 bytes)
Specify the library path of Tuxedo. You must specify the path.
Default value: /home/Oracle/tuxedo/tuxedo12.1.3.0.0/lib/libtux.so
4.39. Understanding Weblogic monitor resources
Weblogic monitor resource monitors Weblogic that operates on servers.
4.39.1. Note on Weblogic monitor resources
For the supported versions of Weblogic, see "Applications supported by monitoring options" in "Software" in "Installation requirements for EXPRESSCLUSTER" in the "Getting Started Guide".
A Java environment is required to start monitoring with this monitor resource. The application server system uses Java functions. Therefore if Java stalls, it may be recognized as an error.
If Weblogic monitor resources are not available at the startup of WebLogic, they will be judged as being abnormal. Adjust [Wait Time to Start Monitoring], or start WebLogic before the startup of the Weblogic monitor resources (for example, specify the script resource for starting Weblogic as a monitor target resource)
4.39.2. How Weblogic monitor resources perform monitoring
Weblogic monitor resource monitors the following:
Monitors the application server by performing connect with the "webLogic.WLST" command.
This monitor resource determines the following results as an error:
An error reporting as the response to the connect.
The operations are as follows, based on Authentication Method.
DemoTrust: SSL authentication method using authentication files for demonstration of Weblogic
CustomTrust: SSL authentication method using user-created authentication files
Not Use SSL: SSL authentication method is not used.
4.39.3. Monitor (special) tab
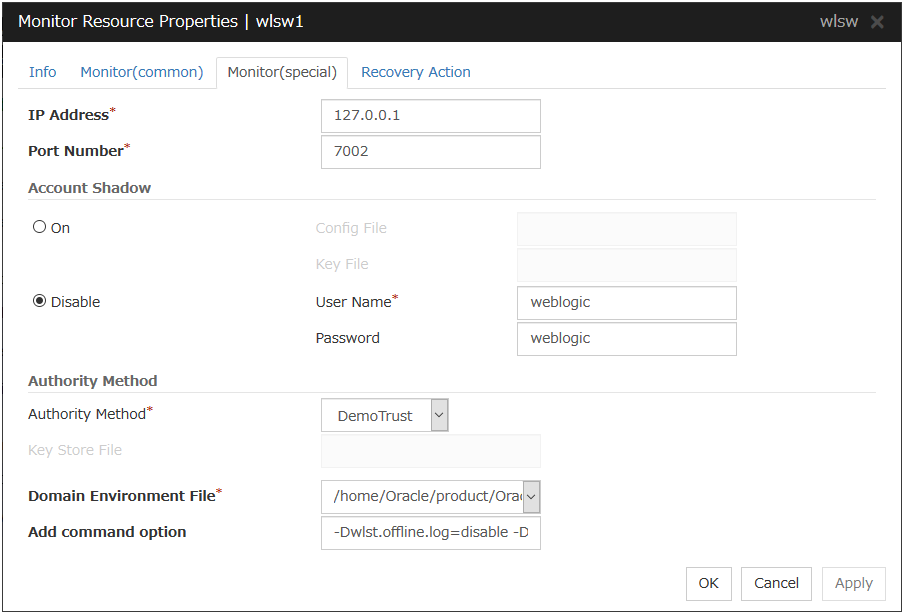
IP Address (Within 79 bytes)
Specify the IP address of the server to be monitored. You must specify the IP address.
Default value: 127.0.0.1
Port (1 to 65535)
Specify the port number used to connect to the server. You must specify the number.
Default value: 7002
Account Shadow
When you specify a user name and a password directly, select Off. If not, select On. You must specify the setting.
Default value: Off
Config File (Within 1023 bytes)
Specify the file in which the user information is saved. You must specify the file if Account Shadow is On.
Default value: None
Key File (Within 1023 bytes)
Specify the file in which the password required to access to a config file path is saved. Specify the full path of the file. You must specify the file if Account Shadow is On.
Default value: None
User Name (Within 255 bytes)
Specify the user name of Weblogic. You must specify the file if Account Shadow is Off.
Default value: weblogic
Password (Within 255 bytes)
Specify the password of Weblogic.
Default value: weblogic
Authority Method
Specify the authentication method when connecting to an application server. You must specify the method.
Specify DemoTrust or Custom Trust for Authority Method, in order to execute monitoring by using the SSL communication.
It is determined whether to use DemoTrust or CustomTrust, according to the setting of Weblogic Administration Console.
When Keystores of Weblogic Administration Console is set to Demo Identity and Demo Trust, specify Demo Trust. In this case, you do not need to make settings for Key Store File.
When Keystores of Weblogic Administration Console is set to Custom Identity and Custom Trust, specify Custom Trust. In this case, you need to make settings for Key Store File.
Default value: DemoTrust
Key Store File (Within 1023 bytes)
Specify the authentication file when authenticating SSL. You must specify this when the Authority Method is CustomTrust. Set the file specified in Custom Identity Key Store File on Weblogic Administration Console.
Default value: None
Domain Environment File (Within 1023 bytes)
Specify the domain environment file mane of Weblogic. You must specify the file name.
Default value:/home/Oracle/product/Oracle_Home/user_projects/domains/base_domain/bin/setDomainEnv.sh
Add Command Option (Within 1023 bytes)
Specify the additional command option when changing the option to be passed to the [webLogic.WLST] command.
Default value: -Dwlst.offline.log=disable -Duser.language=en_US
4.40. Understanding Websphere monitor resources
Websphere monitor resource monitors Websphere that operates on servers.
4.40.1. Note on Websphere monitor resources
For the supported versions of Websphere, see "Applications supported by monitoring options" in "Software" in "Installation requirements for EXPRESSCLUSTER" in the "Getting Started Guide".
A Java environment is required to start monitoring with this monitor resource. The application server system uses Java functions. If Java stalls, it may be recognized as an error.
4.40.2. How Websphere monitor resources perform monitoring
Websphere monitor resource monitors the following:
This monitor resource monitors the following:
Executes monitoring of the application server by using the serverStatus.sh command.
The monitor resource determines the following result as an error:
an error is reported with the state of the acquired application server.
4.40.3. Monitor (special) tab
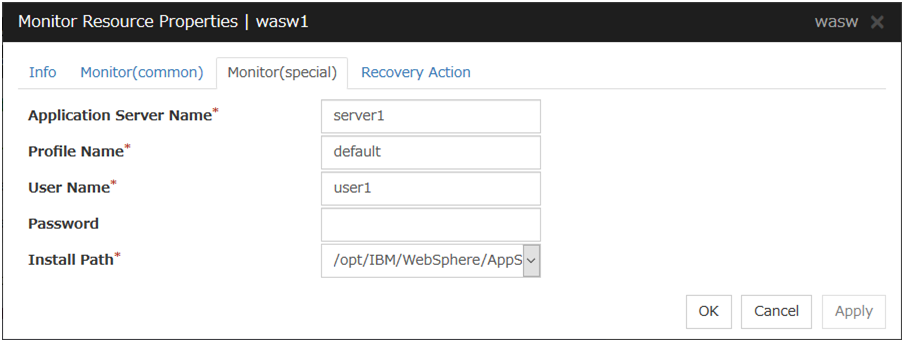
Application Server Name (Within 255 bytes)
Specify the application server name to be monitored. You must specify the name.
Default value: server1
Profile Name (Within 1023 bytes)
Specify the profile name of Websphere. You must specify the name.
Default value: default
User Name (Within 255 bytes)
Specify the user name of Websphere. You must specify the name.
Default value: None
Password (Within 255 bytes)
Specify the password of Websphere.
Default value: None
Install Path (Within 1023 bytes)
Specify the installation path of Websphere. You must specify the path.
Default value: /opt/IBM/WebSphere/AppServer
4.41. Understanding WebOTX monitor resources
WebOTX monitor resource monitors WebOTX that operates on servers.
4.41.1. Note on WebOTX monitor resources
For the supported versions of WebOTX, see "Applications supported by monitoring options" in "Software" in "Installation requirements for EXPRESSCLUSTER" in the "Getting Started Guide".
A Java environment is required to start monitoring with this monitor resource. The application server system uses Java functions. If Java stalls, it may be recognized as an error.
4.41.2. How WebOTX monitor resources perform monitoring
WebOTX monitor resource monitors the following:
This monitor resource monitors the following:
Executes monitoring of the application server by using the otxadmin.sh command.
The monitor resource determines the following result as an error:
an error is reported with the state of the acquired application server.
4.41.3. Monitor (special) tab
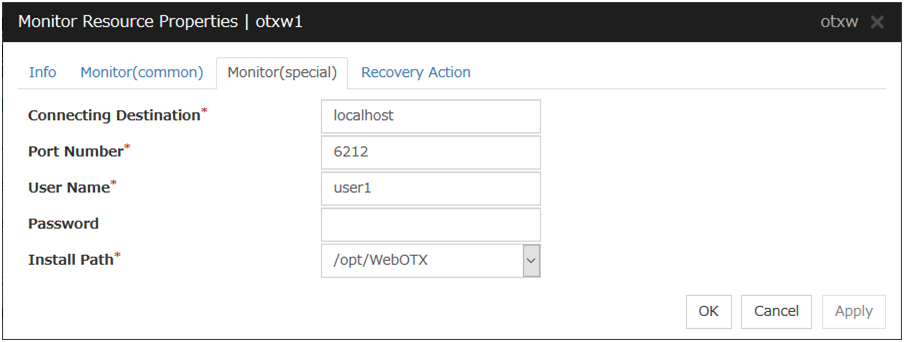
Connecting Destination (Within 255 bytes)
Specify the server name to be monitored. You must specify the name.
Default value: localhost
Port (1 to 65535)
Specify the port number used to connect to the server. You must specify the number.
When monitoring a WebOTX user domain, specify the management port number for the WebOTX domain. The management port number is the number which was set for "domain.admin.port" of <domain_name>.properties when the domain was created. Refer to the WebOTX documents for details of <domain_name>.properties.
Default value: 6212
User Name (Within 255 bytes)
Specify the user name of WebOTX. You must specify the name.
When monitoring a WebOTX user domain, specify the login user name for the WebOTX domain.
Default value: None
Password (Within 255 bytes)
Specify the password of WebOTX.
Default value: None
Install Path (Within 1023 bytes)
Specify the installation path of WebOTX. You must specify the path.
Default value: /opt/WebOTX
4.42. Understanding JVM monitor resources
JVM monitor resources monitor information about the utilization of resources that are used by Java VM or an application server running on a server.
4.42.1. Note on JVM monitor resources
The Java installation path on the JVM Monitor tab of Cluster Properties must be set before adding JVM monitor resource.
For a target resource, specify an application server running on Java VM such as WebLogic Server or WebOTX. As soon as the JVM monitor resource has been activated, the Java Resource Agent starts monitoring, but if the target (WebLogic Server or WebOTX) cannot start running immediately after the activation of the JVM monitor resource, use Wait Time to Start Monitoring to compensate.
The setting of Monitor(common) tab-Retry Count is invalid. When you'd like to delay error detection, please change the setting of Cluster Properties-JVM monitor Tab-Resource Measurement Settings [Common]-Retry Count.
4.42.2. How JVM monitor resources perform monitoring
JVM monitor resource monitors the following:
Monitors application server by using JMX (Java Management Extensions).
The monitor resource determines the following results as errors:
Target Java VM or application server cannot be connected
The value of the used amount of resources obtained for the Java VM or application server exceeds the user-specified threshold a specified number of times (error decision threshold) consecutively
As a result of monitoring, an error is regarded as having been solved if:
The value falls below the threshold when restarting the monitoring after the recovery action.
Note
Collect Cluster Logs in the Cluster WebUI does not handle the configuration file and log files of the target (WebLogic Server or WebOTX).
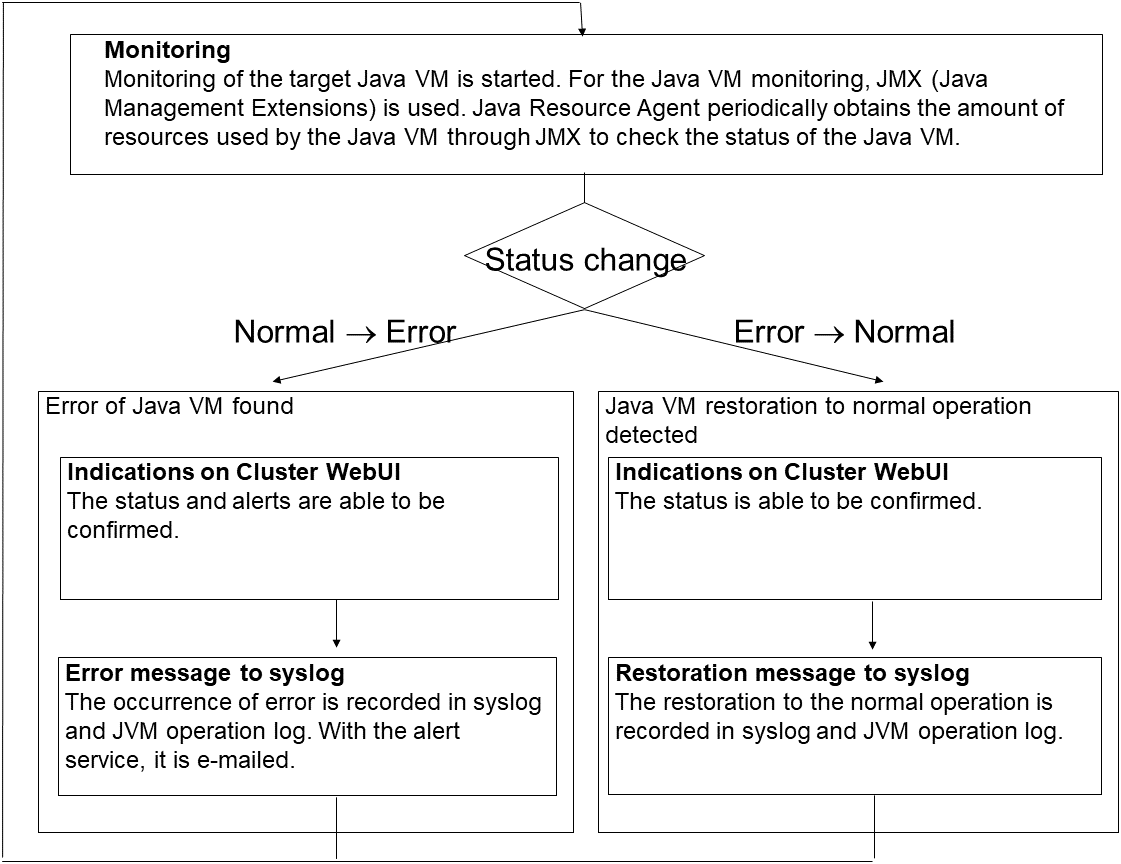
The standard operations when the threshold is exceeded are as described below.
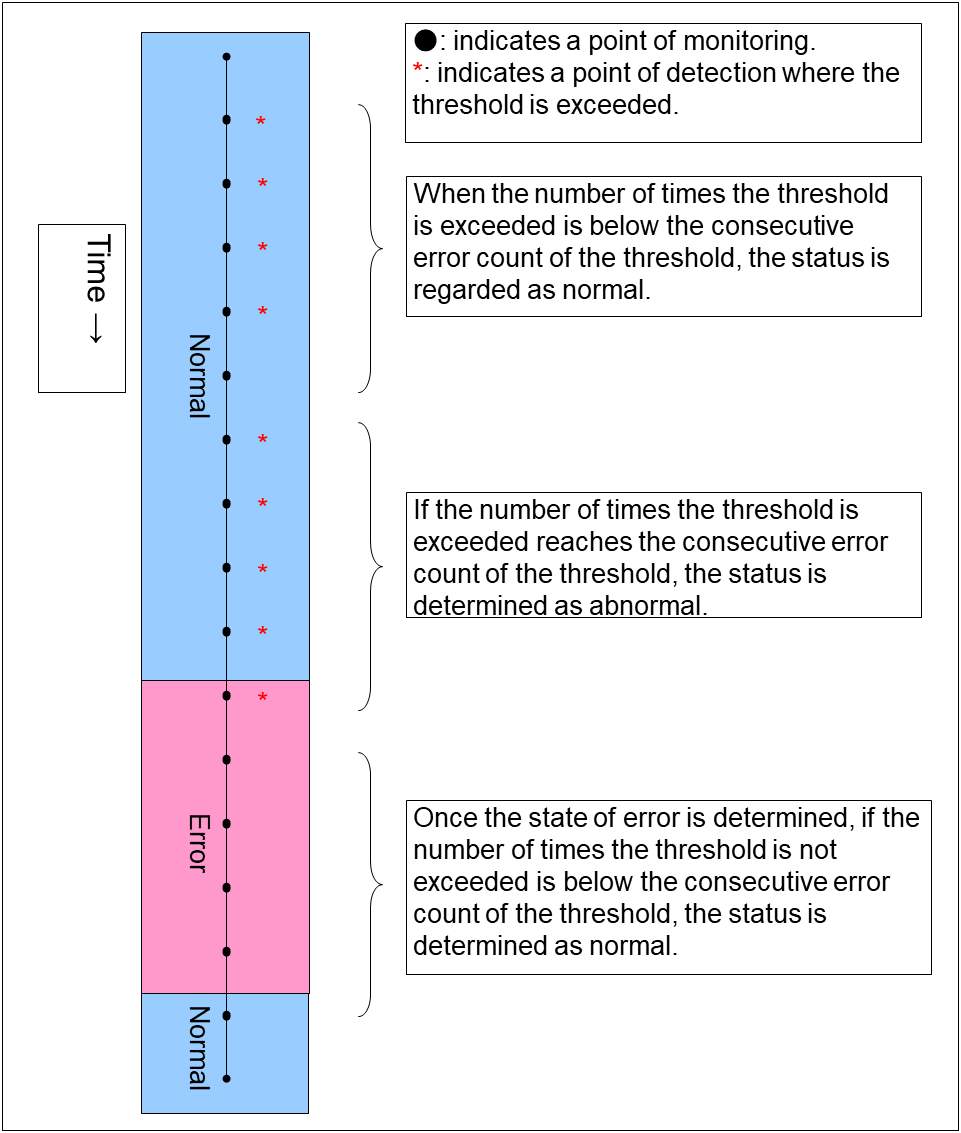
The operations performed if an error persists are as described below.
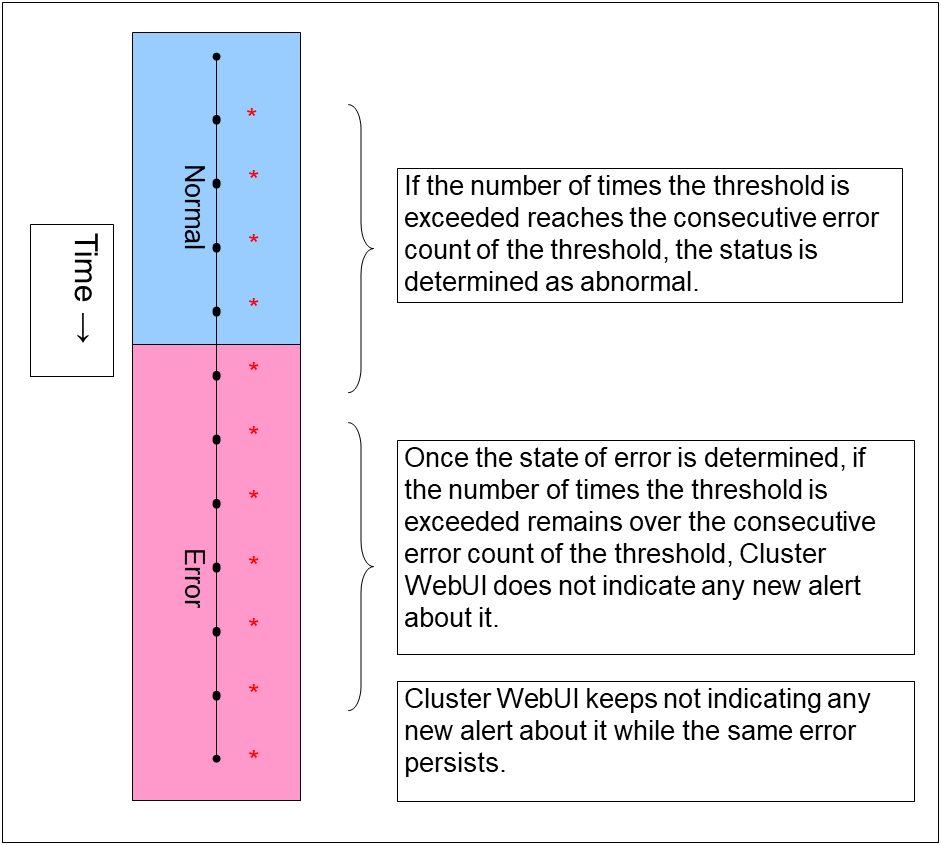
The following example describes the case of monitoring Full GC (Garbage Collection).
The JVM monitor resource recognizes a monitor error if Full GC is detected consecutively the number of times specified by the error threshold. In the following chart, * indicates that Full GC is detected by the JVM monitor resource when the error threshold is set to 5 (times).
Full GC has a significant influence on the system, thus the recommended error threshold is 1 time.
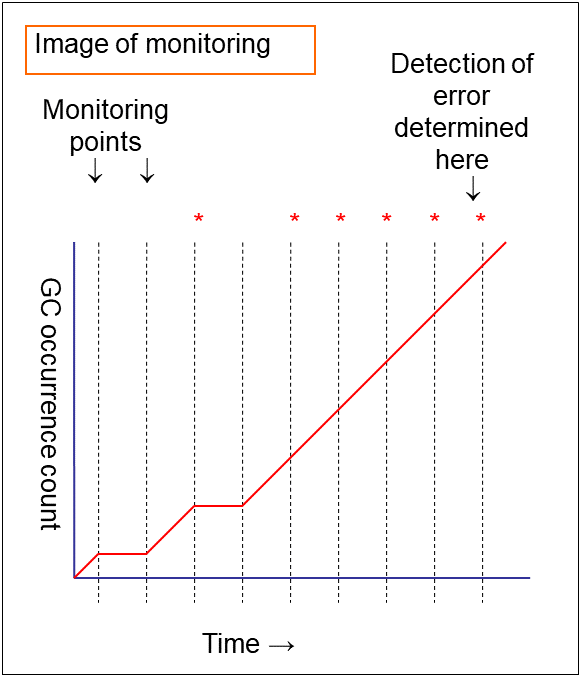
4.42.3. Linking with the load balancer (health check function)
Target load balancer: Load balancer with health check function for HTML files
JVM monitor resources can link with the load balancer. This section describes an example of linking when WebOTX is used as the application to be monitored. The load balancer linkage provides a health check function and target Java VM load calculation function. To link with the BIG-IP Local Traffic Manager, see "Linking with the BIG-IP Local Traffic Manager".
Distributed nodes are servers that are subject to load balancing, while the distributed node module is installed in the distributed nodes. The distributed node module is included in InterSec/LB400*.
To use the function, configure the settings through the Cluster WebUI Cluster Properties - JVM monitor tab - Load Balancer Linkage Settings dialog box; the health check function of the load balancer is linked.
When a load balancing system is configured with the load balancer on the server, the JVM monitor resource renames the HTML file specified by HTML File Name to the name specified by HTML Renamed File Name upon the detection of a WebOTX error (for example, exceeding the threshold for collected information).
The JVM monitor resource halts for the wait time, or 20 seconds, after renaming the HTML file. The wait time is intended to prevent WebOTX from being restarted before the load balancer finishes disconnecting the distributed node.
Once the JVM monitor resource detects the normality of WebOTX (e.g., the threshold specified for the collected information is not exceeded after reconnection) after WebOTX rebooting, the HTML file name set with HTML Renamed File Name is restored to that specified by HTML File Name.
The load balancer periodically health-checks the HTML file, and if a health check fails, the distributed node is determined to be not alive, so that the load balancer disconnects that distributed node. In the case of InterSec/LB400*, configure the health check interval, health check timeout, and retry count to determine the node down state by the health check with the health check (distributed node) interval parameter, HTTP health check timeout parameter, and health check (distributed node) count parameter, that are accessible from ManagementConsole for the load balancer->LoadBalancer->System Information.
Configure the parameters using the following as a reference.
20-second wait time >= (health check (distributed node) interval + HTTP health check timeout) x health check (distributed node) count
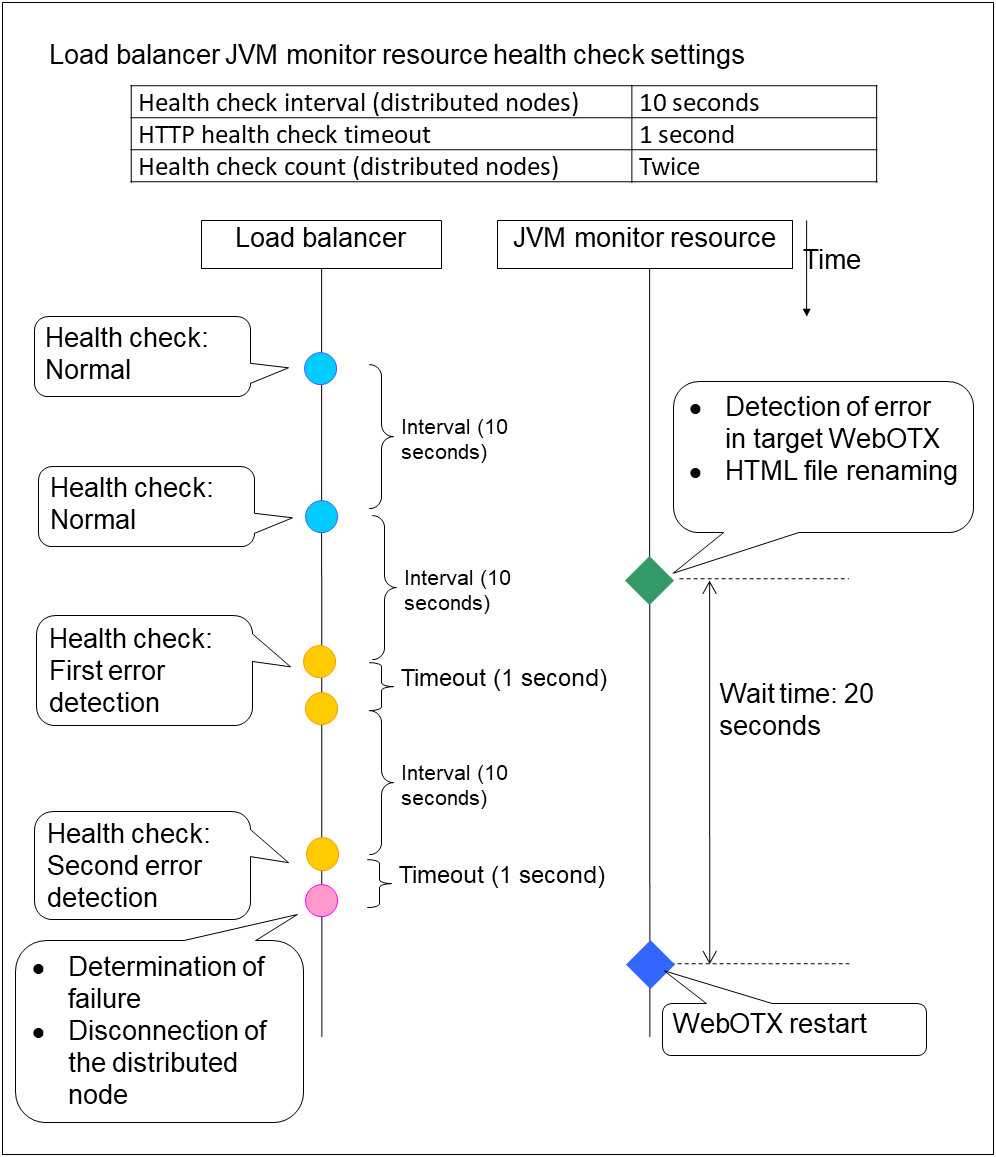
4.42.4. Linking with the load balancer (target Java VM load calculation function)
Target load balancer: InterSec/LB400*
JVM monitor resources can link with the load balancer. This section describes an example of linking when WebOTX is used as the application to be monitored. The load balancer linkage provides a health check function and target Java VM load calculation function. To link with the BIG-IP Local Traffic Manager, see "Linking with the BIG-IP Local Traffic Manager".
Distributed nodes are servers that are subject to load balancing, while the distributed node module is installed in the distributed node. The distributed node module is included in InterSec/LB400*.
To use this function, the following settings are required. This function works together with the CPU load-dependent weighting function of the load balancer.
Properties - Monitor(special) tab -> Tuning properties - Memory dialog box - Monitor Heap Memory Rate - Total Usage
Properties - Monitor(special) tab-> Tuning properties - Load Balancer Linkage dialog box - Memory Pool Monitor
According to the following steps, first install the distributed node module on each server, and then execute the load balancer linkage setup command clpjra_lbsetup.sh to configure the distributed node modules.
Note
Execute the command from an account having the root privilege.
Execute "<EXPRESSCLUSTER_installation_folder>/ha/jra/bin/clpjra_lbsetup.sh." The functions of the arguments are as described below.
(Example) clpjra_lbsetup.sh -e 1 -i 120 -t 180
Argument
Description
Value
-e
Enables or disables the function.
0 or 1
0: Disable 1: Enable
-i
Specify the execution interval for the target Java VM load calculation command, in seconds.
1 to 2147483646
-t
Specify the timeout for the target Java VM load calculation command, in seconds.
1 to 2147483646
The JVM monitor resource calculates the load on the target Java VM according to the information obtained about the Java memory. Obtain the Java VM load from the following expression. The threshold is the value obtained by multiplying the entire amount of the Java heap area by the use ratio set with the Monitor(special) tab - Tuning properties - Memory tab - Monitor Heap Memory Rate - Total Usage.
Java VM load (%) = current memory usage (MB) x 100/threshold (MB)
For the distributed node module installed on a server on which JVM monitor resource is running, commands are periodically executed to compare the obtained target Java VM load with the CPU load obtained separately, and to notify the load balancer of the higher load value as a CPU load. The load balancer distributes the traffic (requests) to the appropriate servers according to the CPU load of the distributed node.
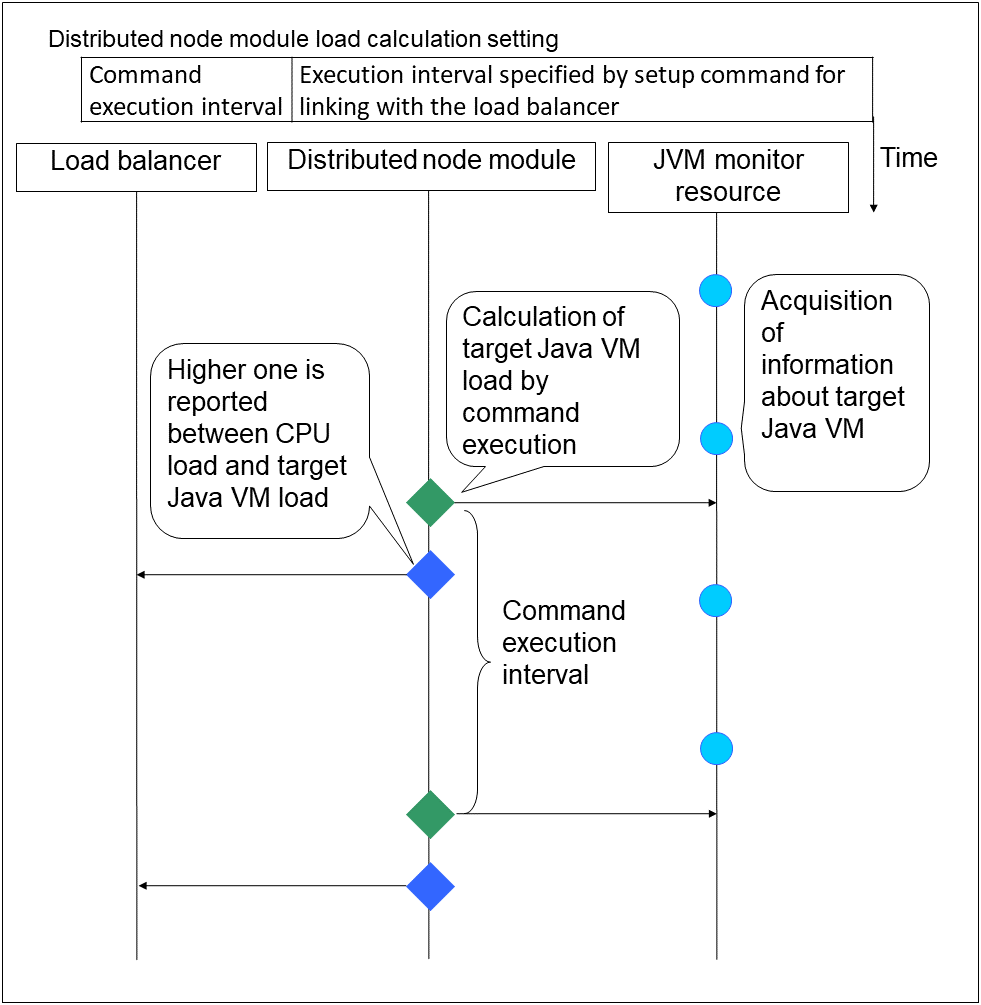
4.42.5. Linking with the BIG-IP Local Traffic Manager
Target load balancer: BIG-IP Local Traffic Manager
The JVM monitor resource can link with BIG-IP LTM. Hereafter, the explanation assumes the use of Tomcat as the application server to be monitored. Linkage with BIG-IP LTM offers the distributed node control function and the target Java VM load calculation function.
The linkage between BIG-IP LTM and the JVM monitor resource is realized with the BIG-IP series API (iControl).
The distributed node is the load distribution server, and the linkage module is that which is installed in each distributed node. The linkage module is contained in Java Resource Agent.
To use the distributed node control function, specify the setting with Cluster WebUI Cluster Properties -> JVM Monitor tab -> Load Balancer Linkage Settings dialog box, JVM monitor resource Properties - Monitor(special) tab - Tuning properties - Load Balancer Linkage tab.
To use the target Java VM load calculation function, specify the setting withCluster WebUI Cluster Properties -> JVM Monitor tab -> Load Balancer Linkage Settings dialog box.
The following BIG-IP LTM linkage error message is output to the JVM operation log. For details, see "JVM monitor resource log output messages" in "10. Error messages".
Error: Failed to operate clpjra_bigip.[error code]
If the relevant server configures the BIG-IP LTM load distribution system, when the JVM monitor detects a Tomcat failure (for example: the amount of collection information exceeds the specified threshold), iControl is used to update the BIG-IP LTM distributed node status from "enable" to "disable."
After updating the status of the distributed node of BIG-IP LTM, the JVM monitor waits until the number of connections of the distributed node falls to 0. After waiting, it executes Restart Command specified on the JVM monitor resource Properties - Monitor(special) tab -> Tuning properties - Load Balancer Linkage tab. It does not execute the action specified by Restart Command if the number of connections of the distributed node does not fall to 0, even if Timeout elapses, as specified on the JVM monitor resource Properties - Monitor(special) tab -> Tuning properties - Load Balancer Linkage tab.
When the JVM monitor detects a Tomcat failure recovery, it uses iControl to update the status of the BIG-IP LTM distributed node from "disable" to "enable." In this case, it does not execute the action specified by Restart Command specified on the JVM monitor resource Properties - Monitor(special) tab -> Tuning properties - Load Balancer Linkage tab.
If the distributed node status is "disable", BIG-IP LTM determines the distributed node to be down and therefore disconnects it. Use of the distributed node control function requires no related setting for BIG-IP LTM.
The distributed node status is updated by BIG-IP LTM when the JVM monitor detects a failure or failure recovery. Therefore, after the failover generated by an operation other than JVM monitoring, the distributed node status of BIG-IP LTM may be "enable".
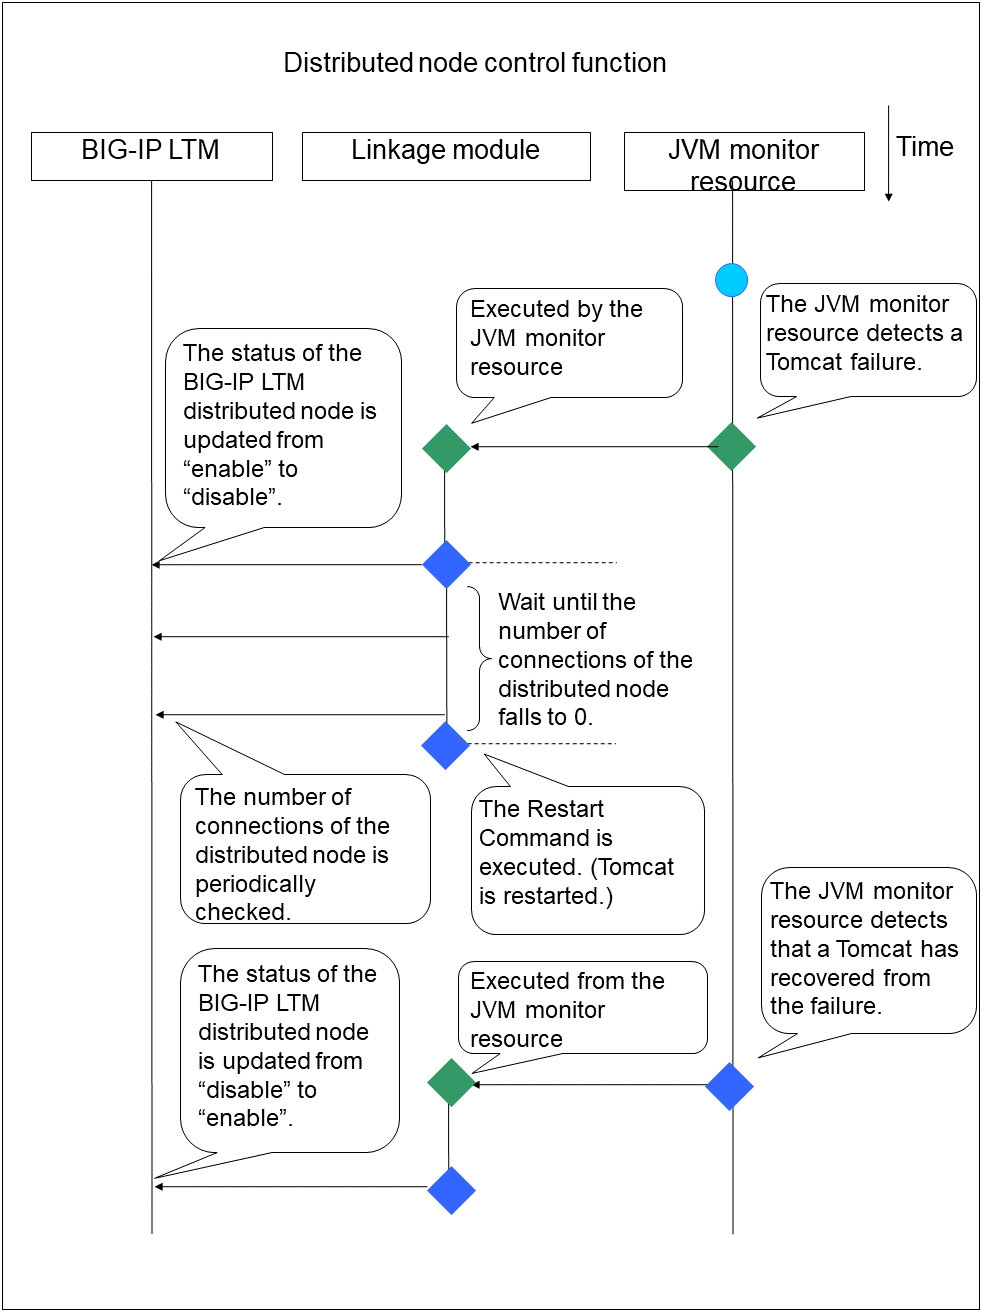
The JVM monitoring calculates the load on the target Java VM according to the information obtained about the Java memory.
Obtain the Java VM load from the following expression. Java VM load (%) is the value obtained by multiplying the entire amount of the Java heap area by the use ratio set with Monitor(special) tab - Tuning properties - Memory tab - Monitor Heap Memory Rate - Total Usage.
Java VM load (%) = current memory usage (MB) x 100/threshold (MB)
The linkage module installed on the server on which the JVM monitor runs executes a command at regular intervals, and reports the load collected on the target Java VM to BIG-IP LTM. BIG-IP LTM distributes the traffic (request) to the optimal server according to the load status of Java VM of the distributed node.
Set the following EXPRESSCLUSTER settings with the Cluster WebUI.
- JVM monitor resource
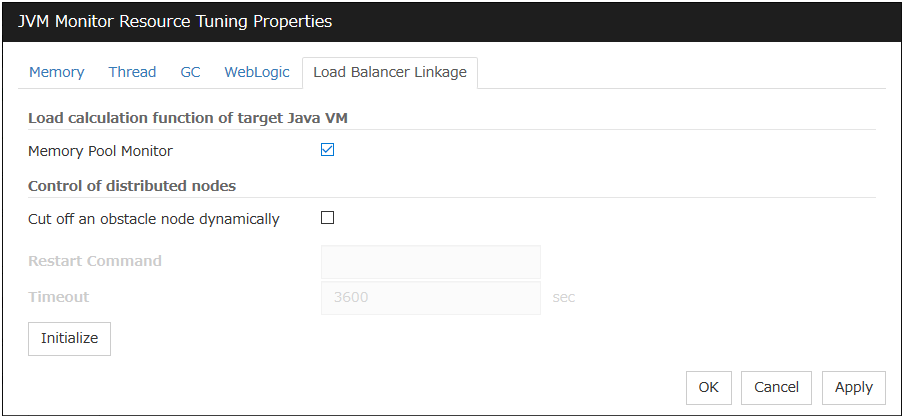 Properties - Monitor(special) tab -> Tuning properties- Load Balancer Linkage tabSelect the Memory Pool Monitor check box.
 - Custom monitor resourceProperties - Monitor(common) tabSelect the Monitor Timing - Always radio button.Properties - Monitor(special) tabSelect Script created with this product.Select File - Edit and then add the following boldfaced section.#! /bin/sh#***********************************************#* genw.sh *#***********************************************ulimit -s unlimited${CLP_PATH}/ha/jra/bin/clpjra_bigip weightexit 0
Select the Monitor Type - Synchronous radio button.
In the BIG-IP LTM setting, specify Ratio(node) in LocalTrafic - Pools:PoolList - Relevant pool - Members - LoadBalancing - Load Balancing Method of BIG-IP Configuration Utility.
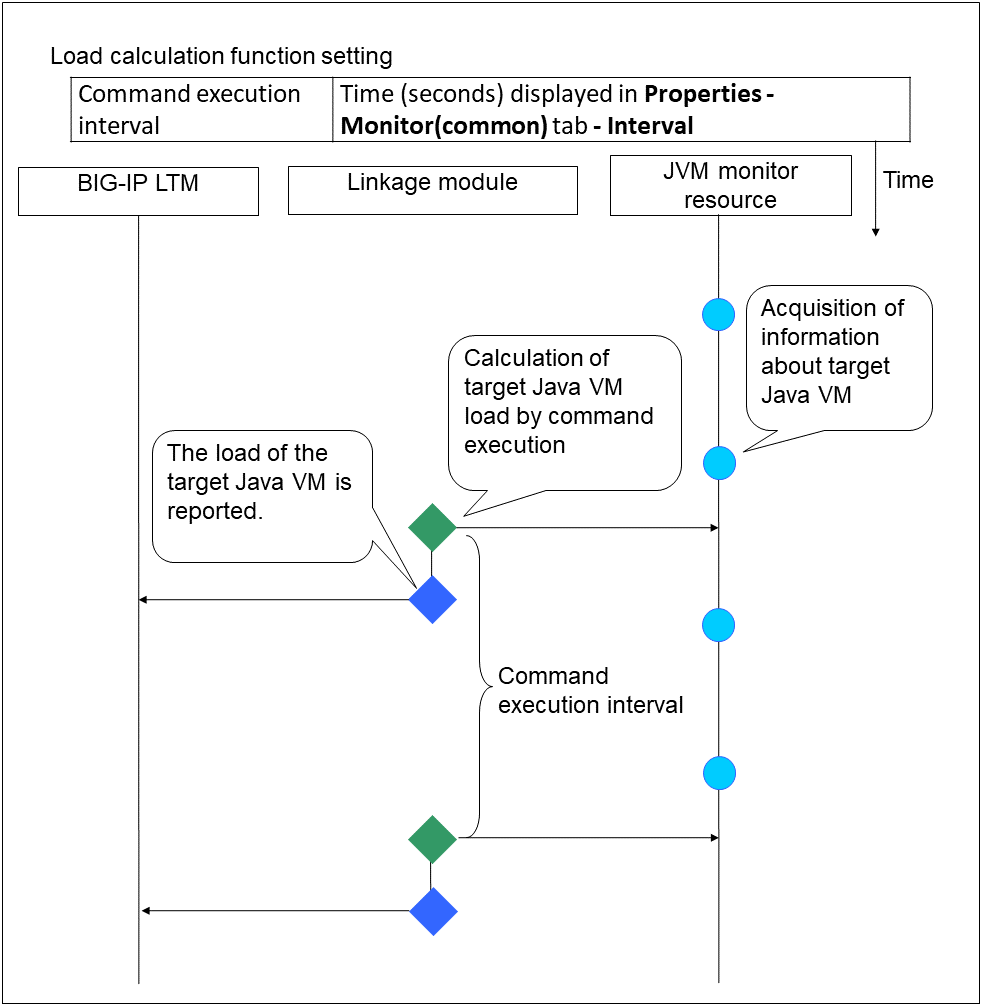
4.42.6. JVM statistics log
JVM monitor resources collect statistics information on the monitor target Java VM. The information is stored in CSV-format files, as JVM statistics logs. The file is created in the following location:
<EXPRESSCLUSTER_install_path>/log/ha/jra/*.stat
The following "monitor items" see the parameters on the [Monitor(special)] tab of [Properties] of the JVM monitor resources.
Statistical information is collected and output to its corresponding JVM statistical log when an item is selected and the threshold value is set for the item. If a monitor item is not selected, statistical information on the item will be neither collected nor output to its corresponding JVM statistical log.
The following table lists the monitor items and the corresponding JVM statistics logs.
Monitor items |
Corresponding JVM statistics log |
|---|---|
[Memory] tab - [Monitor Heap Memory Rate]
[Memory] tab - [Monitor Non-Heap Memory Rate]
[Memory] tab-[Monitor Heap Memory Usage]
[Memory] tab -[Monitor Non-Heap Memory Usage]
|
jramemory.stat |
[Thread] tab - [Monitor the number of Active Threads] |
jrathread.stat |
[GC] tab - [Monitor the time in Full GC]
[GC] tab - [Monitor the count of Full GC execution]
|
jragc.stat |
[WebLogic] tab - [Monitor the requests in Work Manager]
[WebLogic] tab - [Monitor the requests in Thread Pool]
When either of the above monitor items is checked, both of the logs, such as wlworkmanager.stat and wlthreadpool.stat, are output. No functions to output only one of the two logs are provided.
|
wlworkmanager.stat
wlthreadpool.stat
|
4.42.7. Java memory area usage check on monitor target Java VM (jramemory.stat)
The jramemory.stat log file records the size of the Java memory area used by the monitor target Java VM. Its file name will be either of the following, depending on the Rotation Type selected in the Log Output Setting dialog box.
When Cluster Properties - [JVM monitor] tab - [Log Output Setting] - [Rotation Type] - [File Capacity] is selected: jramemory<integer_starting_with_0>.stat
When Cluster Properties - [JVM monitor] tab - [Log Output Setting] - [Rotation Type] - [Period] is selected: jramemory<YYYYMMDDhhmm>.stat
The data format is as follows.
No |
Format |
Description |
|---|---|---|
1 |
yyyy/mm/dd hh:mm:ss.SSS |
Date and time of log recording |
2 |
Half-size alphanumeric characters and symbols |
Name of the monitor target Java VM; this is specified in [Properties] - [Monitor(special)] tab - [Identifier] in JVM monitor resources. |
3 |
Half-size alphanumeric characters and symbols |
Name of the Java memory pool; for details, refer to "Java memory pool name". |
4 |
Half-size alphanumeric characters and symbols |
Type of Java memory pool
Heap, Non-Heap
|
5 |
Half-size numeric characters |
Memory size that the Java VM requests from the OS at startup; this is expressed in bytes. (init)
At the startup of the monitor target Java VM, the size can be specified using the following Java VM startup options.
|
6 |
Half-size numeric characters |
Memory size currently used by the Java VM; this is expressed in bytes. (used) |
7 |
Half-size numeric characters |
Memory size guaranteed for use by the operation of the Java VM; this is expressed in bytes. (committed)
This size varies depending on the memory use; it is always equal to the value of "used" or larger but equal to or smaller than the value of "max".
|
8 |
Half-size numeric characters |
Maximum memory size that the Java VM can use; this is expressed in bytes. (max)
The size can be specified using the following Java VM startup options.
Example)
java -XX:MaxPermSize=128m -XX:ReservedCodeCacheSize=128m javaAP
In this example, max of NON_HEAP becomes 128 m + 128 m = 256 m.
(Note)
When the same value is specified for -Xms and -Xmx, "init" may become larger than "max". This is because "max" of HEAP is determined by subtracting half the size of the Survivor Space from the area size determined by the specification of -Xmx.
|
9 |
Half-size numeric characters |
Peak size of the memory used after startup of the measurement target Java VM; when the name of the Java memory pool is HEAP or NON_HEAP, this size becomes equal to that of the memory currently used by the Java VM (used). This is expressed in bytes. |
10 |
Half-size numeric characters |
Ignore when Oracle Java (usage monitoring) is selected for [JVM Type].
When an item other than [Oracle Java (usage monitoring)] is selected for JVM Type, memory size equal to "max" (No. 8 field) * the threshold (%) when the Java memory pool type (No. 4 field) is HEAP; it is expressed in bytes.
When the Java memory pool type is other than HEAP, it is 0.
|
4.42.8. Thread operation status check on monitor target Java VM (jrathread.stat)
The jrathread.stat log file records the thread operation status of the monitor target Java VM. Its file name will be either of the following depending on the Rotation Type selected in the Log Output Setting dialog box.
When Cluster Properties - [JVM monitor] tab - [Log Output Setting] - [Rotation Type] - [File Capacity] is selected: jrathread<integer_starting_with_0>.stat
When Cluster Properties - [JVM monitor] tab - [Log Output Setting] - [Rotation Type] - [Period] is selected: jrathread<YYYYMMDDhhmm>.stat
The data format is as follows.
No |
Format |
Description |
|---|---|---|
1 |
yyyy/mm/dd hh:mm:ss.SSS |
Date and time of log recording |
2 |
Half-size alphanumeric characters and symbols |
Name of the monitor target Java VM; this is specified in [Properties] - [Monitor(special)] tab - [Identifier] in JVM monitor resources. |
3 |
Half-size alphanumeric characters and symbols |
Number of active threads in the monitor target Java VM |
4 |
[Half-size numeric characters: half-size numeric characters:...] |
Deadlocked thread ID in the monitor target Java VM; this contains the IDs of all the deadlocked threads, in order. |
5 |
Half-size alphanumeric characters and symbols |
Detailed information on deadlocked threads in the monitor target Java VM; it contains information on all the deadlocked threads, in order, in the following format.
ThreadName, ThreadID, ThreadStatus, UserTime, CpuTime, WaitedCount, WaitedTime, isInNative, isSuspended <line feed>
stacktrace<line feed>
:
stacktrace<line feed>
stacktrace=ClassName, FileName, LineNumber, MethodName, isNativeMethod
|
4.42.9. GC operation status check on monitor target Java VM (jragc.stat)
The jragc.stat log file records the GC operation status of the monitor target Java VM. Its file name will be either of the following, depending on the Rotation Type selected in the Log Output Setting dialog box.
When Cluster Properties - [JVM monitor] tab - [Log Output Setting] - [Rotation Type]-[File Capacity] is selected: jragc<integer_starting_with_0>.stat
When Cluster Properties - [JVM monitor] tab - [Log Output Setting] - [Rotation Type] - [Period] is selected: jragc<YYYYMMDDhhmm>.stat
JVM monitor resources output two types of GC information: Copy GC and Full GC.
With Oracle Java, JVM monitor resources count the increment in the count of execution of the following GC as Full GC.
MarksweepCompact
MarkSweepCompact
PS Marksweep
ConcurrentMarkSweep
The data format is as follows.
No |
Format |
Description |
|---|---|---|
1 |
yyyy/mm/dd hh:mm:ss.SSS |
Date and time of log recording |
2 |
Half-size alphanumeric characters and symbols |
Name of the monitor target Java VM; this is specified in [Properties] - [Monitor(special)] tab - [Identifier] in JVM monitor resources. |
3 |
Half-size alphanumeric characters and symbols |
GC name of monitor target Java VM
When the monitor target Java VM is Oracle Java
Copy
MarksweepCompact
The GC name to be indicated is one of the following.
MarkSweepCompact
PS Scavenge
PS Marksweep
ParNew
ConcurrentMarkSweep
When the monitor target Java VM is Oracle JRockit
The GC name to be indicated is one of the following.
Garbage collection optimized for throughput Old Collector
Garbage collection optimized for short pausetimes Old Collector
Garbage collection optimized for deterministic pausetimes Old Collector
Static Collector
Static Old Collector
Garbage collection optimized for throughput Young Collector
|
4 |
Half-size numeric characters |
Count of GC execution during the period from startup of the monitor target Java VM to measurement; the count includes the GC executed before the JVM monitor resource starts monitoring. |
5 |
Half-size numeric characters |
Total time in GC execution during the period from startup of the monitor target Java VM to measurement; this is expressed in milliseconds. This includes the time taken for the GC executed before the JVM monitor resource starts monitoring. |
4.42.10. Operation status check on Work Manager of WebLogic Server (wlworkmanager.stat)
The wlworkmanager.stat log file records the operation status of the Work Manager of the WebLogic Server. Its file name will be either of the following depending on the Rotation Type selected in the Log Output Setting dialog box.
When Cluster Properties - [JVM monitor] tab - [Log Output Setting] - [Rotation Type] - [File Capacity] is selected: wlworkmanager<integer_starting_with_0>.stat
When Cluster Properties - [JVM monitor] tab - [Log Output Setting] - [Rotation Type] - [Period] is selected: wlworkmanager<YYYYMMDDhhmm>.stat
The data format is as follows.
No |
Format |
Description |
|---|---|---|
1 |
yyyy/mm/dd hh:mm:ss.SSS |
Date and time of log recording |
2 |
Half-size alphanumeric characters and symbols |
Name of the monitor target Java VM; this is specified in [Properties] - [Monitor(special)] tab - [Identifier] in JVM monitor resources. |
3 |
Half-size alphanumeric characters and symbols |
Application name |
4 |
Half-size alphanumeric characters and symbols |
Work Manager name |
5 |
Half-size numeric characters |
Request execution count |
6 |
Half-size numeric characters |
Number of wait requests |
4.42.11. Operation status check on Thread Pool of WebLogic Server (wlthreadpool.stat)
The wlthreadpool.stat log file records the operation status of the thread pool of the WebLogic Server. Its file name will be either of the following depending on the Rotation Type selected in the Log Output Setting dialog box.
When Cluster Properties - [JVM monitor] tab - [Log Output Setting] - [Rotation Type] - [File Capacity] is selected: wlthreadpool<integer_starting_with_0>.stat
When Cluster Properties - [JVM monitor] tab - [Log Output Setting] - [Rotation Type] - [Period] is selected: wlthreadpool<YYYYMMDDhhmm>.stat
The data format is as follows.
No |
Format |
Description |
|---|---|---|
1 |
yyyy/mm/dd hh:mm:ss.SSS |
Date and time of log recording |
2 |
Half-size alphanumeric characters and symbols |
Name of monitor target Java VM; this is specified in [Properties] - [Monitor(special)] tab - [Identifier] in JVM monitor resources. |
3 |
Half-size numeric characters |
Total request execution count |
4 |
Half-size numeric characters |
Number of requests queued in the WebLogic Server |
5 |
Half-size numeric characters |
Request execution per unit time count (seconds) |
6 |
Half-size numeric characters |
Number of threads for executing the application |
7 |
Half-size numeric characters |
Number of threads in idle state |
8 |
Half-size numeric characters |
Number of executing threads |
9 |
Half-size numeric characters |
The number of threads in stand-by state |
4.42.12. Java memory pool name
This section describes the Java memory pool name output as memory_name in messages to the JVM operation log file. It also describes the Java memory pool name output to the JVM statistics log file, jramemory.stat log file.
When Oracle Java is selected for JVM Type, and "-XX:+UseSerialGC" is specified as a startup option for the monitor target Java VM, the No. 3 Java memory pool name in the jramemory.stat log file will be as follows.
Monitor item |
Character string output as memory_name |
|---|---|
[Monitor Heap Memory Rate] - [Total Usage] |
HEAP |
[Monitor Heap Memory Rate] - [Eden Space] |
Eden Space |
[Monitor Heap Memory Rate] - [Survivor Space] |
Survivor Space |
[Monitor Heap Memory Rate] - [Tenured Gen] |
Tenured Gen |
[Monitor Non-Heap Memory Rate] - [Total Usage] |
NON_HEAP |
[Monitor Non-Heap Memory Rate] - [Code Cache] |
Code Cache |
[Monitor Non-Heap Memory Rate] - [Perm Gen] |
Perm Gen |
[Monitor Non-Heap Memory Rate] - [Perm Gen[shared-ro]] |
Perm Gen [shared-ro] |
[Monitor Non-Heap Memory Rate] - [Perm Gen[shared-rw]] |
Perm Gen [shared-rw] |
When Oracle Java is selected for JVM Type, and "-XX:+UseParallelGC" and "-XX:+UseParallelOldGC" are specified as the startup options for the monitor target Java VM, the No. 3 Java memory pool name in the jramemory.stat log file will be as follows.
Monitor item |
Character string output as memory_name |
|---|---|
[Monitor Heap Memory Rate] - [Total Usage] |
HEAP |
[Monitor Heap Memory Rate] - [Eden Space] |
PS Eden Space |
[Monitor Heap Memory Rate] - [Survivor Space] |
PS Survivor Space |
[Monitor Heap Memory Rate] - [Tenured Gen] |
PS Old Gen |
[Monitor Non-Heap Memory Rate] - [Total Usage] |
NON_HEAP |
[Monitor Non-Heap Memory Rate] - [Code Cache] |
Code Cache |
[Monitor Non-Heap Memory Rate] - [Perm Gen] |
PS Perm Gen |
[Monitor Non-Heap Memory Rate] - [Perm Gen[shared-ro]] |
Perm Gen [shared-ro] |
[Monitor Non-Heap Memory Rate] - [Perm Gen[shared-rw]] |
Perm Gen [shared-rw] |
When Oracle Java is selected for JVM Type, and "-XX:+UseConcMarkSweepGC" is specified as a startup option for the monitor target Java VM, the No. 3 Java memory pool name in the jramemory.stat log file will be as follows.
Monitor item |
Character string output as memory_name |
|---|---|
[Monitor Heap Memory Rate] - [Total Usage] |
HEAP |
[Monitor Heap Memory Rate] - [Eden Space] |
Par Eden Space |
[Monitor Heap Memory Rate] - [Survivor Space] |
Par Survivor Space |
[Monitor Heap Memory Rate] - [Tenured Gen] |
CMS Old Gen |
[Monitor Non-Heap Memory Rate] - [Total Usage] |
NON_HEAP |
[Monitor Non-Heap Memory Rate] - [Code Cache] |
Code Cache |
[Monitor Non-Heap Memory Rate] - [Perm Gen] |
CMS Perm Gen |
[Monitor Non-Heap Memory Rate] - [Perm Gen[shared-ro]] |
Perm Gen [shared-ro] |
[Monitor Non-Heap Memory Rate] - [Perm Gen[shared-rw]] |
Perm Gen [shared-rw] |
When [Oracle Java(usage monitoring)] is selected for [JVM Type] and "-XX:+UseSerialGC" is specified as a startup option for the monitor target Java VM, the No. 3 Java memory pool name in the jramemory.stat file will be as follows.
Monitor item |
Character string output as memory_name |
|---|---|
[Monitor Heap Memory Usage]-[Total Usage] |
HEAP |
[Monitor Heap Memory Usage]-[Eden Space] |
Eden Space |
[Monitor Heap Memory Usage]-[Survivor Space] |
Survivor Space |
[Monitor Heap Memory Usage]-[Tenured Gen] |
Tenured Gen |
[Monitor Non-Heap Memory Usage]-[Total Usage] |
NON_HEAP |
[Monitor Non-Heap Memory Usage]-[Code Cache] |
Code Cache (For Java 9, no output) |
[Monitor Non-Heap Memory Usage]-[Metaspace] |
Metaspace |
[Monitor Non-Heap Memory Usage]-[CodeHeap non-nmethods] |
CodeHeap non-nmethods |
[Monitor Non-Heap Memory Usage]-[CodeHeap profiled] |
CodeHeap profiled nmethods |
[Monitor Non-Heap Memory Usage]-[CodeHeap non-profiled] |
CodeHeap non-profiled nmethods |
[Monitor Non-Heap Memory Usage]-[Compressed Class Space] |
Compressed Class Space |
When [Oracle Java(usage monitoring)] is selected for [JVM Type] and "-XX:+UseParallelGC" and "-XX:+UseParallelOldGC" are specified as startup options for the monitor target Java VM, the No. 3 Java memory pool name in the jramemory.stat file will be as follows.
Monitor item |
Character string output as memory_name |
|---|---|
[Monitor Heap Memory Usage]-[Total Usage] |
HEAP |
[Monitor Heap Memory Usage]-[Eden Space] |
PS Eden Space |
[Monitor Heap Memory Usage]-[Survivor Space] |
PS Survivor Space |
[Monitor Heap Memory Usage]- [Tenured Gen] |
PS Old Gen |
[Monitor Non-Heap Memory Usage]-[Total Usage] |
NON_HEAP |
[Monitor Non-Heap Memory Usage]-[Code Cache] |
Code Cache (For Java 9, no output) |
[Monitor Non-Heap Memory Usage]-[Metaspace] |
Metaspace |
[Monitor Non-Heap Memory Usage]-[CodeHeap non-nmethods] |
CodeHeap non-nmethods |
[Monitor Non-Heap Memory Usage]-[CodeHeap profiled] |
CodeHeap profiled nmethods |
[Monitor Non-Heap Memory Usage]-[CodeHeap non-profiled] |
CodeHeap non-profiled nmethods |
[Monitor Non-Heap Memory Usage]-[Compressed Class Space] |
Compressed Class Space |
When [Oracle Java(usage monitoring)] is selected for [JVM Type] and "-XX:+UseConcMarkSweepGC" is specified as a startup option for the monitor target Java VM, the No. 3 Java memory pool name in the jramemory.stat file will be as follows.
Monitor item |
Character string output as memory_name |
|---|---|
[Monitor Heap Memory Usage]-[Total Usage] |
HEAP |
[Monitor Heap Memory Usage]-[Eden Space] |
Par Eden Space |
[Monitor Heap Memory Usage]-[Survivor Space] |
Par Survivor Space |
[Monitor Heap Memory Usage]-[Tenured Gen] |
CMS Old Gen |
[Monitor Non-Heap Memory Usage]-[Total Usage] |
NON_HEAP |
[Monitor Non-Heap Memory Usage]-[Code Cache] |
Code Cache (For Java 9, no output) |
[Monitor Non-Heap Memory Usage]-[Metaspace] |
Metaspace |
[Monitor Non-Heap Memory Usage]-[CodeHeap non-nmethods] |
CodeHeap non-nmethods |
[Monitor Non-Heap Memory Usage]-[CodeHeap profiled] |
CodeHeap profiled nmethods |
[Monitor Non-Heap Memory Usage]-[CodeHeap non-profiled] |
CodeHeap non-profiled nmethods |
[Monitor Non-Heap Memory Usage]-[Compressed Class Space] |
Compressed Class Space |
When [Oracle Java(usage monitoring)] is selected for [JVM Type] and "-XX:+UseParNewGC" is specified as a startup option for the monitor target Java VM, the No. 3 Java memory pool name in the jramemory.stat file will be as follows. For Java 9, if -XX:+UseParNewGC is specified, the monitor target Java VM does not start.
Monitor item |
Character string output as memory_name |
|---|---|
[Monitor Heap Memory Usage]-[Total Usage] |
HEAP |
[Monitor Heap Memory Usage]-[Eden Space] |
Par Eden Space |
[Monitor Heap Memory Usage]-[Survivor Space] |
Par Survivor Space |
[Monitor Heap Memory Usage]-[Tenured Gen] |
Tenured Gen |
[Monitor Non-Heap Memory Usage]-[Total Usage] |
NON_HEAP |
[Monitor Non-Heap Memory Usage]-[Code Cache] |
Code Cache |
[Monitor Non-Heap Memory Usage]-[Metaspace] |
Metaspace |
[Monitor Non-Heap Memory Usage]-[CodeHeap non-nmethods] |
CodeHeap non-nmethods |
[Monitor Non-Heap Memory Usage]-[CodeHeap profiled] |
CodeHeap profiled nmethods |
[Monitor Non-Heap Memory Usage]-[CodeHeap non-profiled] |
CodeHeap non-profiled nmethods |
[Monitor Non-Heap Memory Usage]-[Compressed Class Space] |
Compressed Class Space |
When [Oracle Java(usage monitoring)] is selected for [JVM Type] and "-XX::+UseG1GC" is specified as a startup option for the monitor target Java VM the No. 3 Java memory pool name in the jramemory.stat file will be as follows.
Monitor item |
Character string output as memory_name |
|---|---|
[Monitor Heap Memory Usage]-[Total Usage] |
HEAP |
[Monitor Heap Memory Usage]-[Eden Space] |
G1 Eden Space |
[Monitor Heap Memory Usage]-[Survivor Space] |
G1 Survivor Space |
[Monitor Heap Memory Usage]-[Tenured Gen (Old Gen)] |
G1 Old Gen |
[Monitor Non-Heap Memory Usage]-[Total Usage] |
NON_HEAP |
[Monitor Non-Heap Memory Usage]-[Code Cache] |
Code Cache (For Java 9, no output) |
[Monitor Non-Heap Memory Usage]-[Metaspace] |
Metaspace |
[Monitor Non-Heap Memory Usage]-[CodeHeap non-nmethods] |
CodeHeap non-nmethods |
[Monitor Non-Heap Memory Usage]-[CodeHeap profiled] |
CodeHeap profiled nmethods |
[Monitor Non-Heap Memory Usage]-[CodeHeap non-profiled] |
CodeHeap non-profiled nmethods |
[Monitor Non-Heap Memory Usage]-[Compressed Class Space] |
Compressed Class Space |
When the monitor target Java VM is Oracle JRockit (when [JRockit] is selected for [JVM Type]), the No. 3 Java memory pool name in the jramemory.stat log file will be as follows.
Monitor item |
Character string output as memory_name |
|---|---|
[Monitor Heap Memory Rate] - [Total Usage] |
HEAP memory |
[Monitor Heap Memory Rate] - [Nursery Space] |
Nursery |
[Monitor Heap Memory Rate] - [Old Space] |
Old Space |
[Monitor Non-Heap Memory Rate] - [Total Usage] |
NON_HEAP |
[Monitor Non-Heap Memory Rate] - [Class Memory] |
Class Memory |
Java memory pool names appearing in the jramemory.stat log file, a JVM statistics log file, correspond to the Java VM memory space as follows.
For Oracle Java 7
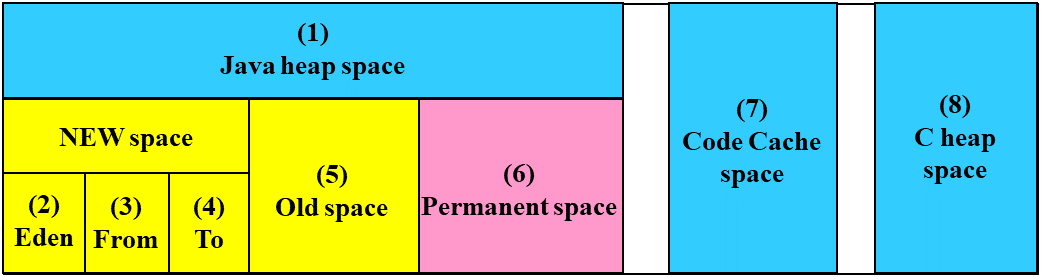
No. in diagram
Monitor item
Java memory pool name in jramemory.stat log file
(1)
[Monitor Heap Memory Rate] - [Total Usage]
HEAP
(2)
[Monitor Heap Memory Rate] - [Eden Space]
EdenSpacePS Eden SpacePar Eden Space(3)+(4)
[Monitor Heap Memory Rate] - [Survivor Space]
Survivor SpacePS Survivor SpacePar Survivor Space(5)
[Monitor Heap Memory Rate] - [Tenured Gen]
Tenured GenPS Old GenCMS Old Gen(6)
[Monitor Non-Heap Memory Rate] - [Perm Gen][Monitor Non-Heap Memory Rate] - [Perm Gen[shared-ro]][Monitor Non-Heap Memory Rate] - [Perm Gen[shared-rw]]Perm GenPerm Gen [shared-ro]Perm Gen [shared-rw]PS Perm GenCMS Perm Gen(7)
[Monitor Non-Heap Memory Rate] - [Code Cache]
Code Cache
(8)
-
-
(6)+(7)
[Monitor Non-Heap Memory Rate] - [Total Usage]
NON_HEAP* No stack trace is included.For Oracle Java 8/Oracle Java 9
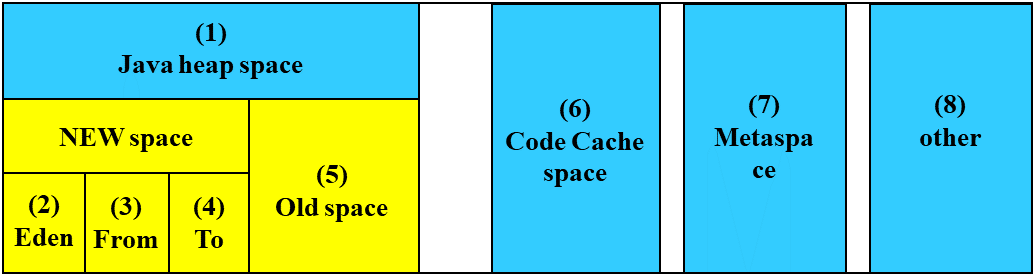
Number in diagram
Monitor item
Java memory pool name in jramemory.stat log file
(1)
[Monitor Heap Memory Usage] - [Total Usage]
HEAP
(2)
[Monitor Heap Memory Usage] - [Eden Space]
EdenSpacePS Eden SpacePar Eden SpaceG1 Eden Space(3)+(4)
[Monitor Heap Memory Usage] - [Survivor Space]
Survivor SpacePS Survivor SpacePar Survivor SpaceG1 Survivor Space(5)
[Monitor Heap Memory Usage] - [Tenured Gen]
Tenured GenPS Old GenCMS Old GenG1 Old Gen(6)
[Monitor Non-Heap Memory Usage] - [Code Cache]
Code Cache
(6)
[Monitor Non-Heap Memory Usage]-[CodeHeap non-nmethods]
CodeHeap non-nmethods (Only for Java 9, it is output.)
(6)
[Monitor Non-Heap Memory Usage]-[CodeHeap profiled]
CodeHeap profiled nmethods (Only for Java 9, it is output.)
(6)
[Monitor Non-Heap Memory Usage]-[CodeHeap non-profiled]
CodeHeap non-profiled nmethods (Only for Java 9, it is output.)
(7)
[Monitor Non-Heap Memory Usage] - [Metaspace]
Metaspace
(8)
[Monitor Non-Heap Memory Usage]-[Compressed Class Space]
Compressed Class Space
(6)+(7)+(8)
[Monitor Non-Heap Memory Usage] - [Total Usage]
NON_HEAP
For Oracle JRockit
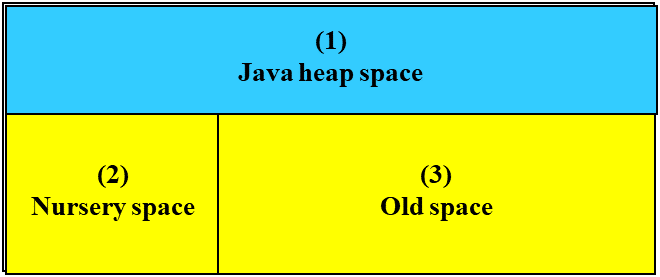
No. in diagram
Monitor item
Java memory pool name in jramemory.stat log file
(1)
[Monitor Heap Memory Rate] - [Total Usage]
HEAP memory
(2)
[Monitor Heap Memory Rate] - [Nursery Space]
Nursery
(3) (Note)
[Monitor Heap Memory Rate] - [Old Space]
Old Space
-
[Monitor Non-Heap Memory Rate] - [Total Usage]
NON_HEAP
-
[Monitor Non-Heap Memory Rate] - [Class Memory]
Class Memory
Note
"Old Space", a Java memory pool name in the jramemory.stat log file, does not indicate the value corresponding to the old space of the Heap but rather the value corresponding to the entire "Heap memory". Independent measurement of only (3) is not possible.
4.42.13. Executing a command corresponding to cause of each detected error
The following setting items specify the commands that will be executed according to the error cause.
Error cause |
Setting item |
|---|---|
- Failure in connection to the monitor target Java VM
- Failure in resource measurement
|
[Monitor(special)] tab - [Command] |
- Heap memory rate
- Non-heap memory rate
- Heap memory usage
- Non-heap memory usage
|
[Monitor(special)] tab - [Tuning] properties - [Memory] tab - [Command] |
- Number of active threads |
[Monitor(special)] tab - [Tuning] properties - [Thread] tab - [Command] |
- Time in Full GC
- Count of Full GC execution
|
[Monitor(special)] tab - [Tuning] properties - [GC] tab - [Command] |
- Requests in Work Manager of WebLogic
- Requests in Thread Pool of WebLogic
|
[Monitor(special)] tab - [Tuning] properties - [WebLogic] tab - [Command] |
[Command] passes the details of an error cause as the arguments of a command with the arguments attached to the end of [Command]. A Command that is specialized for dealing with specific error causes can be defined by designing and specifying a script etc. for [Command]. The following character strings are passed as the arguments.
When multiple character strings are stated as possible arguments, one will be passed according to the GC type of the monitor target Java VM. For details about their differences, see "Java memory pool name".
The statements "(For Oracle Java)" and "(For Oracle JRockit)" suggest that different character strings are used according to the JVM type. When there is no such statement, the same character strings are used equally for all JVM types.
Details of error causes |
Character string passed as argument |
|---|---|
- Failure in connection to the monitor target Java VM
- Failure in resource measurement
|
No character string defined |
[Monitor(special)] tab - [Tuning] properties - [Memory] tab - [Monitor Memory Heap Rate] - [Total Usage]
(For Oracle Java)
|
HEAP |
[Memory] tab - [Monitor Memory Heap Rate] - [Eden Space]
(For Oracle Java)
|
EdenSpace
PSEdenSpace
ParEdenSpace
|
[Memory] tab - [Monitor Memory Heap Rate] - [Survivor Space]
(For Oracle Java)
|
SurvivorSpace
PSSurvivorSpace
ParSurvivorSpace
|
[Memory] tab - [Monitor Memory Heap Rate] - [Tenured Gen]
(For Oracle Java)
|
TenuredGen
PSOldGen
CMSOldGen
|
[Memory] tab - [Monitor Non-Heap Memory Rate] - [Total Usage]
(For Oracle Java)
|
NON_HEAP |
[Memory] tab - [Monitor Memory Non-Heap Rate] - [Code Cache]
(For Oracle Java)
|
CodeCache |
[Memory] tab - [Monitor Memory Non-Heap Rate] - [Perm Gen]
(For Oracle Java)
|
PermGen
PSPermGen
CMSPermGen
|
[Memory] tab - [Monitor Memory Non-Heap Rate] - [Perm Gen[shared-ro]]
(For Oracle Java)
|
PermGen[shared-ro] |
[Memory] tab - [Monitor Memory Non-Heap Rate] - [Perm Gen[shared-rw]]
(For Oracle Java)
|
PermGen[shared-rw] |
[Memory] tab - [Monitor Heap Memory Usage] - [Total Usage] (for Oracle Java(usage monitoring)) |
HEAP |
[Memory] tab - [Monitor Heap Memory Usage] - [Eden Space] (for Oracle Java(usage monitoring)) |
EdenSpace
PSEdenSpace
ParEdenSpace
G1EdenSpace
|
[Memory] tab - [Monitor Heap Memory Usage]-[Survivor Space] (for Oracle Java(usage monitoring)) |
SurvivorSpace
PSSurvivorSpace
ParSurvivorSpace
G1SurvivorSpace
|
[Memory] tab - [Monitor Heap Memory Usage] - [Tenured Gen] (for Oracle Java(usage monitoring)) |
TenuredGen
PSOldGen
CMSOldGen
G1OldGen
|
[Memory] tab - [Monitor Non-Heap Memory Usage] - [Total Usage] (for Oracle Java(usage monitoring)) |
NON_HEAP |
[Memory] tab - [Monitor Non-Heap Memory Usage] - [Code Cache] (for Oracle Java(usage monitoring)) |
CodeCache |
[Memory] tab - [Monitor Non-Heap Memory Usage] - [Metaspace] (for Oracle Java(usage monitoring)) |
Metaspace |
[Memory] tab - [Monitor Non-Heap Memory Usage]-[CodeHeap non-nmethods] (when Oracle Java (usage monitoring) is selected) |
non-nmethods |
[Memory] tab - [Monitor Non-Heap Memory Usage]-[CodeHeap profiled] (when Oracle Java (usage monitoring) is selected) |
profilednmethods |
[Memory] tab - [Monitor Non-Heap Memory Usage]-[CodeHeap non-profiled] (when Oracle Java (usage monitoring) is selected) |
non-profilednmethods |
[Memory] tab - [Monitor Non-Heap Memory Usage]-[Compressed Class Space] (when Oracle Java (usage monitoring) is selected) |
CompressedClassSpace |
[Memory] tab - [Monitor Memory Heap Rate] - [Total Usage]
(For Oracle JRockit)
|
HEAP
Heap
|
[Memory] tab - [Monitor Memory Heap Rate] - [Nursery Space]
(For Oracle JRockit)
|
Nursery |
[Memory] tab - [Monitor Memory Heap Rate] - [Old Space]
(For Oracle JRockit)
|
OldSpace |
[Memory] tab - [Monitor Memory Non-Heap Rate] - [Total Usage]
(For Oracle JRockit)
|
NON_HEAP |
[Memory] tab - [Monitor Memory Non-Heap Rate] - [Class Memory]
(For Oracle JRockit)
|
ClassMemory |
[Thread] tab - [Monitor the number of Active Threads] |
Count |
[GC] tab - [Monitor the time in Full GC] |
Time |
[GC] tab - [Monitor the count of Full GC execution] |
Count |
[WebLogic] tab - [Monitor the requests in Work Manager] - [Waiting Requests, The number] |
WorkManager_PendingRequests |
[WebLogic] tab - [Monitor the requests in Thread Pool] - [Waiting Requests, The number] |
ThreadPool_PendingUserRequestCount |
[WebLogic] tab - [Monitor the requests in Thread Pool] - [Executing Requests, The number] |
ThreadPool_Throughput |
The following are examples of execution.
Example 1)
Setting item |
Setting information |
|---|---|
[Monitor(special)] tab - [Tuning] properties - [GC] tab - [Command] |
/usr/local/bin/downcmd |
[Monitor(special)] tab - [Tuning] properties - [GC] tab - [Monitor the count of Full GC execution] |
1 |
[Cluster] properties - [JVM monitor] tab - [Resource Measurement Setting] - [Common] tab - [Error Threshold] |
3 |
If Full GC is executed as many times, in succession, as specified by the Error Threshold (three times), the JVM monitor resources will detect a monitor error and execute a command corresponding to "/usr/local/bin/downcmd Cont".
Example 2)
Setting item |
Setting information |
|---|---|
[Monitor(special)] tab - [Tuning] properties - [GC] tab - [Command] |
"/usr/local/bin/downcmd" GC |
[Monitor(special)] tab - [Tuning] properties - [GC] tab - [Monitor the time in Full GC] |
65536 |
[Cluster] properties - [JVM monitor] tab - [Resource Measurement Setting] - [Common] tab - [Error Threshold] |
3 |
If the time in Full GC exceeds 65535 milliseconds as many times, in succession, as specified by the Error Threshold (three times), the JVM monitor resources will detect a monitor error and execute a command corresponding to "/usr/local/bin/downcmd GC Time".
Example 3)
Setting item |
Setting information |
|---|---|
[Monitor(special)] tab - [Tuning] properties - [Memory] tab - [Command] |
"/usr/local/bin/downcmd" memory |
[Monitor(special)] tab - [Tuning] properties - [Memory] tab - [Monitor Heap Memory Rate] |
On |
[Monitor(special)] tab - [Tuning] properties - [Memory] tab - [Eden Space] |
80 |
[Monitor(special)] tab - [Tuning] properties - [Memory] tab - [Survivor Space] |
80 |
[Cluster] properties - [JVM monitor] tab - [Resource Measurement Setting] - [Common] tab - [Error Threshold] |
3 |
If the usage rate of the Java Eden Space and that of the Java Survivor Space exceed 80% as many times, in succession, as specified by the Error Threshold (three times), the JVM monitor resources will detect a monitor error and execute a command corresponding to "/usr/local/bin/downcmd memory EdenSpace SurvivorSpace".
Timeout (seconds) for waiting for the completion of execution of the command specified by [Command] is set by specifying [Command Timeout] in the [JVM monitor] tab of the Cluster Properties window. The same value is applied to the timeout of [Command] of each of the above-mentioned tabs; the timeout cannot be specified for each [Command] separately.
If a timeout occurs, the system will not perform processing for forced termination of the [Command] process; the operator must perform post-processing (e.g. forced termination) of the [Command] process. When a timeout occurs, the following message is output to the JVM operation log:
action thread execution did not finish. action is alive = <command>.
Note the following.
No [Command] is executed when restoration of the Java VM to normal operation (error -> normal operation) is detected.
[Command] is executed upon the detection of an error in the Java VM (when threshold exceeding occurs as many times, in succession, as specified by the error threshold). It is not executed at each threshold exceeding.
Note that specifying [Command] on multiple tabs allows multiple commands to be executed if multiple errors occur simultaneously, causing a large system load.
[Command] may be executed twice simultaneously when the following two items are monitored: [Monitor(special)] tab - [Tuning] properties - [WebLogic] tab - [Monitor the requests in Work Manager] - [Waiting Requests, The Number]; [Monitor(special)] tab - [Tuning] properties - [WebLogic] tab - [Monitor the requests in Work Manager] - [Waiting Requests, Average].
This is because errors may be detected simultaneously for the following two items: [Cluster] properties - [JVM monitor] tab - [Resource Measurement Setting] - [WebLogic] tab - [Interval, The number of request]; [Cluster] properties - [JVM monitor] tab - [Resource Measurement Setting] - [WebLogic] tab - [Interval, The average number of the request]. To prevent this from occurring, specify only one of the two items as a monitor target. This applies to the following combinations of monitor items.
[Monitor(special)] tab - [Tuning] properties - [WebLogic] tab - [Monitor the requests in Thread Pool] - [Waiting Requests, The Number] and [Monitor(special)] tab - [Tuning] properties - [WebLogic] tab - [Monitor the requests in Thread Pool] - [Waiting Requests, Average]
[Monitor(special)] tab - [Tuning] properties - [WebLogic] tab - [Monitor the requests in Thread Pool] - [Executing Requests, The Number] and [Monitor(special)] tab - [Tuning] properties - [WebLogic] tab - [Monitor the requests in Thread Pool] - [Executing Requests, Average]
4.42.14. Monitoring WebLogic Server
For how to start the operation of the configured target WebLogic Server as an application server, see the manual for WebLogic Server.
This section describes only the settings required for monitoring by the JVM monitor resource.
- Start WebLogic Server Administration Console.For how to start WebLogic Server Administration Console, refer to " Overview of Administration Console" in the WebLogic Server manual.Select Domain Configuration-Domain-Configuration-General. Make sure that Enable Management Port is unchecked.
Select Domain Configuration-Server, and then select the name of the server to be monitored. Set the selected server name as the identifier on the Monitor(special) tab from Properties that can be selected in the the config mode of Cluster WebUI. See "Understanding JVM monitor resources".
Regarding the target server, select Configuration-General, and then check the port number though which a management connection is established with Listen Port.
Stop WebLogic Server. For how to stop WebLogic Server, refer to "Starting and stopping WebLogic Server" in the WebLogic Server manual.
Start the management server start script of WebLogic Server (startWebLogic.sh).
Write the following instructions in the script.
When the target is the WebLogic Server managing server:
JAVA_OPTIONS="${JAVA_OPTIONS}
-Dcom.sun.management.jmxremote.port=n
-Dcom.sun.management.jmxremote.ssl=false
-Dcom.sun.management.jmxremote.authenticate=false
-Djavax.management.builder.initial=weblogic.management.jmx.mbeanserver.WLSMBeanServerBuilder"
*Write each line of coding on one line.
When the target is a WebLogic Server managed server:
if [ "${SERVER_NAME}" = "SERVER_NAME" ]; then
JAVA_OPTIONS="${JAVA_OPTIONS}
-Dcom.sun.management.jmxremote.port=n
-Dcom.sun.management.jmxremote.ssl=false
-Dcom.sun.management.jmxremote.authenticate=false
-Djavax.management.builder.initial=weblogic.management.jmx.mbeanserver.WLSMBeanServerBuilder"
*Write all the if statement lines (lines 2 to 5) on one line.
Note
For n, specify the number of the port used for monitoring. The specified port number must be different from that of the listen port for the target Java VM. If there are other target WebLogic Server entities on the same machine, specify a port number different from those for the listening port and application ports of the other entities.
Note
For SERVER_NAME, specify the name of the target server confirmed by Select Target Server. If more than one server is targeted, change the server name on the settings (line 1 to 6) for each server.
Note
Place the above addition prior to the following coding:
* Write the above coding on one line.
* The above java arguments differ depending on the WebLogic version. There is no problem by specifying JAVA_OPTIONS before using java.
Note
For monitoring Perm Gen[shared-ro] or Perm Gen[shared-rw] on the Memory tab, add the following line:
-client -Xshare:on -XX:+UseSerialGC
If monitoring requests of work manager and thread pool, make the following settings.
Start WLST (wlst.sh) of the target WebLogic Server. On the console window displayed, execute the following commands:
>connect('USERNAME','PASSWORD','t3://SERVER_ADDRESS:SERVER_PORT')
> edit()
> startEdit()
> cd('JMX/DOMAIN_NAME')
> set('PlatformMBeanServerUsed','true')
> activate()
> exit()
Replace the USERNAME, PASSWORD, SERVER_ADDRESS, SERVER_PORT, and DOMAIN_NAME above with those for the domain environment.
Restart the target WebLogic Server.
4.42.15. Monitoring WebOTX
This guide describes how to configure a target WebOTX to enable monitoring by the JVM monitor resource.
Start the WebOTX Administration Console. For how to start the WebOTX Administration Console, refer to "Starting and stopping administration tool" in the WebOTX Operation (Web Administration Tool).
The settings differ depending on whether a Java process of the JMX agent running on WebOTX or the Java process of a process group is to be monitored. Configure the settings according to the target of monitoring.
4.42.16. Monitoring a Java process of the WebOTX domain agent
There is no need to specify any settings.
4.42.17. Monitoring a Java process of a WebOTX process group
Connect to the domain by using the administration tool.
In the tree view, select <domain_name>-TP System-Application Group-<application_group_name>-Process Group-<process_group_name>.
For the Other Arguments attributes on the JVM Options tab on the right, specify the following Java options on one line. For n, specify the port number. If there is more than one Java VM to be monitored on the same machine, specify a unique port number. The port number specified for the settings is specified with Cluster WebUI (JVM Monitor Resource Name -> Properties -> Monitor(special) tab -> Connection Port).
-Dcom.sun.management.jmxremote.port=n
-Dcom.sun.management.jmxremote.ssl=false
-Dcom.sun.management.jmxremote.authenticate=false
-Djavax.management.builder.initial=com.nec.webotx.jmx.mbeanserver.JmxMBeanServerBuilder
* In the case of WebOTX V9.2 or later, it is unnecessary to specify -Djavax.management.builder.initial.
Then, click Update. After the configuration is completed, restart the process group.
These settings can be made by using Java System Properties, accessible from the Java System Properties tab of the WebOTX administration tool. When making these settings by using the tool, do not designate -D and set the strings prior to = in name and set the strings subsequent to = in value.
Note
If restart upon a process failure is configured as a function of the WebOTX process group, and when the process group is restarted as the recovery processing by EXPRESSCLUSTER, the WebOTX process group may fail to function correctly. For this reason, when monitoring the WebOTX process group, make the following settings for the JVM monitor resource by using the Cluster WebUI.
Tab name for setting |
Item name |
Setting value |
|---|---|---|
Monitor(common) |
Monitor Timing |
Always |
Recovery Action |
Recovery Action |
Execute only the final action |
Recovery Action |
Final Action |
No operation |
Linking with the load balancer is not supported for WebOTX process group monitoring.
4.42.18. Receiving WebOTX notifications
By registering a specific listener class, notification is issued when WebOTX detects a failure. The JVM monitor resource receives the notification and outputs the following message to the JVM operation log.
%1$s:Notification received. %2$s.%1$s and %2$s each indicates the following:%1$s: Monitored Java VM%2$s: Message in the notification (ObjectName=**,type=**,message=**)At present, the following is the detailed information on MBean on the monitorable resource.
ObjectName
[domainname]:j2eeType=J2EEDomain,name=[domainname],category=runtime
notification type
nec.webotx.monitor.alivecheck.not-alive
Message
failed
4.42.19. Monitoring JBoss
The settings are different for monitoring standalone mode and for domain mode. Configure the settings according to the target of monitoring.
This section describes how to configure a target JBoss to be monitored by the JVM monitor resource.
Standalone mode
Stop JBoss, and then open (JBoss_installation_path)/bin/standalone.conf by using editor software.
In the configuration file, specify the following settings. For n, specify the port number. If there is more than one Java VM to be monitored on the same machine, specify a unique port number. The port number specified for the settings is specified with Cluster WebUI (JVM Monitor Resource Name -> Properties -> Monitor(special) tab -> Connection Port).
Add the following before "if [ "x$JBOSS_MODULES_SYSTEM_PKGS" = "x" ]; then".
JBOSS_MODULES_SYSTEM_PKGS="org.jboss.logmanager"
Add the following after "if [ "x$JAVA_OPTS" = "x" ]; then ... fi:".
JAVA_OPTS="$JAVA_OPTS -Xbootclasspath/p:$JBOSS_HOME/modules/org/jboss/logmanager/main/jboss-logmanager-1.3.2.Final-redhat-1.jar"
JAVA_OPTS="$JAVA_OPTS -Djava.util.logging.manager=org.jboss.logmanager.LogManager"
JAVA_OPTS="$JAVA_OPTS -Dcom.sun.management.jmxremote.port=n -Dcom.sun.management.jmxremote.ssl=false -Dcom.sun.management.jmxremote.authenticate=false"
* The storage directory and file name of jboss-logmanager-*.jar differ depending on the JBoss version. Therefore, specify the path accoding to the installation environment.
Save the settings, and then start JBoss.
With Cluster WebUI (JVM Monitor Resource Name -> Properties -> Monitor(special)tab -> Identifier), specify a unique string that is different from those for the other monitor targets (e.g. JBoss).
Domain mode
With Cluster WebUI (JVM Monitor Resource Name -> Properties -> Monitor(special) tab -> Identifier), specify a unique string that is different from those for the other monitor targets (e.g. JBoss). With Cluster WebUI (JVM Monitor Resource Name -> Properties -> Monitor(special) tab -> Process Name), specify all the Java VM startup options so that JBoss can be uniquely identified.
4.42.20. Monitoring Tomcat
This section describes how to configure a target Tomcat to be monitored by the JVM monitor resource.
If Tomcat is installed from an rpm package, stop Tomcat and open /etc/sysconfig/tomcat6 or /etc/sysconfig/tomcat. If Tomcat is not installed from an rpm package, stop Tomcat and create (Tomcat installation path)/bin/setenv.sh.
In the configuration file, for the Java options, specify the following settings on one line. For n, specify the port number. If there is more than one Java VM to be monitored on the same machine, specify a unique port number. The port number specified for the settings is specified with Cluster WebUI (JVM Monitor Resource Name -> Properties -> Monitor(special) tab -> Connection Port).
CATALINA_OPTS="${CATALINA_OPTS}
-Dcom.sun.management.jmxremote.port=n
-Dcom.sun.management.jmxremote.ssl=false
-Dcom.sun.management.jmxremote.authenticate=false"
Save the settings, and then start Tomcat.
With Cluster WebUI (JVM Monitor Resource Name -> Properties -> Monitor(special) tab -> Identifier), specify a unique string that is different from those for the other monitor targets (e.g., tomcat).
4.42.21. Monitoring SVF
This section describes how to configure a target SVF to be monitored by the JVM monitor resource.
If the monitor target is Tomcat:
Change the environment variables of the SVF user in the OS as follows. For n, specify the port number. If there is more than one Java VM to be monitored on the same machine, specify a unique port number. The port number specified here is also specified with the Cluster WebUI ( JVM Monitor Resource Name -> Properties -> Monitor(special) tab -> Connection Port).
JAVA_OPTS="-Xms512m -Xmx512m -Dcom.sun.management.jmxremote.port=n -Dcom.sun.management.jmxremote.ssl=false
-Dcom.sun.management.jmxremote.authenticate=false"
export JAVA_OPTS
If the monitor target is other than Tomcat:
Select a monitor target from the following, and then use an editor to open the corresponding script.
Monitor target
Script to be edited
Simple Httpd Service (for 8.x)
<SVF installation path>/bin/SimpleHttpd
Simple Httpd Service (for 9.x)
<SVF installation path>/bin/UCXServer
RDE Service
<SVF installation path>/rdjava/rdserver/ rd_server_startup.sh
<SVF installation path>/rdjava/rdserver/ svf_server_startup.sh
RD Spool Balancer
<SVF installation path>/rdjava/rdbalancer/ rd_balancer_startup.sh
SVF Print Spooler Service
<SVF installation path>/bin/spooler
In the configuration file, for the Java options, specify the following settings on one line. For n, specify the port number. If there is more than one Java VM to be monitored on the same machine, specify a unique port number. The port number specified here is also specified with the Cluster WebUI (JVM Monitor Resource Name -> Properties -> Monitor(special) tab -> Connection Port).
JAVA_OPTIONS="${JAVA_OPTIONS}
-Dcom.sun.management.jmxremote.port=n
-Dcom.sun.management.jmxremote.ssl=false
-Dcom.sun.management.jmxremote.authenticate=false
If the monitor target is RDE Service, add ${JAVA_OPTIONS} into the following startup path and rd_balancer_startup.sh
java -Xmx256m -Xms256m -Djava.awt.headless=true ${JAVA_OPTIONS}
-classpath $CLASSPATH jp.co.fit.vfreport.RdSpoolPlayerServer &
4.42.22. Monitoring a Java application that you created
This section describes the procedure to configure Java application which is monitored by JVM monitor resource. Specify the following Java option in one row to the option for Java application startup while Java application (the monitor target) is stopped. For n, specify the port number. If there is more than one Java VM to be monitored on the same machine, specify a unique port number. The port number specified here is also specified with the Cluster WebUI (Monitor Resource Properties - Monitor(special) tab - Connection Port).
-Dcom.sun.management.jmxremote.port=n
-Dcom.sun.management.jmxremote.ssl=false
-Dcom.sun.management.jmxremote.authenticate=false
Some Java applications require the following to be additionally specified.
- Djavax.management.builder.initial=<Class name of MBeanServerBuilder>
4.42.23. Monitor (special) tab
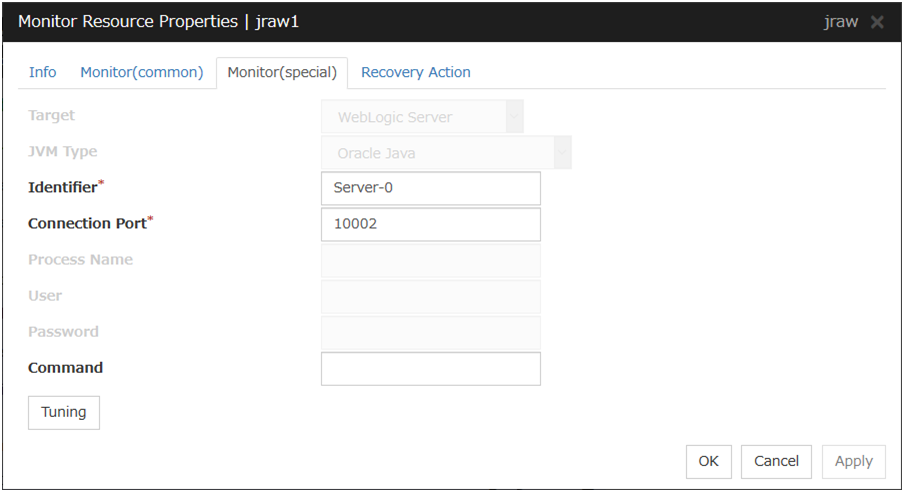
Target
Select the target to be monitored from the list. When monitoring WebSAM SVF for PDF, WebSAM Report Director Enterprise, or WebSAM Universal Connect/X, select WebSAM SVF. When monitoring a Java application that you created, select Java Application.
Select [JBoss] when monitoring standalone mode of JBoss Enterprise Application Platform. Select "JBoss Domain Mode" when monitoring the domain mode of JBoss Enterprise Application Platform.
Default: None
JVM Type
Select the Java VM on which the target application to be monitored is running.
For Java 8 (or later) and OpenJDK 8 (or later) or later, select Oracle Java(usage monitoring). For Java 8, the following specification changes have been made.
It has become impossible to acquire the maximum value of each memory in a non-heap area.
Perm Gen has been changed to Metaspace.
Compressed Class Space was added.
For Java 8, therefore, the monitor items on the Memory tab have been changed as below.
Monitoring for the use rate has been changed to monitoring for the amount used.
Perm Gen, Perm Gen[shared-ro], and Perm Gen[shared-rw] cannot be monitored. Clear the check box.
Metaspace and Compressed Class Space can be monitored.
For Java 9, the following specification changes have been made.
Code Cache has been divided.
For Java9, therefore, the monitor items on the Memory tab have been changed as below.
Code Cache cannot be monitored. Clear the check box.
CodeHeap non-nmethods, CodeHeap profiled, and CodeHeap non-profiled can be monitored.
For each monitor target, the following are selectable.
Default: None
Identifier (within 255 bytes)
The identifier is set to differentiate the relevant JVM monitor resource from another JVM monitor resource when the information on the application to be monitored is output to the JVM operation log of the relevant JVM monitor resource. For this purpose, set a unique character string between JVM monitor resources. You must specify the identifier.
Default: None
Connection Port (1024 to 65535)
Set the port number used by the JVM monitor resource when it establishes a JMX connection to the target Java VM. The JVM monitor resource obtains information by establishing a JMX connection to the target Java VM. Therefore, to register the JVM monitor resource, it is necessary to specify the setting by which the JMX connection port is opened for the target Java VM. You must specify the connection port. This is common to all the servers in the cluster. A value between 42424 and 61000 is not recommended.
Default: None
Process Name (within 1024 bytes)
Set a Process Name to identify the target JVM monitor resource when JVM monitor resource is connecting the target Java VM via JMX. Therefore, be sure to specify a character string that is unique among JVM monitor resources.
Default: None
User (within 255 bytes)
Specify the name of the administrator who will be making a connection with the target Java VM.
Default: None
Password (within 255 bytes)
Specify the password for the administrator who will be making a connection with the target Java VM.
Default: None
Command (within 255 bytes)
Specify the commands that will be executed if errors in the monitor target Java VM are detected. A specific command and argument(s) can be specified for each error cause. Use an absolute path to specify each command. Place the executable file name in double quotes ("") to specify it. Example) "/usr/local/bin/command" arg1 arg2Specify the commands that will be executed if connection to the monitor target Java VM cannot be established or if an error is detected in the process for acquiring the amount of resource usage on the Java VM.Default: None
When you click Tuning, the following information is displayed in the pop-up dialog box. Make detailed settings according to the descriptions below.
4.42.24. Memory tab (when Oracle Java or OpenJDK is selected for JVM Type)
Monitor Heap Memory Rate
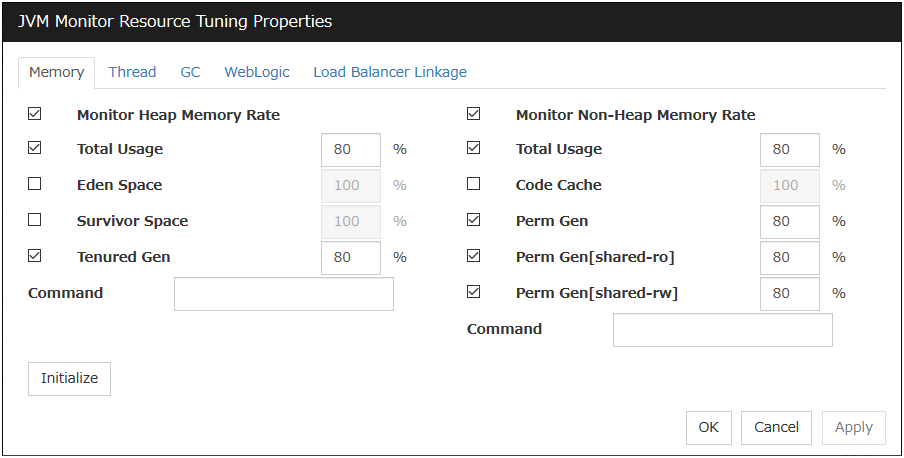
Enables the monitoring of the usage rates of the Java heap areas used by the target Java VM.
Total Usage (1 to 100)
Specify the threshold for the usage rate of the Java heap areas used by the target Java VM.
Default: 80[%]
Eden Space (1 to 100)
Specify the threshold for the usage rate of the Java Eden Space used by the target Java VM. If G1 GC is specified as the GC method, read it as G1 Eden Space.
Default: 100[%]
Survivor Space (1 to 100)
Specify the threshold for the usage rate of the Java Survivor Space used by the target Java VM. If G1 GC is specified as the GC method, read it as G1 Survivor Space.
Default: 100[%]
Tenured Gen (1 to 100)
Specify the threshold for the usage rate of the Java Tenured(Old) Gen area used by the target Java VM. If G1 GC is specified as the GC method, read it as G1 Old Gen.
Default: 80[%]
Monitor Non-Heap Memory Rate
Enables the monitoring of the usage rates of the Java non-heap areas used by the target Java VM.
Total Usage (1 to 100)
Specify the threshold for the usage rate of the Java non-heap areas used by the target Java VM.
Default: 80[%]
Code Cache (1 to 100)
Specify the threshold for the usage rate of the Java Code Cache area used by the target Java VM.
Default: 100[%]
Perm Gen (1 to 100)
Specify the threshold for the usage rate of the Java Perm Gen area used by the target Java VM.
Default: 80[%]
Perm Gen[shared-ro] (1 to 100)
Specify the threshold for the usage rate of the Java Perm Gen [shared-ro] area used by the target Java VM.
The Java Perm Gen [shared-ro] area is used when -client -Xshare:on -XX:+UseSerialGC is specified as the startup option of the target Java VM.
Default: 80[%]
Perm Gen[shared-rw] (1 to 100)
Specify the threshold for the usage rate of the Java Perm Gen [shared-rw] area used by the target Java VM.
The Java Perm Gen [shared-rw] area is used when -client -Xshare:on -XX:+UseSerialGC is specified as the startup option of the target Java VM.
Default: 80[%]
Command (within 255 bytes)
Specify the commands that will be executed if errors in the monitor target Java VM are detected. A specific command and argument(s) can be specified for each error cause. Use an absolute path to specify each command. Place the executable file name in double quotes ("") to specify it. Example) "/usr/local/bin/command" arg1 arg2Specify the commands that will be executed if errors are detected in the process for checking the amount of the usage of the Java heap area, Java non-heap area in the monitor target Java VM.Default: None
Initialize
Click Initialize to set all the items to their default values.
4.42.25. Memory tab (when Oracle Java(usage monitoring) is selected for JVM Type)
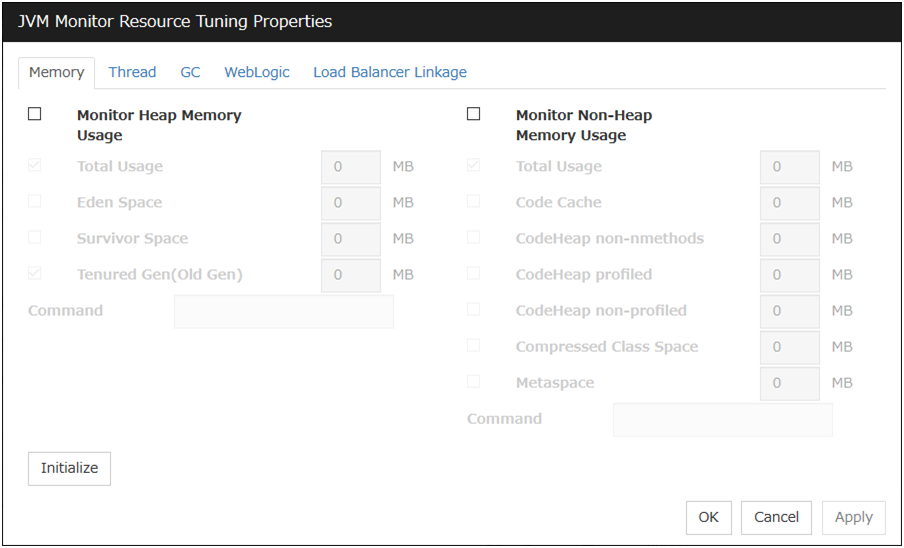
Monitor Heap Memory Usage
Enables the monitoring of the usage rates of the Java heap areas used by the target Java VM.
Total Usage (0 to 102400)
Specify the threshold for the usage rates of the Java heap areas used by the target Java VM. If zero is specified, this item is not monitored.
Default: 0[MB]
Eden Space (0 to 102400)
Specify the threshold for the usage rate of the Java Eden Space used by the target Java VM. If zero is specified, this item is not monitored. If G1 GC is specified as the GC method, read it as G1 Eden Space.
Default: 0[MB]
Survivor Space (0 to 102400)
Specify the threshold for the usage rate of the Java Survivor Space used by the target Java VM. If zero is specified, this item is not monitored. If G1 GC is specified as the GC method, read it as G1 Survivor Space.
Default: 0[MB]
Tenured Gen (0 to 102400)
Specify the threshold for the usage rate of the Java Tenured(Old) Gen area used by the target Java VM. If zero is specified, this item is not monitored. If G1 GC is specified as the GC method, read it as G1 Old Gen.
Default: 0[MB]
Monitor Non-Heap Memory Usage
Enables the monitoring of the usage rate of the Java non-heap areas used by the target Java VM.
Total Usage (0 to 102400)
Specify the threshold for the usage rate of the Java non-heap areas used by the target Java VM. If zero is specified, this item is not monitored.
Default: 0[MB]
Code Cache (0 to 102400)
Specify the threshold for the usage rate of the Java Code Cache area used by the target Java VM. If zero is specified, this item is not monitored.
Default: 0[MB]
CodeHeap non-nmethods (0 to 102400)
Specify the threshold for the usage rate of the Java CodeHeap non-nmethods areas used by the target Java VM. If zero is specified, this item is not monitored.
Default: 0[MB]
CodeHeap profiled (0 to 102400)
Specify the threshold for the usage rate of the Java CodeHeap profiled nmethods areas used by the target Java VM. If zero is specified, this item is not monitored.
Default: 0[MB]
CodeHeap non-profiled (0 to 102400)
Specify the threshold for the usage rate of the Java CodeHeap non-profiled nmethods areas used by the target Java VM. If zero is specified, this item is not monitored.
Default: 0[MB]
Compressed Class Space (0 to 102400)
Specify the threshold for the usage rate of the Compressed Class Space areas used by the target Java VM. If zero is specified, this item is not monitored.
Default: 0[MB]
Metaspace (0 to 102400)
Specify the threshold for the usage rate of the Metaspace area used by the target Java VM.
Default: 0[MB]
Command (within 255 bytes)
Specify the command to execute if an error is detected in the target Java VM. It is possible to specify the command to execute for each error cause, as well as arguments. Specify a full path. Enclose an executable file name with double quotes (""). Example) "/usr/local/bin/command" arg1 arg2Specify the commands that will be executed if errors are detected in the process for checking the amount of the usage of the Java heap area, Java non-heap area in the monitor target Java VM.Default: None
Initialize
Click the Initialize button to set all the items to their default values.
4.42.26. Memory tab (when Oracle JRockit is selected for JVM Type)
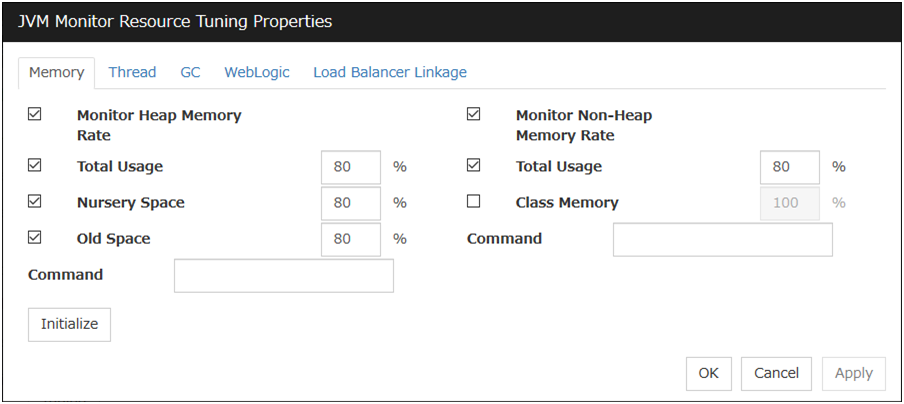
Displayed only when JRockit is selected for JVM Type.
Monitor Heap Memory Rate
Enables the monitoring of the usage rates of the Java heap areas used by the target Java VM.
Total Usage (1 to 100)
Specify the threshold for the usage rate of the Java heap areas used by the target Java VM.
Default: 80[%]
Nursery Space (1 to 100)
Specify the threshold for the usage rate of the Java Nursery Space used by the target JRockit JVM.
Default: 80[%]
Old Space (1 to 100)
Specify the threshold for the usage rate of the Java Old Space used by the target JRockit JVM.
Default: 80[%]
Monitor Non-Heap Memory Rate
Enables the monitoring of the usage rates of the Java non-heap areas used by the target Java VM.
Total Usage (1 to 100)
Specify the threshold for the usage rate of the Java non-heap areas used by the target Java VM.
Default: 80[%]
Class Memory (1 to 100)
Specify the threshold for the usage rate of the Java Class Memory used by the target JRockit JVM.
Default: 100[%]
Command (within 255 bytes)
Specify the commands that will be executed if errors in the monitor target Java VM are detected. A specific command and argument(s) can be specified for each error cause. Use an absolute path to specify each command. Place the executable file name in double quotes ("") to specify it. Example) "/usr/local/bin/command" arg1 arg2Specify the commands that will be executed if errors are detected in the process for checking the amount of the usage of the Java heap area, Java non-heap area in the monitor target Java VM.Default: None
Initialize
Click Initialize to set all the items to their default values.
4.42.27. Thread tab
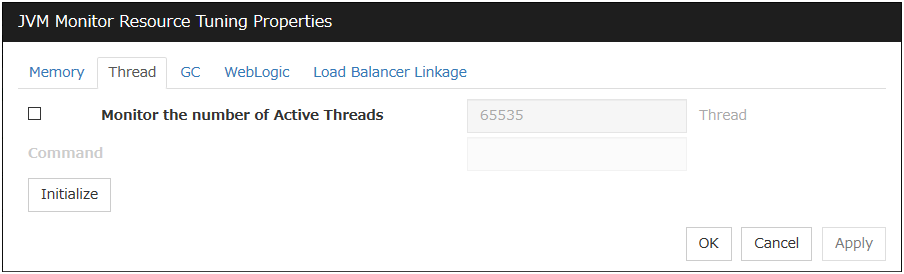
Monitor the number of Active Threads (1 to 65535)
Specify the upper limit threshold for the number of threads running on the monitor target Java VM.
Default: 65535 [threads]
Command (within 255 bytes)
Specify the commands that will be executed if errors in the monitor target Java VM are detected. A specific command and argument(s) can be specified for each error cause. Use an absolute path to specify each command. Place the executable file name in double quotes ("") to specify it. Example) "/usr/local/bin/command" arg1 arg2Specify the commands that will be executed if errors are detected in the process for checking the number of active threads in the monitor target Java VM.Default: None
Initialize
Click Initialize to set all the items to their default values.
4.42.28. GC tab
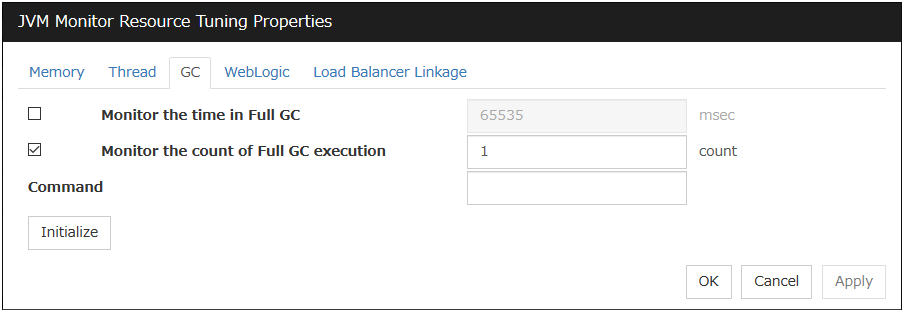
Monitor the time in Full GC (1 to 65535)
Specify the threshold for the Full GC execution time since previous measurement on the target Java VM. The threshold for the Full GC execution time is the average obtained by dividing the Full GC execution time by the number of times Full GC occurs since the previous measurement.
To determine the case in which the Full GC execution time since the previous measurement is 3000 milliseconds and Full GC occurs three times as an error, specify 1000 milliseconds or less.
Default: 65535 [milliseconds]
Monitor the count of Full GC execution (1 to 65535)
Specify the threshold for the number of times Full GC occurs since previous measurement on the target Java VM.
Default: 1 (time)
Command (within 255 bytes)
Specify the commands that will be executed if errors in the monitor target Java VM are detected. A specific command and argument(s) can be specified for each error cause. Use an absolute path to specify each command. Place the executable file name in double quotes ("") to specify it. Example) "/usr/local/bin/command" arg1 arg2Specify the commands that will be executed if errors are detected in the process for measuring time in Full GC and the count of Full GC execution in the monitor target Java VM.Default: None
Initialize
Click Initialize to set all the items to their default values.
4.42.29. WebLogic tab
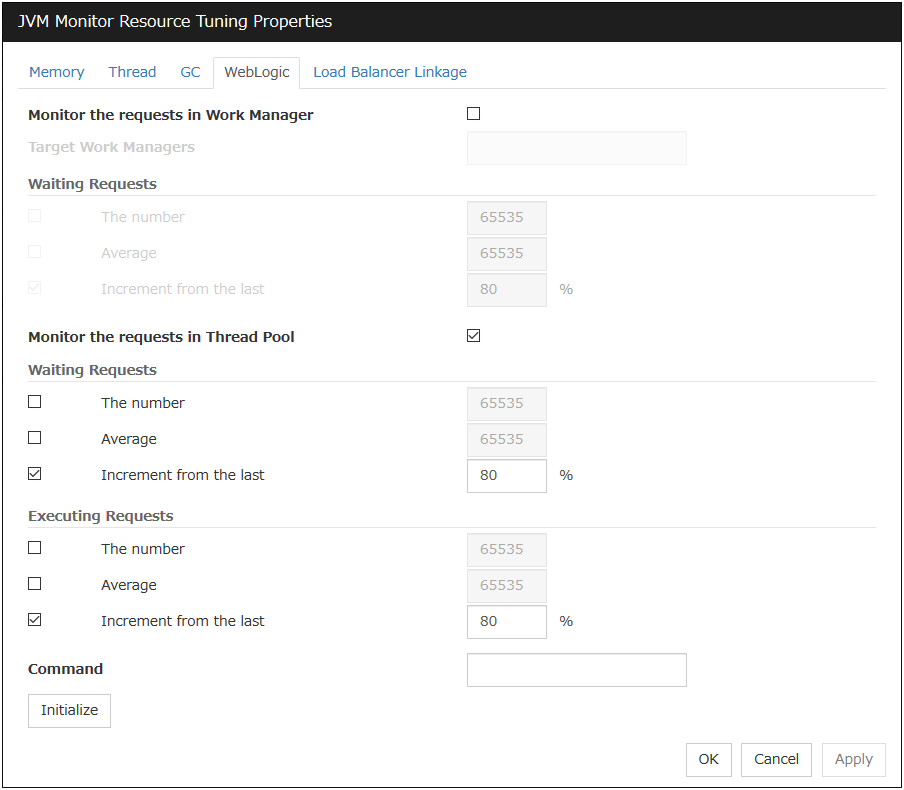
Displayed only when WebLogic Server is selected for Target.
Monitor the requests in Work Manager
Enables the monitoring of the wait requests by Work Managers on the WebLogic Server.
Target Work Managers
Specify the names of the Work Managers for the applications to be monitored on the target WebLogic Server. To monitor Work Managers, you must specify this setting.
App1[WM1,WM2,...];App2[WM1,WM2,...];...
For App and WM, only ASCII characters are valid (except Shift_JIS codes 0x005C and 0x00A1 to 0x00DF).
To specify an application that has an application archive version, specify "application_name#version" in App.
When the name of the application contains "[" and/or "]", prefix it with " \\ ".
(Ex.) When the application name is app[2], enter app\\[2\\].
Default: None
The number (1 to 65535)
Specify the threshold for the wait request count for the target WebLogic Server Work Manager(s).
Default: 65535
Average (1 to 65535)
Specify the threshold for the wait request count average for the target WebLogic Server Work Manager(s).
Default: 65535
Increment from the last (1 to 1024)
Specify the threshold for the wait request count increment since the previous measurement for the target WebLogic Server Work Manager(s).
Default: 80[%]
Monitor the requests in Thread Pool
In WebLogic Server thread pool to be monitored, the number of wait requests, and the monitoring settings of the number of executing request. The number of requests, HTTP requests and the number that was waiting to be processed and run inside WebLogic Server, and includes the number of requests of the processing performed by the internal EJB call and WebLogic Server. However, it can not judge an abnormal state to be increased. Please specify if you want to the collection of JVM statistics log.
Waiting Requests The number (1 to 65535)
Specify the threshold for the wait request count.
Default: 65535
Waiting Requests Average (1 to 65535)
Specify the threshold for the wait request count average.
Default: 65535
Waiting Requests Increment from the last (1 to 1024)
Specify the threshold for the wait request count increment since the previous measurement.
Default: 80[%]
Executing Requests The number (1 to 65535)
Specify the threshold for the number of requests executed per unit of time.
Default: 65535
Executing Requests Average (1 to 65535)
Specify the threshold for the average count of requests executed per unit of time.
Default: 65535
Executing Requests Increment from the last (1 to 1024)
Specify the threshold for the increment of the number of requests executed per unit of time since the previous measurement.
Default: 80[%]
Command (within 255 bytes)
Specify the commands that will be executed if errors in the monitor target Java VM are detected. A specific command and argument(s) can be specified for each error cause. Use an absolute path to specify each command. Place the executable file name in double quotes ("") to specify it. Example) "/usr/local/bin/command" arg1 arg2Specify the commands that will be executed if errors are detected in the process for executing requests in the Work Manager and Thread Pool of WebLogic Server.Default: None
Initialize
Click Initialize to set all the items to their default values.
4.42.30. Load Balancer Linkage tab
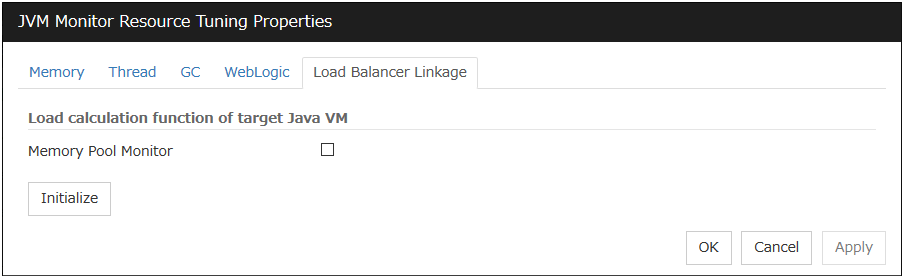
This screen appears when an item other than BIG-IP LTM is selected as the load balancer type.
Memory Pool Monitor
Enables the monitoring of the memory pool when notifying the load balancer of dynamic load information.
Initialize
Click the Initialize button to set all the items to their default values.
4.42.31. Load Balancer Linkage tab
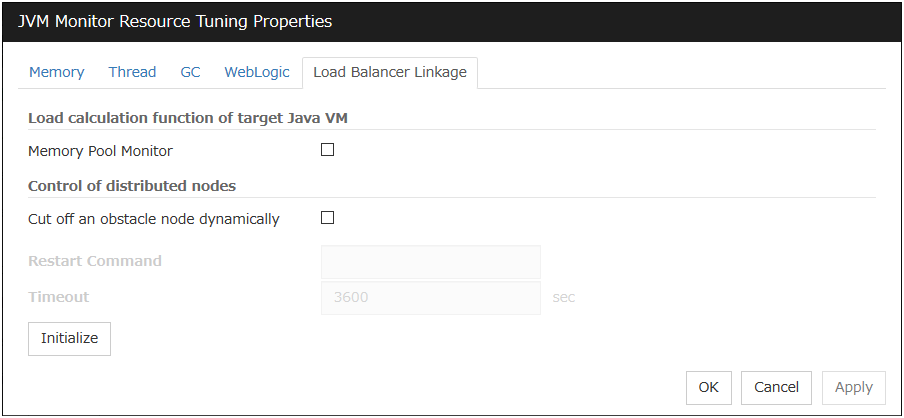
This screen appears when BIG-IP LTM is selected as the load balancer type.
Memory Pool Monitor
Enables the monitoring of the memory pool when notifying the load balancer of dynamic load information.
Cut off an obstacle node dynamically
When the JVM monitor detects a monitor target failure (example: the collection information exceeds the configured threshold), it sets whether to update the status of the BIG-IP LTM distributed node from "enable" to "disable."
Restart Command
Specify the absolute path of the command to be executed after waiting until the number of connections of the distributed node becomes 0. This function is effective when the monitor target is restarted when resident monitoring is performed and a monitor target failure is detected. Specify the same value between JVM monitor resources.
Timeout (0 to 2592000)
After updating the distributed node status from "enable" to "disable," the JVM monitor sets the timeout used when waiting until the number of connections of the distributed node falls to 0. If the timeout elapses, [Restart Command] is not executed.
Default: 3600 [sec]
Initialize
Click the Initialize button to set Memory Pool Monitor, Cut off an obstacle node dynamically, and Timeout to their default values.
4.43. Understanding System monitor resources
System monitor resources periodically collect statistical information about System resources analyze the information according to given knowledge data. System monitor resources serve to detect the exhaustion of resources early according to the results of analysis.
4.43.1. Notes on System monitor resource
To use a System monitor resource, zip and unzip packages must have been installed on the servers.
For the supported versions of System Resource Agent, see "Applications supported by monitoring options" in "Software" in "Installation requirements for EXPRESSCLUSTER" in the "Getting Started Guide".
For the recovery target, specify the resource to which fail-over is performed upon the detection of an error in resource monitoring by System Resource Agent.
The use of the default System Resource Agent settings is recommended.
Errors in resource monitoring may be undetectable when:
A value repeatedly exceeds and then falls below a threshold during whole system resource monitoring.
If the date or time of the OS has been changed while System Resource Agent is running, resource monitoring may operate incorrectly as described below because the timing of analysis which is normally done at 10 minute intervals may differ the first time after the date or time is changed. If either of the following occur, suspend and resume cluster.
No error is detected even after the specified duration for detecting errors has passed.
An error is detected before the specified duration for detecting errors has elapsed.
Once the cluster has been suspended and resumed, the collection of information is started from that point of time.
For the SELinux setting, set permissive or disabled.
The enforcing setting may disable the communication needed by EXPRESSCLUSTER.
The amount of system resources used is analyzed at 10-minute intervals. Thus, an error may be detected up to 10 minutes after the monitoring session.
The amount of disk resources used is analyzed at 60-minute intervals. Thus, an error may be detected up to 60 minutes after the monitoring session.
Specify a value smaller than the actual disk size when specifying the disk size for free space monitoring of a disk resource. If a value is specified that is larger than the actual disk size, an error will be detected due to insufficient free space.
If the monitored disk has been replaced, analyzed information up until the time of the disk replacement will be cleared if one of the following items of information differs between the previous and current disks.
Total disk capacity
File system
Disk resource monitoring can only monitor disk devices.
For server for which no swap was allocated, uncheck the monitoring of total virtual memory usage.
Disk usage information collected by System Resource Agent is calculated by using the total disk space and free disk space. This value may slightly differ from the disk usage which df(1) command shows because it uses a different calculation method.
Up to 64 disk units can be simultaneously monitored by the disk resource monitoring function.
If System monitor is not displayed in the Type column on the monitor resource definition screen, select Get License Info and then acquire the license information.
- Statistical information data of system resources.Path: <data path>/hasrm_monitor_list.xml.YYYYMMDDhhmmss.zipMaximum number of a file: 1500
- Analyzed information data of system resources.Path: <data path>/hasrm_analyze_list.xml.YYYYMMDDhhmmss.zipMaximum number of a file: 3
- Statistical information data of disk resources.Path: <data path>/hasrm_diskcapacity_monitor_list.xml.YYYYMMDDhhmmss.zipMaximum number of a file: 10
- Analyzed information data of disk resources.Path: <data path>/hasrm_diskcapacity_analyze_list.xml.YYYYMMDDhhmmss.zipMaximum number of a file: 3
4.43.2. How System monitor resources perform monitoring
System monitor resources monitor the following:
Periodically collect the amounts of system resources and disk resources used and then analyze the amounts.
An error is recognized if the amount of a resource used exceeds a pre-set threshold.
When an error detected state persists for the monitoring duration, it is posted as an error detected during resource monitoring.
System resource monitoring with the default values reports an error found in resource monitoring 60 minutes later if the resource usage does not fall below 90%.
The following shows an example of error detection for the total memory usage in system resource monitoring with the default values.

The total memory usage remains at the total memory usage threshold or higher as time passes, for at least a certain duration of time.

The total memory usage rises and falls in the vicinity of the total memory usage threshold as time passes, but always remains under that threshold.
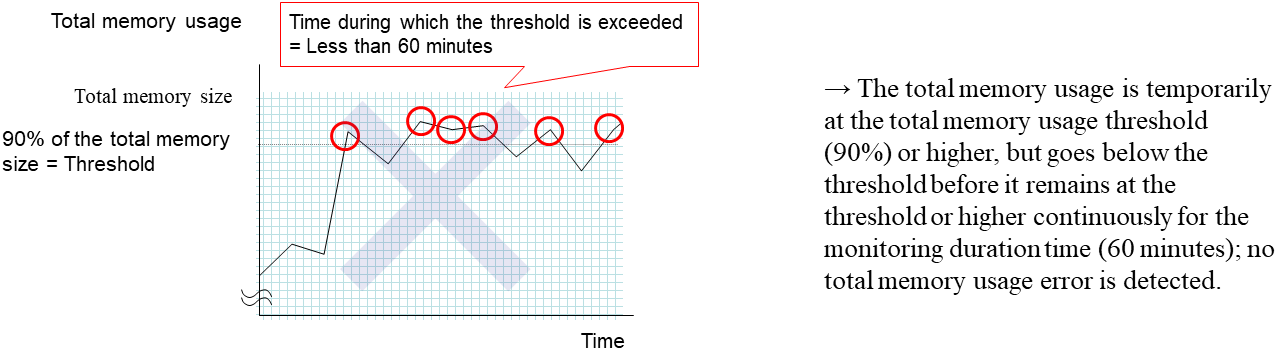
If disk resource monitoring operated under the default settings, it will report a notice level error after 24 hours.
The following chart describes how disk resource monitoring detects disk usage errors when operating under the default settings.
Monitoring disk usage by warning level
In the following example, disk usage exceeds the threshold which is specified as the warning level upper limit.
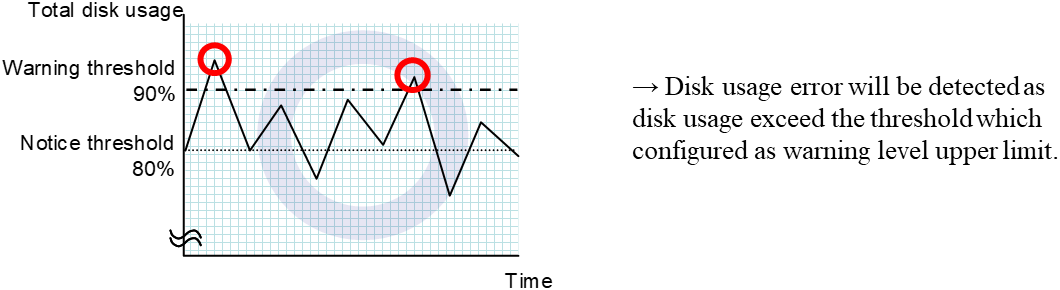
In the following example, disk usage increases and decreases within certain range, and does not exceed the threshold which is specified as the warning level upper limit.
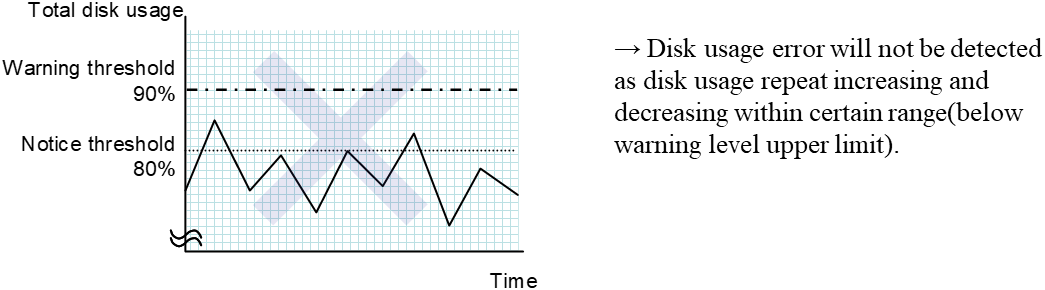
Monitoring disk usage by notice level
In the following example, disk usage continuously exceeds the threshold specified as the notification level upper limit, and the duration exceeds the set length.
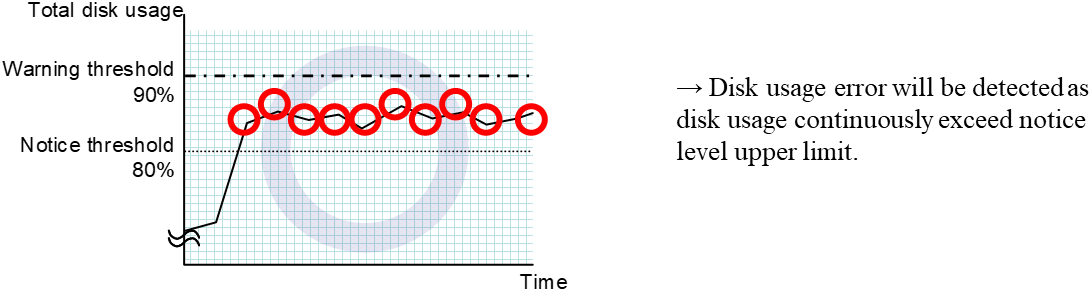
In the following example, disk usage increases and decreases within a certain range, and does not exceed the threshold specified as the notification level upper limit.
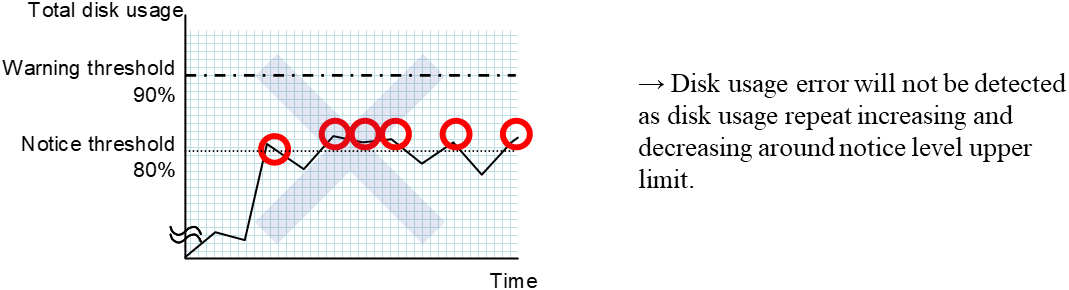
4.43.3. Monitor (special) tab
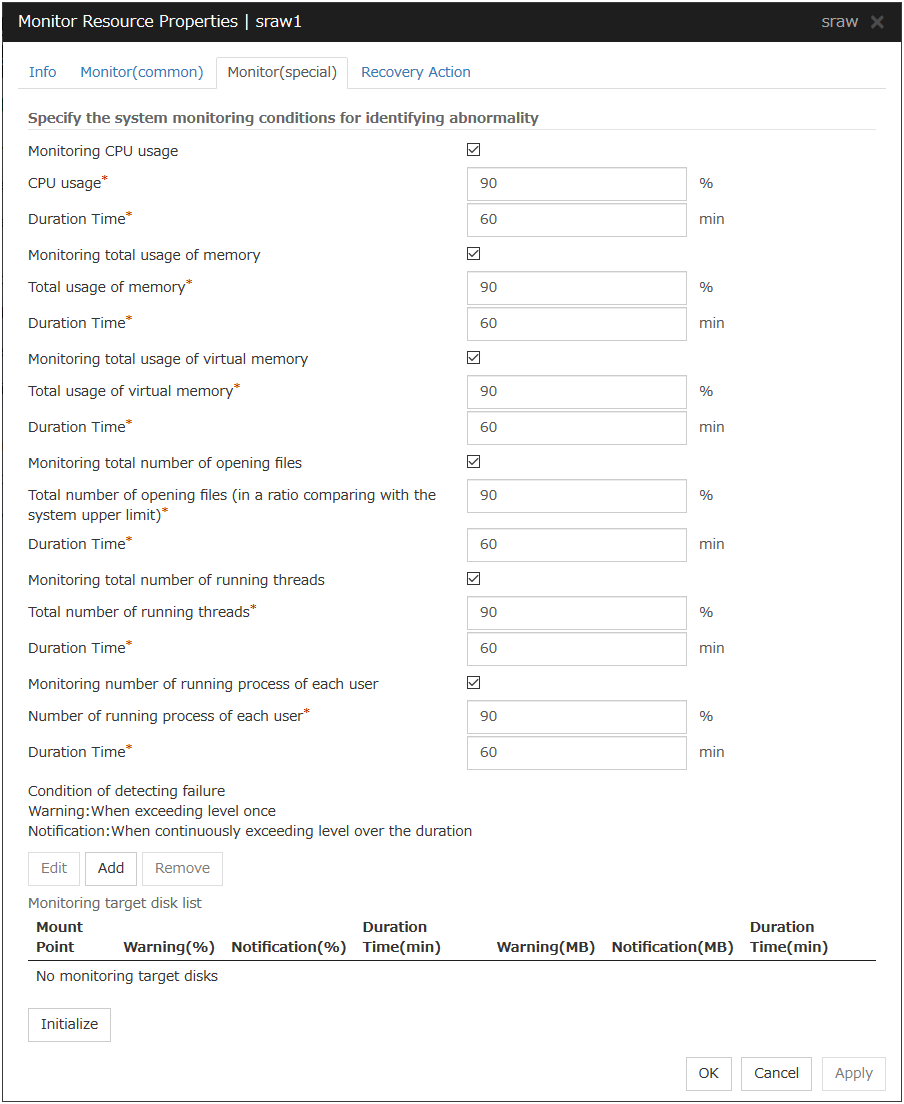
Monitoring CPU usage
Enables CPU usage monitoring.
CPU usage (1 to 100)
Specify the threshold for the detection of the CPU usage.
Duration Time (1 to 1440)
Specify the duration for detecting the CPU usage.
If the threshold is continuously exceeded over the specified duration, the detection of an error is recognized.
Monitoring total usage of memory
Enables the monitoring of the total usage of memory.
Total usage of memory (1 to 100)
Specify the threshold for the detection of a memory use amount error (percentage of the memory size implemented on the system).
Duration Time (1 to 1440)
Specify the duration for detecting a total memory usage error.
If the threshold is continuously exceeded over the specified duration, the detection of an error is recognized.
Monitoring total usage of virtual memory
Enables the monitoring of the total usage of virtual memory.
Total usage of virtual memory (1 to 100)
Specify the threshold for the detection of a virtual memory usage error.
Duration Time (1 to 1440)
Specify the duration for detecting a total virtual memory usage error.
If the threshold is continuously exceeded over the specified duration, the detection of an error is recognized.
Monitoring total number of opening files
Enables the monitoring of the total number of opening files.
Total number of opening files (in a ratio comparing with the system upper limit) (1 to 100)
Specify the threshold for the detection of an error related to the total number of opening files (percentage of the system upper limit).
Duration Time (1 to 1440)
Specify the duration for detecting an error with the total number of opening files.
If the threshold is continuously exceeded over the specified duration, the detection of an error is recognized.
Monitoring total number of running threads
Enables the monitoring of the total number of running threads.
Total number of running threads (1 to 100)
Specify the threshold for the detection of an error related to the total number of running threads (percentage of the system upper limit).
Duration Time (1 to 1440)
Specify the duration for detecting an error with the total number of running threads.
If the threshold is continuously exceeded over the specified duration, the detection of an error is recognized.
Monitoring number of running processes of each user
Enables the monitoring of the number of processes being run of each user
Number of running processes of each user (1 to 100)
Specify the threshold for the detection of an error related to the number of processes being run of each user (percentage of the system upper limit).
Duration Time (1 to 1440)
Specify the duration for detecting an error with the number of processes being run of each user.
If the threshold is continuously exceeded over the specified duration, the detection of an error is recognized.
Add
Click this to add disks to be monitored. The Input of watch condition dialog box appears.
Configure the detailed monitoring conditions for error determination, according to the descriptions given in the Input of watch condition dialog box.
Remove
Click this to remove a disk selected in Disk List so that it will no longer be monitored.
Edit
Click this to display the Input of watch condition dialog box. The dialog box shows the monitoring conditions for the disk selected in Disk List. Edit the conditions and click OK.
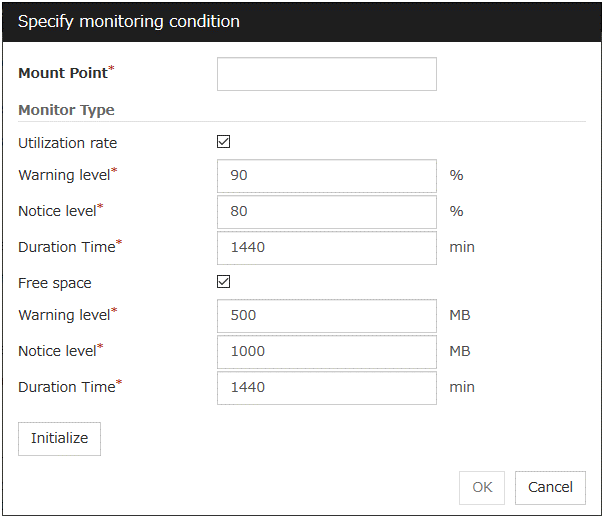
Mount point (within 1024 bytes)
Set the mountpoint to be monitored. The name must begin with a forward slash (/).
Utilization rate
Enables the monitoring of the disk usage.
Warning level (1 to 100)
Specify the threshold for warning level error detection for disk usage.
Notice level (1 to 100)
Specify the threshold for notice level error detection for disk usage.
Duration Time (1 to 43200)
Specify the duration for detecting a notice level error of the disk usage rate.
If the threshold is continuously exceeded over the specified duration, the detection of an error is recognized.
Free space
Enables the monitoring of the free disk space.
Warning level (1 to 4294967295)
Specify the amount of disk space (in megabytes) for which the detection of an free disk space error at the warning level is recognized.
Notice level (1 to 4294967295)
Specify the amount of disk space (in megabytes) for which the detection of an free disk space error at the notice level is recognized.
Duration Time (1 to 43200)
Specify the duration for detecting a notice level error related to the free disk space.
If the threshold is continuously exceeded over the specified duration, the detection of an error is recognized.
4.44. Understanding Process resource monitor resources
Process resource monitor resources periodically collect statistical information about resources used by processes and analyze the information according to given knowledge data. Process resource monitor resources serve to detect the exhaustion of resources early according to the results of analysis.
4.44.1. Notes on Process resource monitor resource
To use a Process resource monitor resource, zip and unzip packages must have been installed on the servers.
For the supported versions, see "Applications supported by monitoring options" in "Installation requirements for EXPRESSCLUSTER" in the "Getting Started Guide".
For the recovery target, specify the resource to which fail-over is performed upon the detection of an error in resource monitoring by Process resource monitor resource.
The use of the default Process resource monitor resource settings is recommended.
Swapped out processes are not subject to the detection of resource errors.
If the date or time of the OS has been changed while System Resource Agent is running, resource monitoring may operate incorrectly as described below because the timing of analysis which is normally done at 10 minute intervals may differ the first time after the date or time is changed.
If either of the following occur, suspend and resume cluster.
No error is detected even after the specified duration for detecting errors has passed.
An error is detected before the specified duration for detecting errors has elapsed.
Once the cluster has been suspended and resumed, the collection of information is started from that point of time.
For the SELinux setting, set permissive or disabled.
The enforcing setting may disable the communication needed by EXPRESSCLUSTER.
The amount of process resources used is analyzed at 10-minute intervals. Thus, an error may be detected up to 10 minutes after the monitoring session.
- Statistical information data of process resources.Path: <data path>/hasrm_monitor_list.xml.YYYYMMDDhhmmss.zipMaximum number of a file: 1500
- Analyzed information data of system resources.Path: <data path>/hasrm_analyze_list.xml.YYYYMMDDhhmmss.zipMaximum number of a file: 3
To return the status of the process resource monitor resource from error to normal, perform either of the following:
Suspending and resuming the cluster
Stopping and starting the cluster
4.44.2. How Process resource monitor resources perform monitoring
Process resource monitor resources monitor the following:
Periodically collect the amounts of process resources used and then analyze the amounts.
An error is recognized if the amount of a resource used exceeds a pre-set threshold.
When an error detected state persists for the monitoring duration, it is posted as an error detected during resource monitoring.
If process resource monitoring (of the CPU, memory, number of opening files, or number of zombie processes) operated by using the default values, a resource error is reported after 24 hours.
The following chart describes how process resource monitoring detects memory usage errors.
In the following example, as time progresses, memory usage increases and decreases, the maximum value is updated more times than specified, and increases by more than 10% from its initial value.
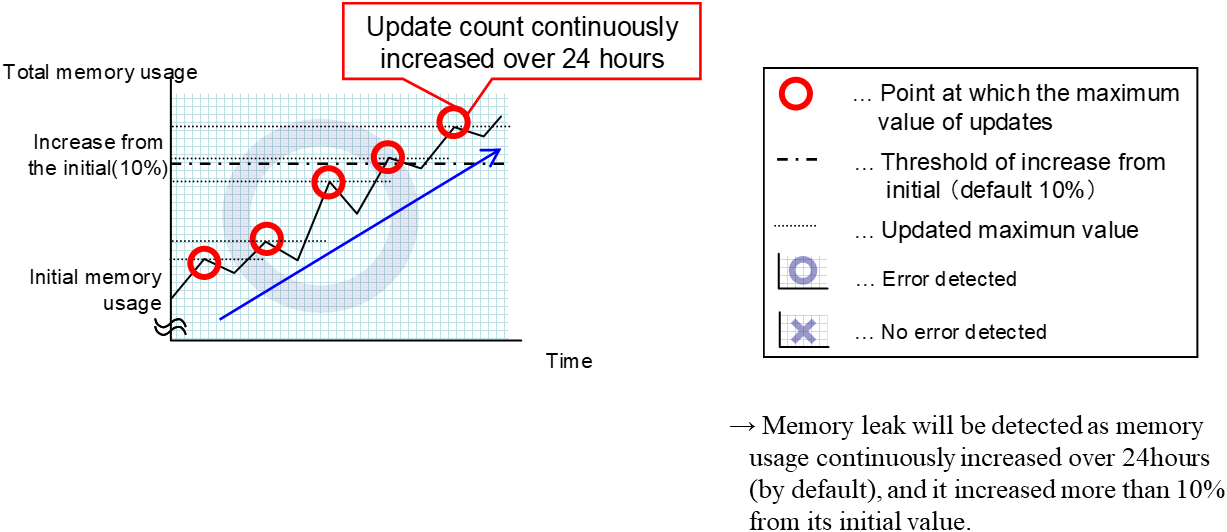
In the following example, memory usage increases and decreases, but remains within a set range.
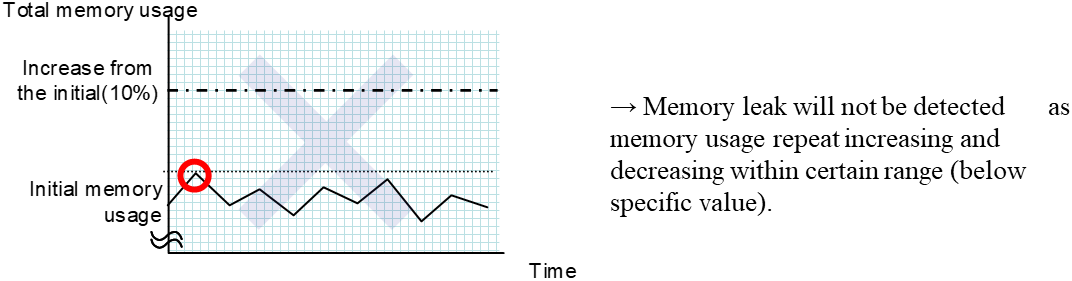
4.44.3. Monitor (special) tab
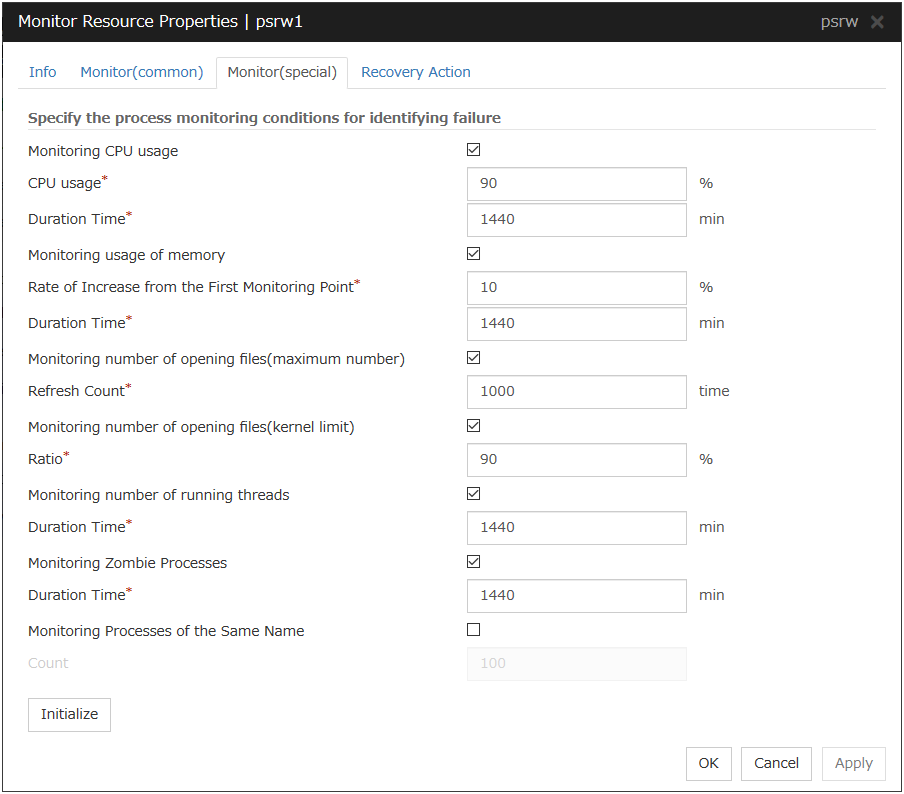
Monitoring CPU usage
Enables CPU usage monitoring.
CPU usage (1 to 100)
Specify the threshold for the detection of the CPU usage.
Duration Time (1 to 129600)
Specify the duration for detecting the CPU usage.
If the threshold is continuously exceeded over the specified duration, the detection of an error is recognized.
Monitoring usage of memory
Enables the monitoring of the usage of memory.
Rate of Increase from the First Monitoring Point (1 to 1000)
Specify the threshold for the detection of a memory use amount error.
Duration Time (1 to 129600)
Specify the duration for detecting a total memory usage error.
If the threshold is continuously exceeded over the specified duration, the detection of an error is recognized.
Monitoring number of opening files(maximum number)
Enables the monitoring of the number of opening files(maximum number).
Refresh Count (1 to 1024)
Specify the refresh count for the detection of the number of opening files error.If the number of opening files maximum value is updated more count than specified, the detection of an error is recognized.
Monitoring number of opening files(kernel limit)
Enables the monitoring of the number of opening files(kernel limit).
Ratio (1 to 100)
Specify the ration for detection of the opening files(the percentage to the kernel limit).
Monitoring number of running threads
Enables the monitoring of the number of running threads.
Duration Time (1 to 129600)
Specify the duration for detecting an error with the total number of running threads.
If the threshold is continuously exceeded over the specified duration, the detection of an error is recognized.
Monitoring Zombie Process
Enables the monitoring of Zombie Processes.
Duration Time (1 to 129600)
Specify the duration for detecting Zombie Processes.
If process is a Zombie Process over the specified duration, the detection of an error is recognized.
Monitoring Processes of the Same Name
Enables the monitoring of Processes of the Same Name.
Count (1 to 10000)
Specify the count for detecting an error with the processes of the same name.If the processes of the same name has been exists more than specified numbers, the detection of an error is recognized.
4.45. Understanding AWS Elastic IP monitor resources
For EIP control, AWS Elastic IP monitor resources confirm the existence of EIPs by using the AWS CLI command.
4.45.1. Notes on AWS Elastic IP monitor resources
AWS Elastic IP monitor resources are automatically created when AWS Elastic IP resources are added. A single AWS Elastic IP monitor resource is automatically created for a single AWS Elastic IP resource.
See "Setting up AWS Elastic IP resources" in "Notes when creating EXPRESSCLUSTER configuration data" in "Notes and Restrictions" in the "Getting Started Guide".
4.45.2. Applying environment variables to AWS CLI run from the AWS Elastic IP monitor resource
See "Applying environment variables to AWS CLI run from the AWS Elastic IP resource" in "Understanding AWS Elastic IP resources" in "3. Group resource details" in this guide.
4.45.3. Monitor (special) tab
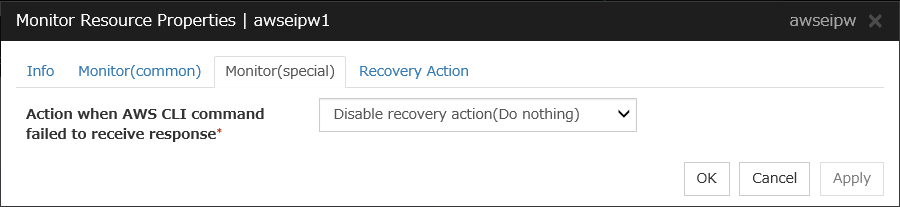
Action when AWS CLI command failed to receive response
Specify the action to be taken when acquiring the AWS CLI command response fails. This failure occurs, for example, when a region endpoint is down due to maintenance, when AWS CLI timeout occurs because of connection route troubles, heavy load or delay, or when a credential error occurs. Refer to the following instructions:
Select Enable recovery action if you want to perform failover when AWS CLI command fails.
Select Disable recovery action(Display warning) if you want to show a warning message without failover when AWS CLI command fails.
Select Disable recovery action(Do nothing) if you think this error is CLI command failure (a monitoring target itself is in normal status) and no action needs to be taken. This option is recommended as still error detection can find EIP error (e.g. no EIP is found).
4.46. Understanding AWS Virtual IP monitor resources
For VIP control, AWS Virtual IP monitor resources confirm the existence of VIPs and the soundness of VPC routing by using the OS API and AWS CLI commands. AWS CLI command is executed for AWS Virtual IP monitor resources while monitoring to check the route table information.
4.46.1. Notes on AWS Virtual IP monitor resources
AWS Virtual IP monitor resources are automatically created when AWS Virtual IP resources are added. A single AWS Virtual IP monitor resource is automatically created for a single AWS Virtual IP resource.
See "Setting up AWS Virtual IP resources" in "Notes when creating EXPRESSCLUSTER configuration data" in "Notes and Restrictions" in the "Getting Started Guide".
4.46.2. Applying environment variables to AWS CLI run from the AWS Virtual IP monitor resource
See "Applying environment variables to AWS CLI run from the AWS Virtual IP resource" in "Understanding AWS Virtual IP resources" in "3. Group resource details" in this guide
4.46.3. Monitor (special) tab

Action when AWS CLI command failed to receive response
Specify the action to be taken when acquiring the AWS CLI command response fails. This failure occurs, for example, when a region endpoint is down due to maintenance, when AWS CLI timeout occurs because of connection route troubles, heavy load or delay, or when a credential error occurs. Refer to the following instructions:
Select Enable recovery action if you want to perform failover when AWS CLI command fails.
Select Disable recovery action(Display warning) if you want to show a warning message without failover when AWS CLI command fails.
Select Disable recovery action(Do nothing) if you think this error is CLI command failure (a monitoring target itself is in normal status) and no action needs to be taken. This option is recommended as still error detection can find errors, for example when troubles are found in VPC routing condition or no VIP is found.
4.47. Understanding AWS AZ monitor resources
AWS AZ monitor resources monitor the soundness of the AZ to which each server belongs, by using the AWS CLI command. When the command result is available, AZ is in normal status. When information or impaired, AZ is in warning status. When unavailable, AZ is in error status. If you use internal version earlier than 4.2.0.1, only available represents the normal status (other results are categorized in error status).
4.47.1. Notes on AWS AZ monitor resources
When monitoring an AZ, create a single AWS AZ monitor resource.
See "Setting up AWS Elastic IP resources" and "Setting up AWS Virtual IP resources" in "Notes when creating EXPRESSCLUSTER configuration data" in "Notes and Restrictions" in the "Getting Started Guide".
4.47.2. Applying environment variables to AWS CLI run from the AWS AZ monitor resource
See "Applying environment variables to AWS CLI run from the AWS Virtual IP resource" in "Understanding AWS Virtual IP resources" in "3. Group resource details" in this guide.
4.47.3. Monitor (special) tab
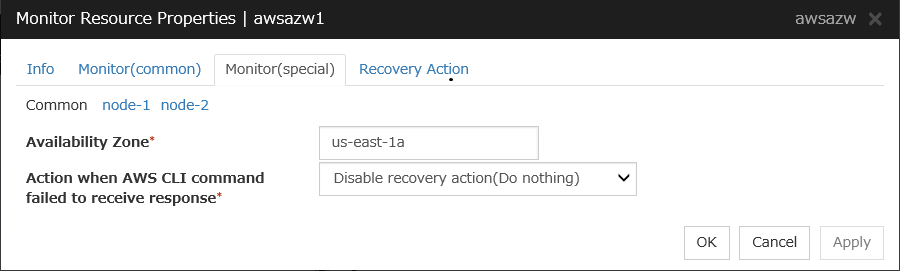
Availability Zone (within 45 bytes) Server Individual Setup
Specify the availability zone in which to perform monitoring.
Action when AWS CLI command failed to receive response
Specify the action to be taken when acquiring the AWS CLI command response fails. This failure occurs, for example, when a region endpoint is down due to maintenance, when AWS CLI timeout occurs because of connection route troubles, heavy load or delay, or when a credential error occurs. Refer to the following instructions:
Select Enable recovery action if you want to perform failover when AWS CLI command fails.
Select Disable recovery action(Display warning) if you want to show a warning message without failover when AWS CLI command fails.
Select Disable recovery action(Do nothing) if you think this error is CLI command failure (a monitoring target itself is in normal status) and no action needs to be taken. This option is recommended as still error detection can find errors, for example when troubles are found in AZ condition.
4.48. Understanding AWS DNS monitor resources
AWS DNS monitor resources confirm the soundness of the registered IP address by using the OS API and AWS CLI commands.
Errors are detected when:
The resource record set does not exist.
The registered IP Address cannot obtained by name resolution of the virtual host name (DNS name).
4.48.1. Notes on AWS DNS monitor resources
AWS DNS monitor resources are automatically created when AWS DNS resources are added. A single AWS DNS monitor resource is automatically created for a single AWS DNS resource.
See "Setting up AWS DNS resources" in "Notes when creating EXPRESSCLUSTER configuration data" in "Notes and Restrictions" in the "Getting Started Guide".
4.48.2. Applying environment variables to AWS CLI run from the AWS DNS monitor resource
See "Applying environment variables to AWS CLI run from the AWS DNS resource" in "Understanding AWS DNS resources" in "3. Group resource details" in this guide.
4.48.3. Monitor (special) tab
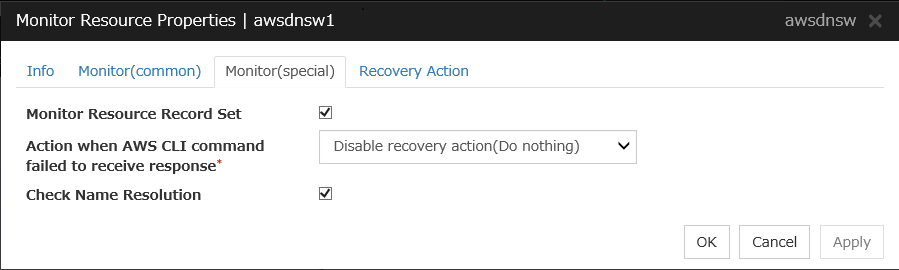
Monitor Resource Record Set
Action when AWS CLI command failed to receive response
Specify the action to be taken when acquiring the AWS CLI command response fails. This failure occurs, for example, when a region endpoint is down due to maintenance, when AWS CLI timeout occurs because of connection route troubles, heavy load or delay, or when a credential error occurs. Refer to the following instructions:
Select Enable recovery action if you want to perform failover when AWS CLI command fails.
Select Disable recovery action(Display warning) if you want to show a warning message without failover when AWS CLI command fails.
Select Disable recovery action(Do nothing) if you think this error is CLI command failure (a monitoring target itself is in normal status) and no action needs to be taken. This option is recommended as still error detection can find errors, for example when troubles are found in IP addresses.
Check Name Resolution
4.49. Understanding Azure probe port monitor resources
Azure probe port monitor resources perform alive monitoring on a probe port control process that starts when Azure probe port resoruces are active on the node on which the Azure probe port resources are active. If the process does not start normally, a monitoring error occurs.
4.49.1. Notes on Azure probe port monitor resources
Azure probe port monitor resources are automatically created when Azure probe port resources are added. One Azure probe port monitor resource is automatically created per Azure probe port resource.
In Azure probe port monitor resources, I will monitor the occurrence of probe standby timeout on the Azure probe port resources. Therefore, Interval of Azure probe port monitor resource, than the value of the set in the Azure probe port resources monitored Probe Wait Timeout, you need to set a large value.
See "Azure probe port resource settings" on "Notes when creating EXPRESSCLUSTER configuration data" in "Notes and Restrictions" of the "Getting Started Guide".
4.49.2. Monitor (special) tab
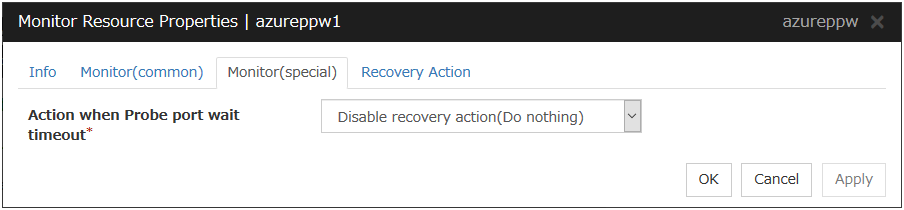
Action when Probe port wait timeout
Specify the recovery action to be taken when a probe port wait timeout occurs in Azure probe port resources.
4.50. Understanding Azure load balance monitor resources
Azure load balance monitor resources monitor to see if a port with the same port number as that of the probe port has been open on the node on which the Azure prove port resources are not active.
4.50.1. Note on Azure load balance monitor resources
Azure load balance monitor resources are automatically created when Azure probe port resources are added. One Azure load balance monitor resource is automatically created per Azure probe port resource.
See "Setting up Azure probe port resources" on "Notes when creating EXPRESSCLUSTER configuration data" in "Notes and Restrictions" of the "Getting Started Guide".
See "Setting up Azure load balance monitor resources" on "Notes when creating EXPRESSCLUSTER configuration data" in "Notes and Restrictions" of the "Getting Started Guide".
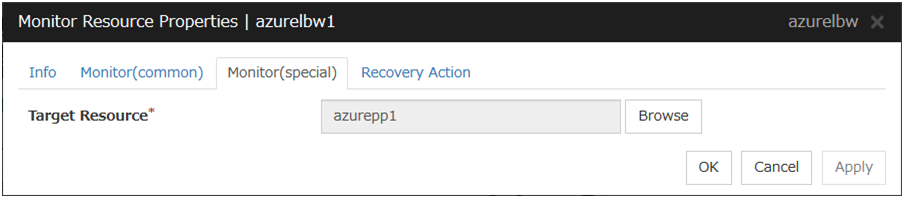
4.51. Understanding Azure DNS monitor resources
Azure DNS monitor resources issue a query to the authoritative DNS server and confirm the soundness of the registered IP address.
Errors are detected when:
The registered IP Address cannot obtained by name resolution of the virtual host name (DNS name).
Failed to acquire the list of DNS servers.
4.51.1. Notes on Azure DNS monitor resources
Azure DNS monitor resources are automatically created when Azure DNS resources are added. A single Azure DNS monitor resource is automatically created for a single Azure DNS resource.
When using public DNS zone, charge occurs for registering the zone and query. Therefore, when Check Name Resolution is set to on, the charge occurs per Interval.
See "Setting up Azure resources" in "Notes when creating EXPRESSCLUSTER configuration data" in "Notes and Restrictions" of the "Getting Started Guide".
4.51.2. Monitor (special) tab
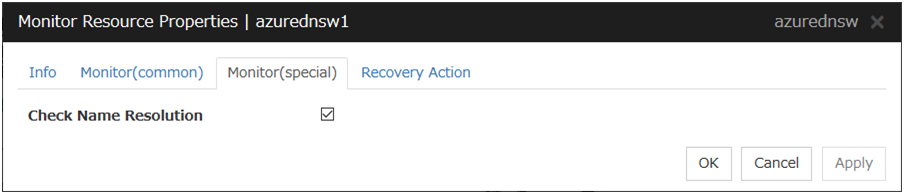
Check Name Resolution
4.52. Understanding Google Cloud Virtual IP monitor resources
Google Cloud Virtual IP monitor resources perform alive monitoring of nodes running Google Cloud Virtual IP resources about control processes which start to run when Google Cloud Virtual IP resources become active. If the process does not start properly, the system takes it as an error. Also, timeout on health check wait time may become an error depending on Action when Health check wait timeout settings.
4.52.1. Notes on Google Cloud Virtual IP monitor resources
Google Cloud Virtual IP monitor resources are added automatically when you add Google Cloud Virtual IP resources. One Google Cloud Virtual IP monitor resource is created automatically for one Google Cloud Virtual IP resource.
Google Cloud Virtual IP monitor resources check if timeout occurs or not on health check wait time in Google Cloud Virtual IP resources. Therefore the monitor interval values of Google Cloud Virtual IP monitor resources must be larger than the Health check timeout values set in the target Google Cloud Virtual IP resources.
Refer to "Google Cloud Virtual IP resource settings" on "Notes when creating EXPRESSCLUSTER configuration data" in "Notes and Restrictions" of the "Getting Started Guide".
4.52.2. Monitor (special) tab
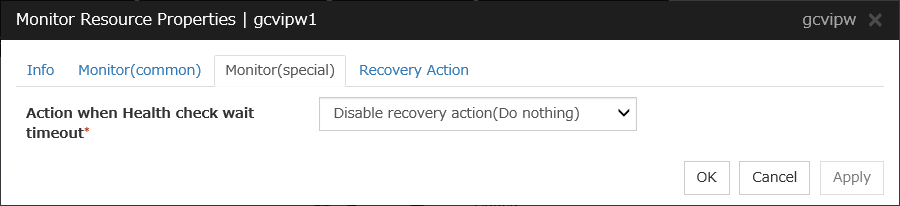
Action when Health check wait timeout
Specifies actions when timeout of health check wait time occurs in Google Cloud Virtual IP resources
4.53. Understanding Google Cloud load balance monitor resources
Google Cloud load balance monitor resources perform monitoring of nodes not running Google Cloud Virtual IP resources and check if the same port number of the health check port number opens.
4.53.1. Notes on Google Cloud load balance monitor resources
Google Cloud load balance monitor resources are added automatically when you add Google Cloud Virtual IP resources. One Google Cloud load balance monitor resource is created automatically for one Google Cloud Virtual IP resource.
Refer to "Setting up Google Cloud Virtual IP resources" on "Notes when creating EXPRESSCLUSTER configuration data" in "Notes and Restrictions" of the "Getting Started Guide".
Refer to "Setting up Google Cloud load balance monitor resources" on "Notes when creating EXPRESSCLUSTER configuration data" in "Notes and Restrictions" of the "Getting Started Guide".
4.53.2. Monitor (special) tab
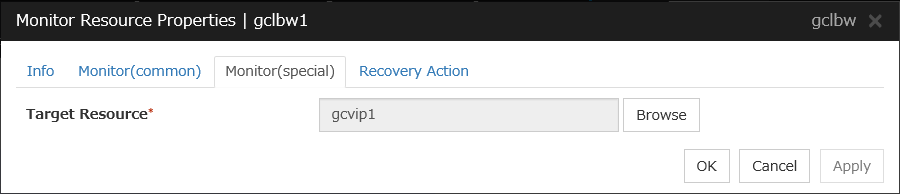
Target Resource
Specifies a name of the target Google Cloud Virtual IP resource.
4.54. Understanding Oracle Cloud Virtual IP monitor resources
Oracle Cloud Virtual IP monitor resources perform alive monitoring of nodes running Oracle Cloud Virtual IP resources about control processes which start to run when Oracle Cloud Virtual IP resources become active. If the process does not start properly, the system takes it as an error. Also, timeout on health check wait time may become an error depending on Action when Health check wait timeout settings.
4.54.1. Notes on Oracle Cloud Virtual IP monitor resource
Oracle Cloud Virtual IP monitor resources are added automatically when you add Oracle Cloud Virtual IP resources. One Oracle Cloud Virtual IP monitor resource is created automatically for one Oracle Cloud Virtual IP resource.
Oracle Cloud Virtual IP monitor resources check if timeout occurs or not on health check wait time in Oracle Cloud Virtual IP resources. Therefore the monitor interval values of Oracle Cloud Virtual IP monitor resources must be larger than the Health check timeout values set in the target Oracle Cloud Virtual IP resources.
Refer to "Oracle Cloud Virtual IP resource settings" on "Notes when creating EXPRESSCLUSTER configuration data" in "Notes and Restrictions" of the "Getting Started Guide".
4.54.2. Monitor (special) tab
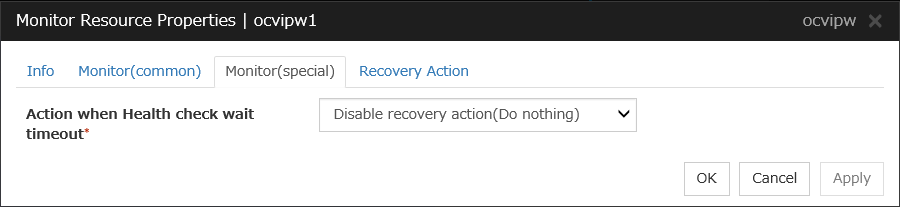
Action when Health check wait timeout
Specifies actions when timeout of health check wait time occurs in Oracle Cloud Virtual IP resources.
4.55. Understanding Oracle Cloud load balance monitor resources
Oracle Cloud load balance monitor resources perform monitoring of nodes not running Oracle Cloud Virtual IP resources and check if the same port number of the health check port number opens.
4.55.1. Notes on Oracle Cloud load balance monitor resources
Oracle Cloud load balance monitor resources are added automatically when you add Oracle Cloud Virtual IP resources. One Oracle Cloud load balance monitor resource is created automatically for one Oracle Cloud Virtual IP resource.
Refer to "Setting up Oracle Cloud Virtual IP resources" on "Notes when creating EXPRESSCLUSTER configuration data" in "Notes and Restrictions" of the "Getting Started Guide".
Refer to "Setting up Oracle Cloud load balance monitor resources" on "Notes when creating EXPRESSCLUSTER configuration data" in "Notes and Restrictions" of the "Getting Started Guide".
4.55.2. Monitor (special) tab
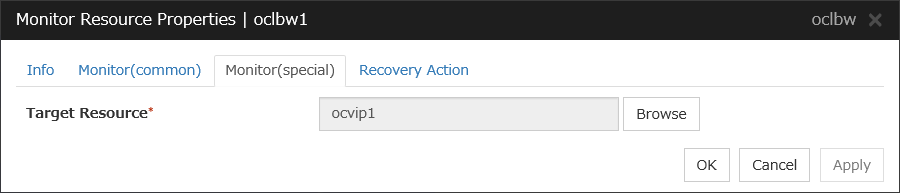
Target Resource
Specifies a name of the target Oracle Cloud Virtual IP resource.